Anyone old enough to remember the euphoric action on May 2, 2012 when Bin-Laden captured? $ES_F $SPY $SPX pic.twitter.com/8xMCd1AWzO
— Chicagostock (@Chicagostock) March 2, 2017
https://twitter.com/Chicagostock/status/837413741125828608
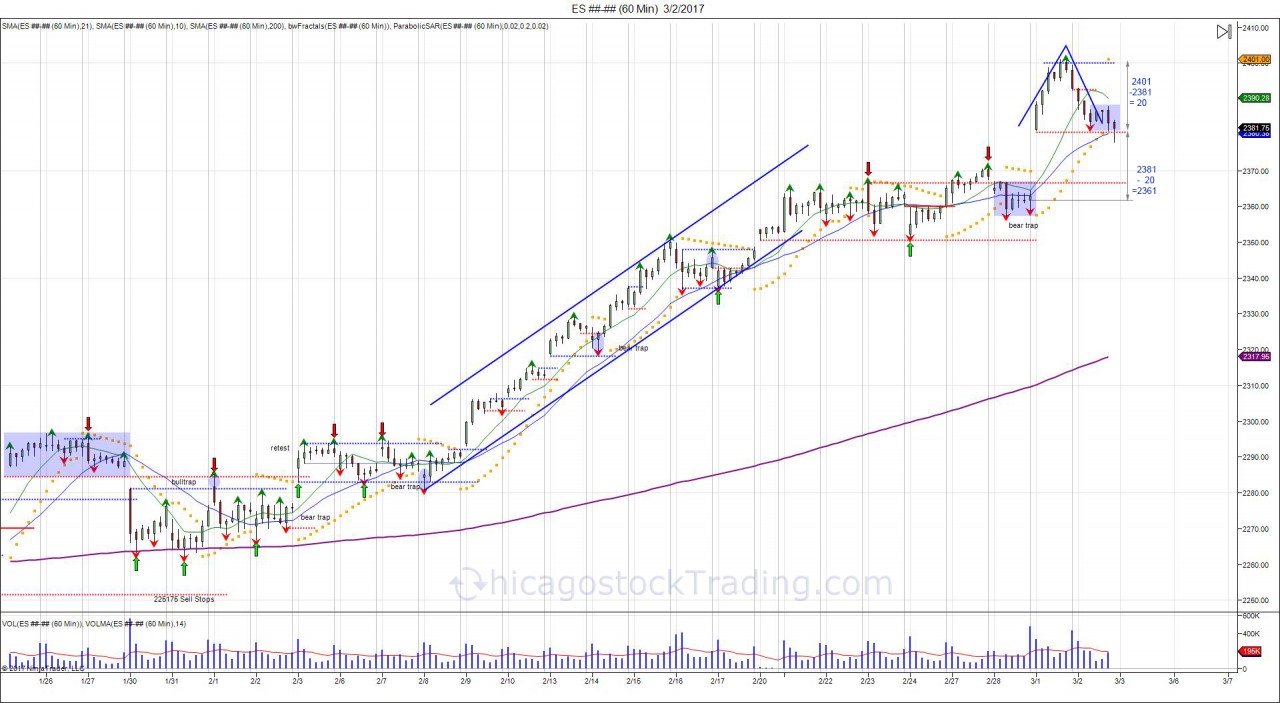
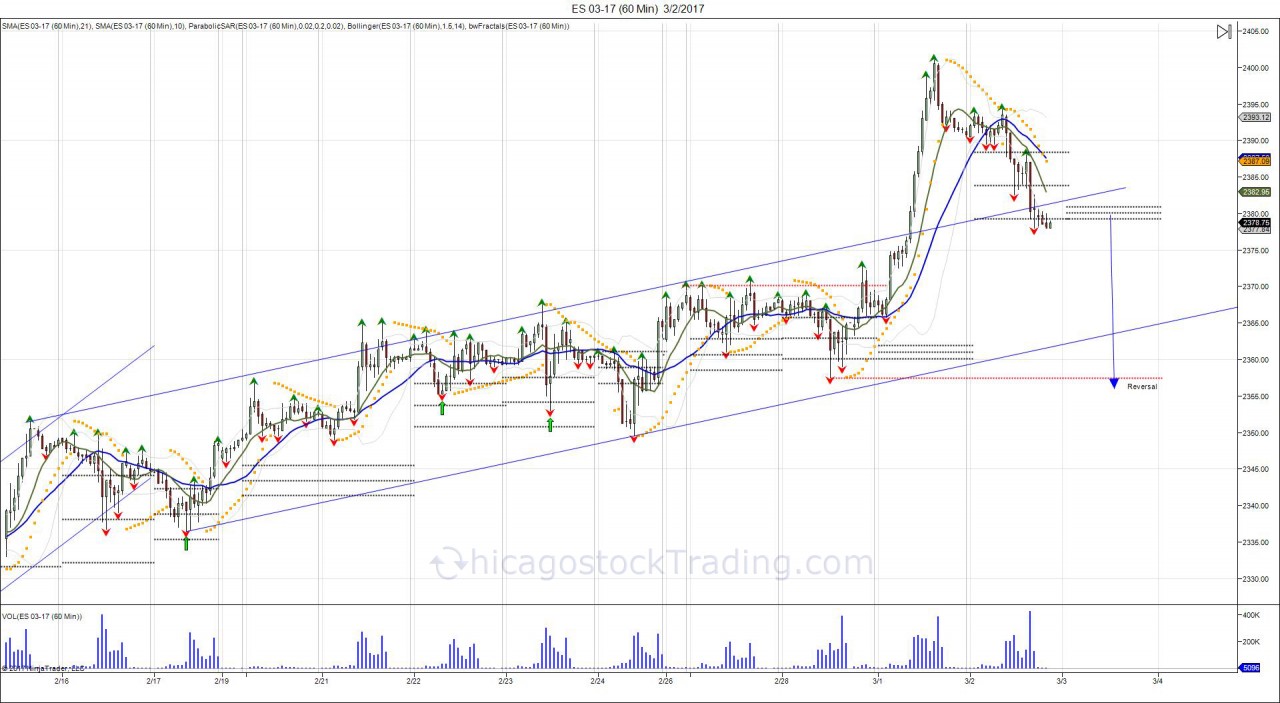
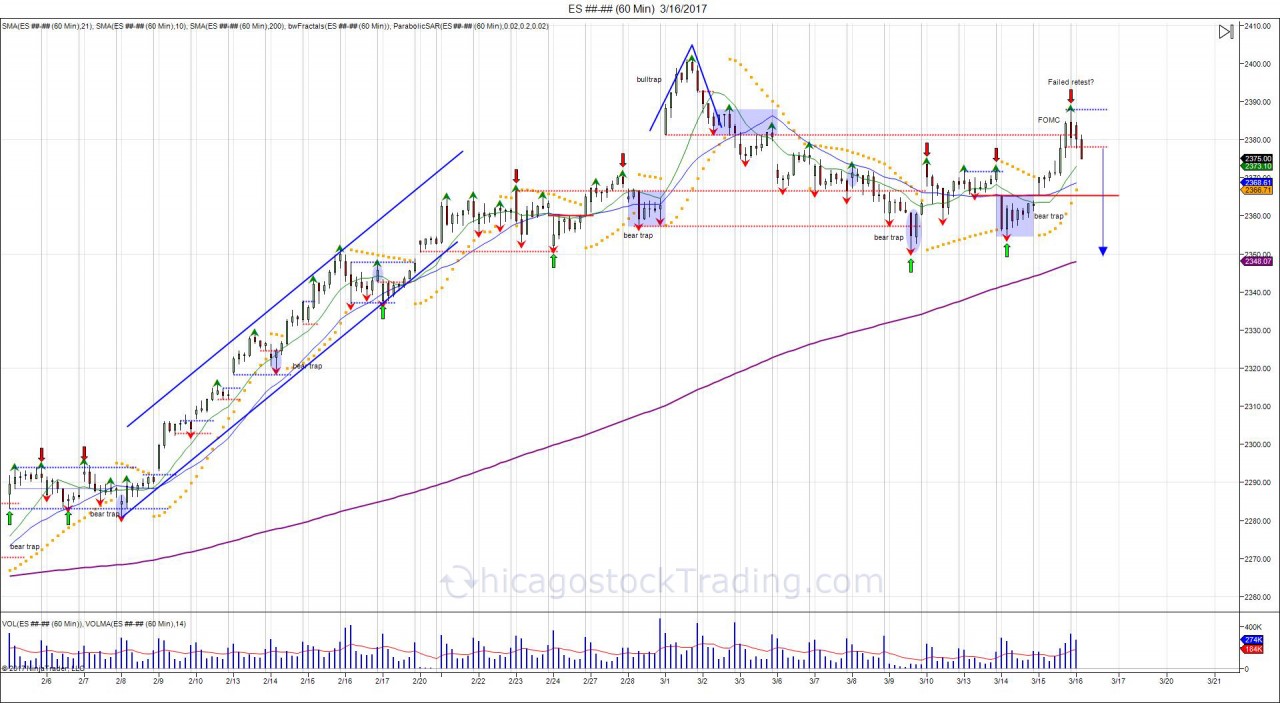
On March 1st, the SP500 gapped higher with an open at 238150. This forced shorts to cover and buyers to chase prices above 2380. The market rallied into a high of 2401, before it was retraced back the following day on Thursday. By retracing the move back, the market created an inverted cup/handle leaving buyers that chased the market above 2380 on the hook to see a shakeout down to 2361.
After opening below 2380 on March 3rd, buyers above 2380 were now on the hook. If there was enough demand, then the market would have rallied through 2380, however with the failure to recover 2380, this showed more supply then demand. It took 5 days of kicking and screaming from buyers, however the downside objective of 2361 was completed.

https://twitter.com/Chicagostock/status/837491631469244417
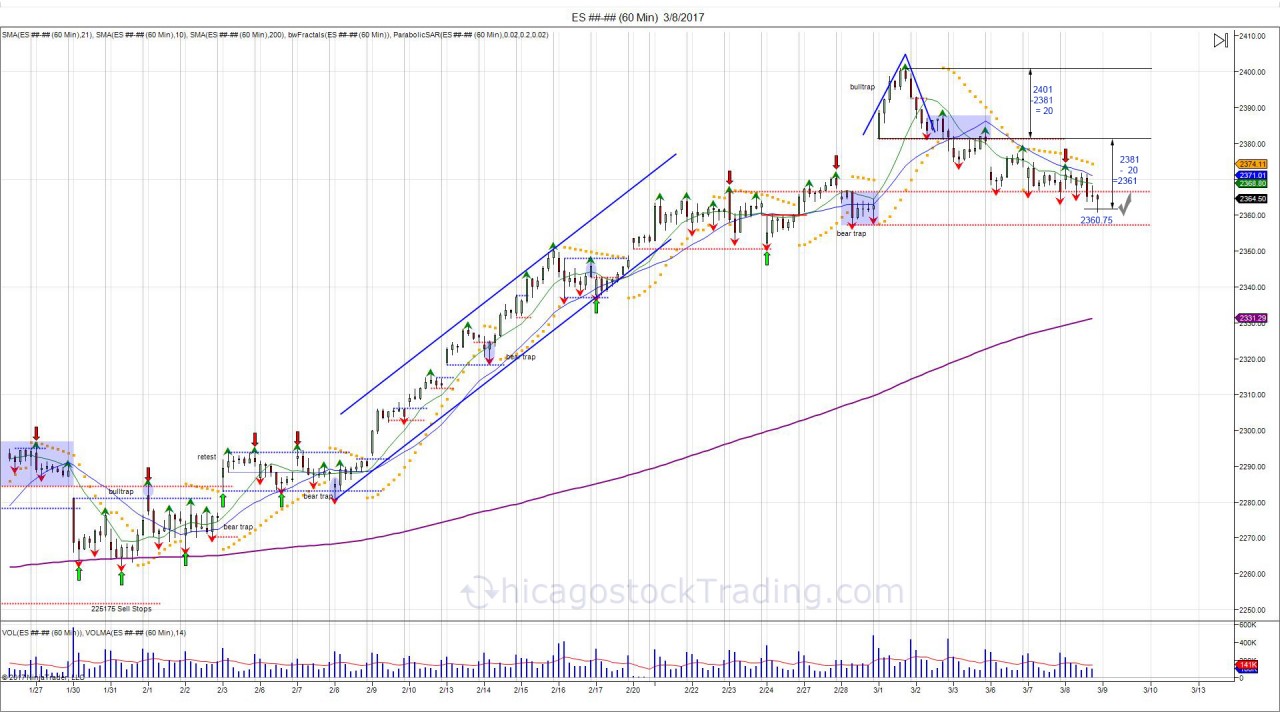
Another look of the squeeze seen on March 1st, that was given back with the close under 2380 on March 2nd, leaving buyers above trapped. Giving way to take out the prior low of 235750 to shake out longs.
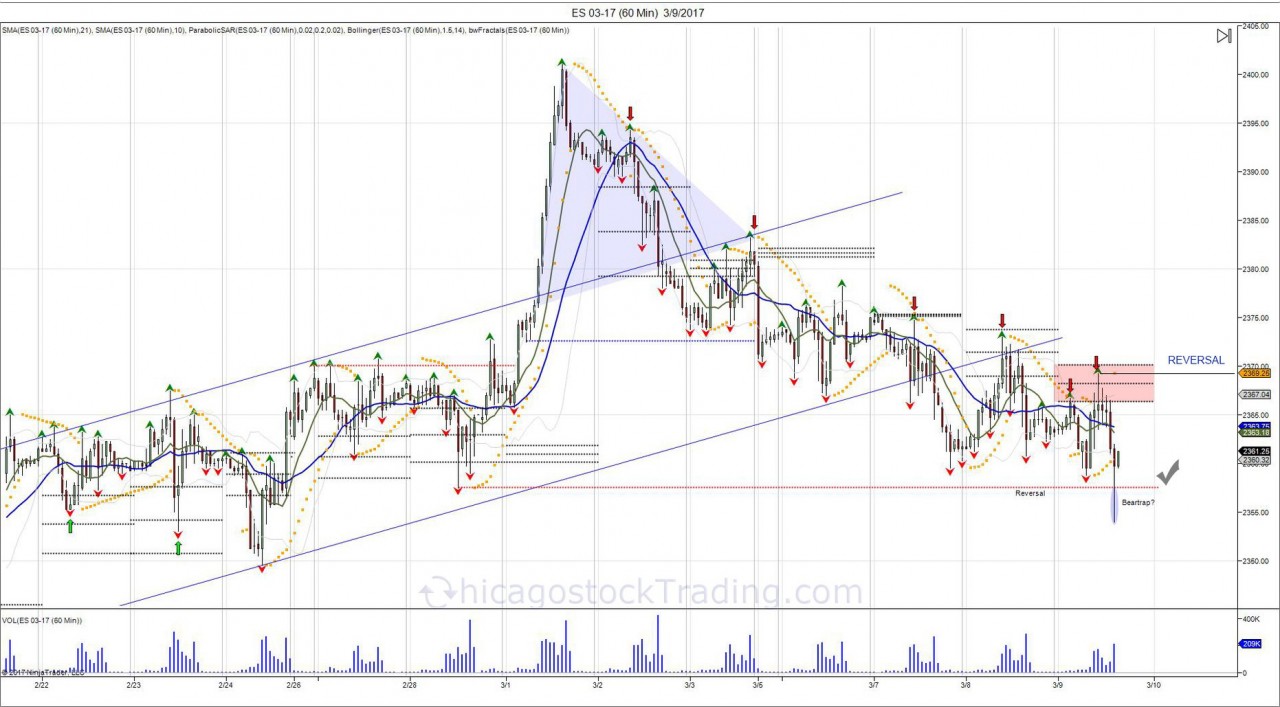
On March 9th, the market took out it's prior low of 235750. It took 2 days to squeeze from 235750 into 2401 and 6 days to retrace the move. Why? Buyers putting up a fight to prevent that prior low from being taken out. After taking out this low, the market quickly bounced back to setup a short term bear trap. This gave way to fuel a squeeze going into the FOMC announcement, which turned into a retest of the bull trap above 2380 from March 1st. The retest of 2380, was a get out of jail free card by Mrs. Yellen to allow trapped buyers an opportunity to get at break even. In other terms, this squeeze back to 2380 gave the market another opportunity to test the bull trap set on March 1st above 2380 to see if buyers can overcome the level, or if it was still oversupplied...
https://twitter.com/Chicagostock/status/842397462522429440
The FOMC squeeze printed a high of 238875 before turning lower. The retest of 2380 and failure to overcome, gave room to target the prior low of 235475 to shake out longs and fall into the 200day moving average.
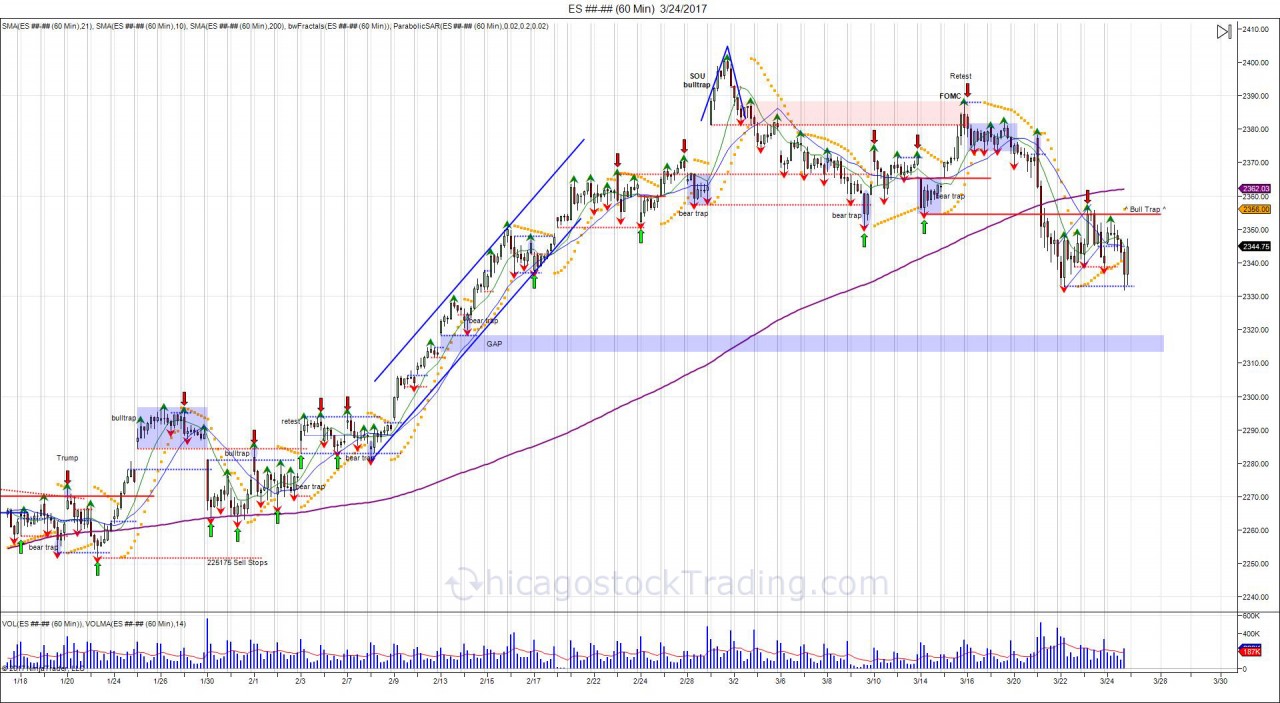
After two days of struggling on March 16-17, the market opened weaker the following Monday on March 20th. On March 21st, the market opened higher in attempt to give buyers a chance to take out 2380, however fell short with a high of 237875. The rug was then pulled from underneath to take out the prior low of 235475 and fall below the 200day moving average, for the first time since January 23rd which was the Monday after POTUS inauguration.
With the market falling below 235475, it has confirmed a failed retest of the March 1st high as a lower high was put in on FOMC. With this break of 235475 and the 200day moving average, longs that did not get out on the retest on FOMC and all of the longs in March above 2355 are now left on the hook and trapped. As seen in the chart above, the market retraced to retest the broken level on Thursday and Friday (March 23rd-March 24). With the market testing this old low which turned into new resistance as buyers were caught above, news was coming out that the new healthcare bill was not going to get the votes needed to pass. This news gave fuel to reject this resistance and fall back into a new low on the week at 233175 before catching a end of day short squeeze up to 2347. Going forward, a cash open above 2347 is needed to attempt a retest of the broken 200day moving average and attempt to squeeze shorts. Cash open below 2333 on the other hand leaves longs on the hook and forces sellers to chase prices lower, giving way to target next low from Valentines day at 231975.
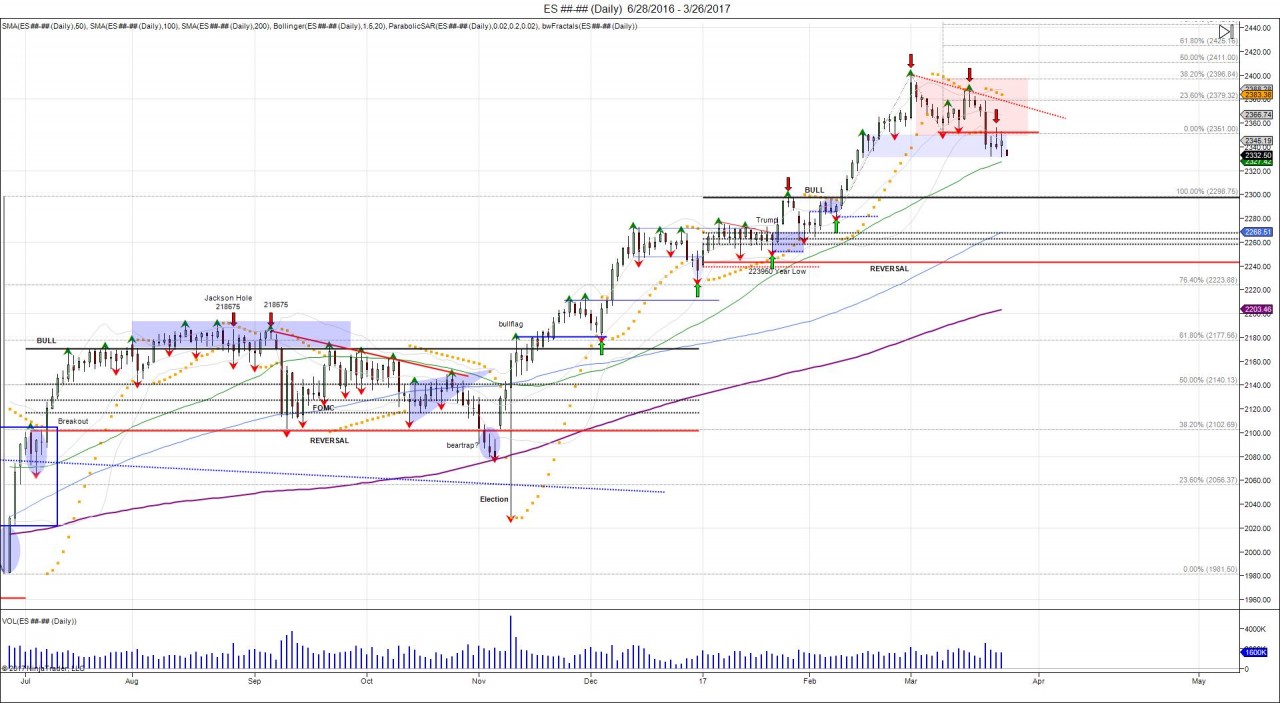
Looking at the daily chart, it is clear to see longs above 2355 on the hook. Rallies into this level provides new resistance for buyers to overcome and sellers to defend. Buyers will need to overcome 2355 in order to get another retest of the failed test of 2380 for any attempt at making a run at new highs. Failure to overcome 2355 keeps pressure against longs and gives way to retrace the breakout in February down to 2300. This provides first major support for longs to defend, down to the 6 month pivot of 2262. With the market breaking out above 2300 this year, most are programmed to buy the dips, and they will be buying the dips down to the 6 month reversal level of 2243 which coincides with the year low of 223950. Breach of this level is needed in order to confirm a failed breakout and setup a reversal of the bull bias to expand the market down to retest the election day breakout.
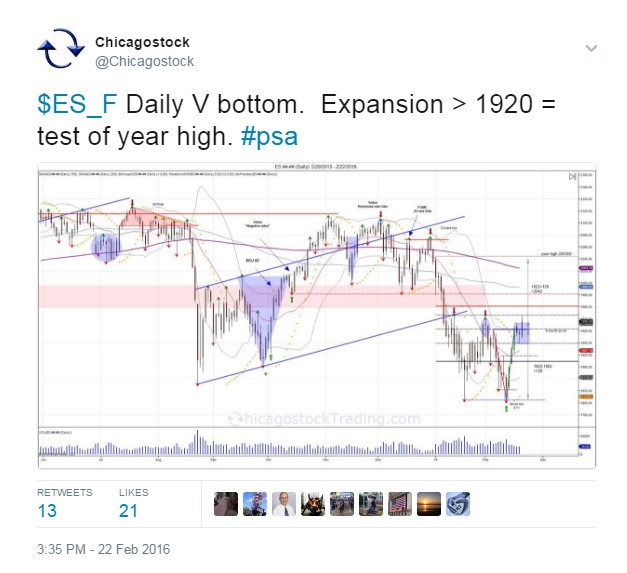
February 2016 projection of new highs on the year: http://www.chicagostocktrading.com/blog/sp500.html
As Always: Past performance is not indicative of future results!
No one has a crystal ball to know exactly where the market will go. As traders, we cannot see into the future, however we look at past performance to make future projections.
Subscribe to receive daily analysis: http://www.chicagostocktrading.com/membership.html