Trading is a game of price discovery. Like poker, you don't want to be on the wrong side when the bluff is called, or the music stops. The market is all about calling bluffs. Before doing that, it also has to set as many traps and catch people on the wrong side in order to gain enough fuel for the opposite direction. Traders caught wrong are the fuel that move the market by having to cover their shorts or sell their longs. The market trades price and reaction to those price levels create the boundaries for buyers and sellers to defend. Below are this week's 10minute intraday charts of the Emini SP500 futures.
Solid horizontal lines = Vol windows
Dash horizontal lines = intraday pivots
MONDAY:
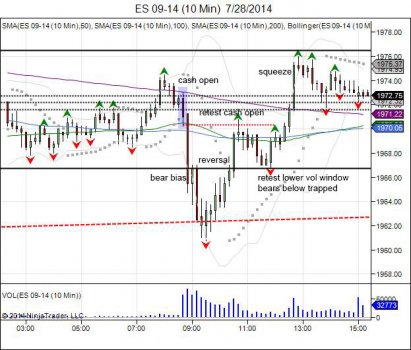
The market came back after the weekend, having seen Friday break an 11 week winning streak. The market started Monday's cash open where it left off from Friday however was met with immediate selling that broke below Friday's 1968 lows to shake out longs and lure in shorts as lower vol window breached to establish bearish bias. New lows down to 196075 made before turning around to recover above lower vol window and run into the cash open. As sellers defended the open, the market pulled in to retest the lower vol window only to see sellers unable to continue below, keeping shorts trapped and giving way for a squeeze into the close to reverse the intraday bear bias.
TUESDAY:
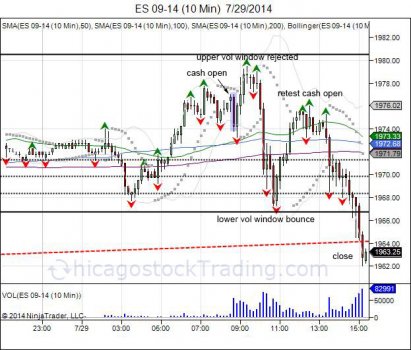
Monday's short squeeze reversal spilled into Tuesday with a cash open at 1977. The "turn around" Tuesday attempt was rejected as the market failed the test of the upper vol window that coincided with 1980 as the level the previous Friday opened below. This retest led to rejection below the intraday low and into the lower vol window to retest 1968 support from Monday. First test sees bounce back into the opening range only to fail to attract buyers, seeing push back to the lows. Second time around buyers were unable to hold, giving way for a close below the lower vol widnow to squeeze longs.
WEDNESDAY:
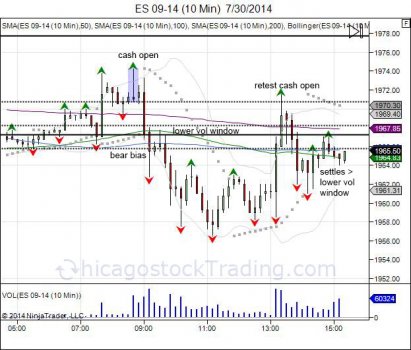
Wednesday saw the market open 10 handles from Tuesday's close right into Tuesday's cash open. This was rejected with highs of 1974 before turning lower to breach the lower vol widnow and establish a bearish intraday bias. New lows were made down to 195650 before rounding a bottom and seeing a short squeezed fueled by FOMC statement. The squeeze was again rejected at the cash open with close below the lower vol window.
THURSDAY:
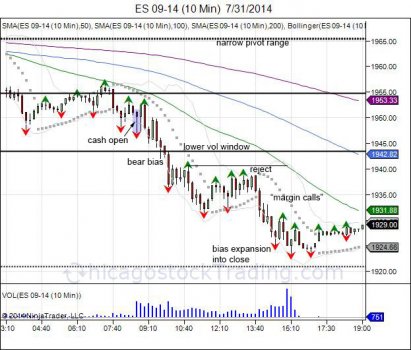
Wednesday's FOMC statement caught longs trapped as the market settled at 196550, only to open Thursday 14 lower at 1951. Longs were caught off guard and forced to liquidate, seeing the lower vol window breached to establish a bearish intraday bias. July lows of 194250, reversing the market from new highs into new lows going into the close of the month. The failure to recover 1940 led to margin selling and expansion of the lower vol window into the close.
FRIDAY:
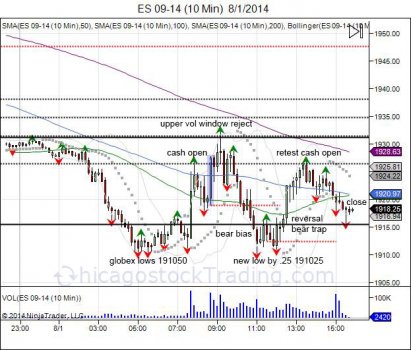
Friday saw Thursday's weak settlement spill into the overnight session with the market falling into 191050. The cash market opened above 1920 to see a squeeze through the Globex highs fail to hold as the upper vol window and pivots kept a lid on prices. The rejection was followed by a move below the cash open and breach of the lower vol window at 1915 to establish a bearish intraday bias. New shorts were lured in below this level to see the overnight lows of 191050 taken out by one tick at 191025 before exhausting. This failure to move lower led to sideways consolidation before turning back above 1915 to trap shorts and use as fuel for squeeze. The squeeze led to retesting the cash open only to see buyers unable to move past sellers defending the bounce and intraday bear bias. With buyers failing to pick up and continue squeeze, sellers too back control to drop back 10 into 1916 before settling at 1918. Going forward, longs are now vulnerable to a open below 1915 to target 1910 for another shakeout. Shorts are squeezed on a move through 1926.
Vol windows help in identifying the flow and feel of the market. Price discovery is made as market tests vol windows for reaction. Failure to hold vol windows establish the bullish/bearish bias in attempt to expand the range where the cash open turns into support/resistance.
Get vol windows and ES analysis with trade signals daily. Take advantage of current $100 discount by clicking here to sign up.
RISK DISCLOSURE: PAST PERFORMANCE IS NOT INDICATIVE OF FUTURE RESULTS. THE RISK OF LOSS IN TRADING FUTURES AND OPTIONS IS SUBSTANTIAL AND SUCH INVESTING IS NOT SUITABLE FOR ALL INVESTORS. AN INVESTOR COULD LOSE MORE THAN THE INITIAL INVESTMENT.