Chicagostock Trading

Chicagostock Trading

Euro and the 200day


6E________Daily___5_24_2012___5_28_2013.jpg

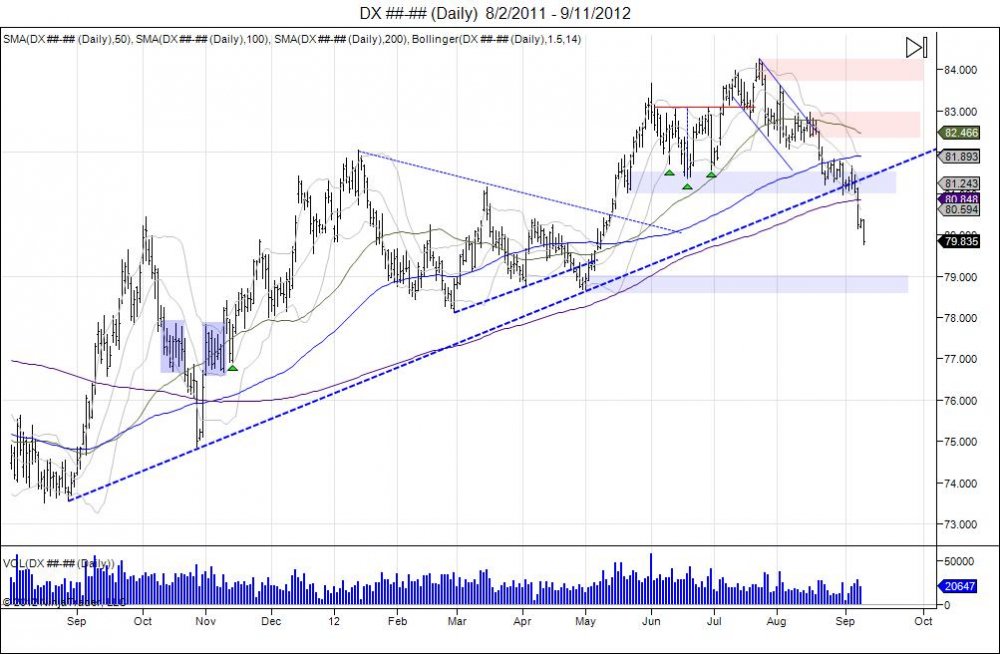
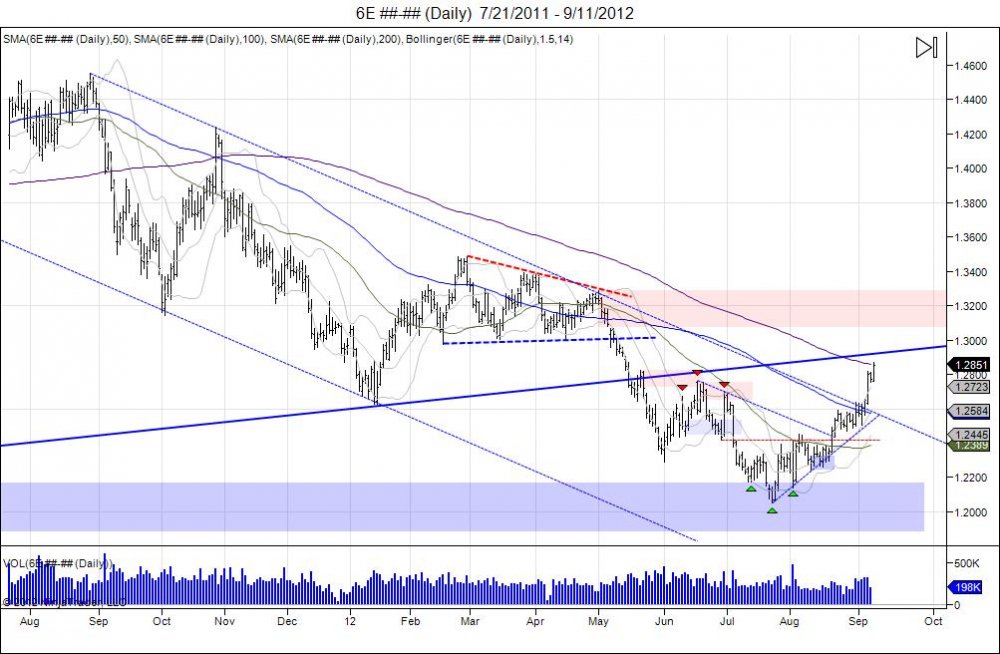
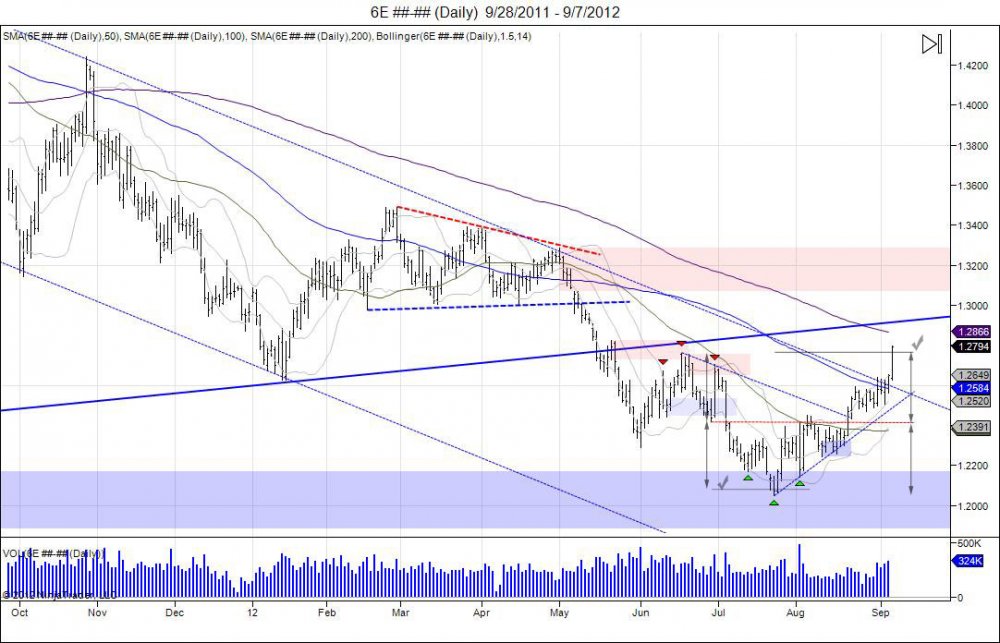
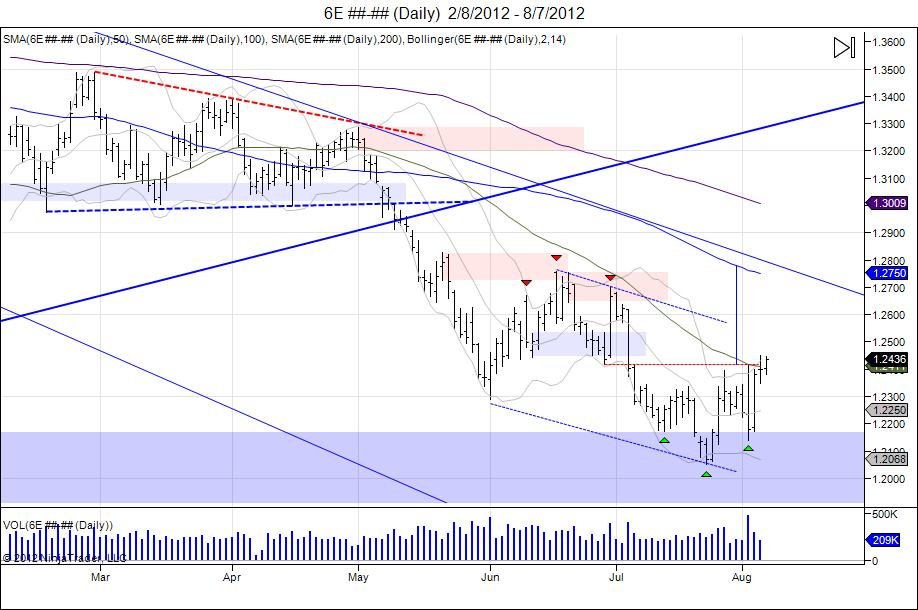
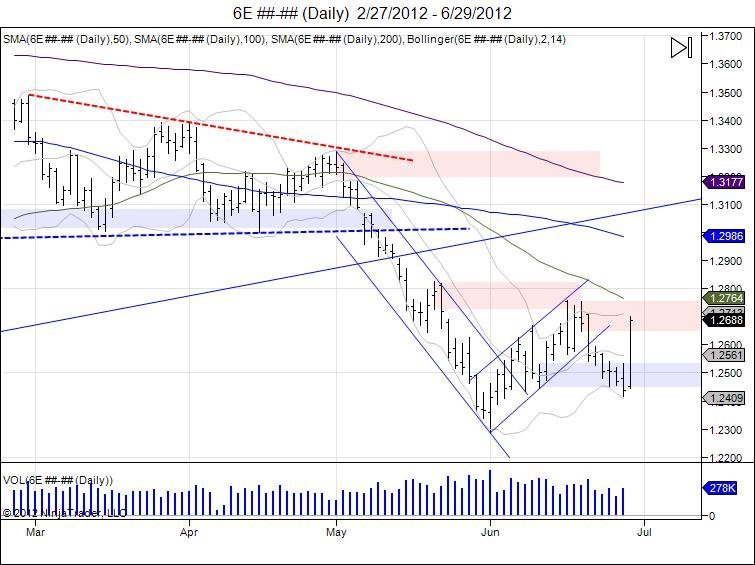
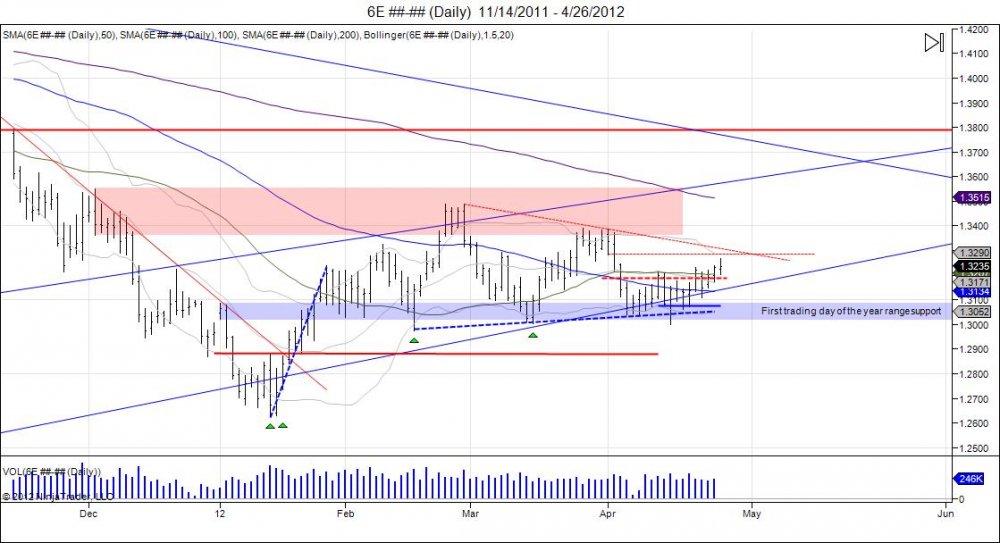
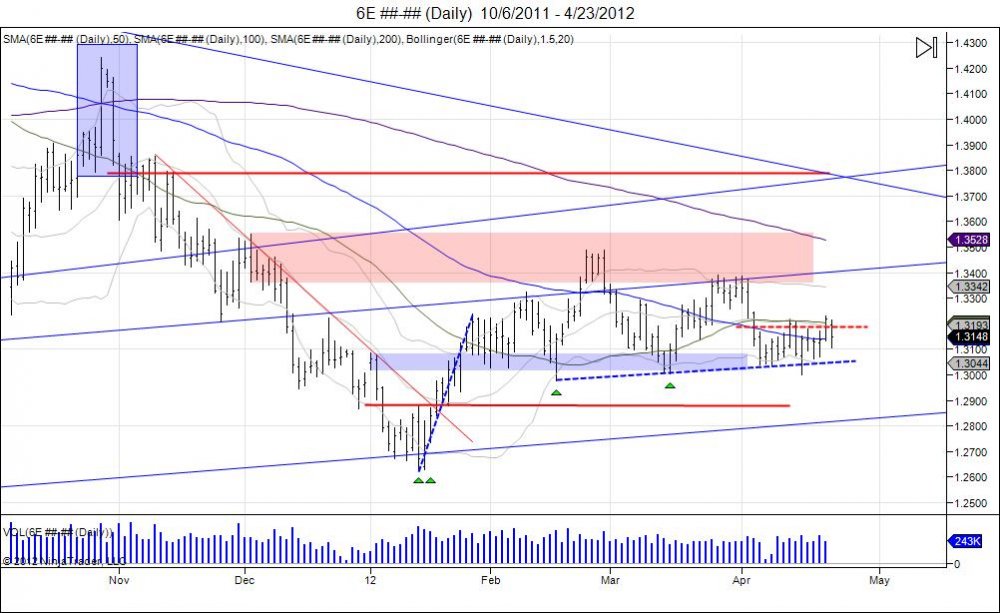
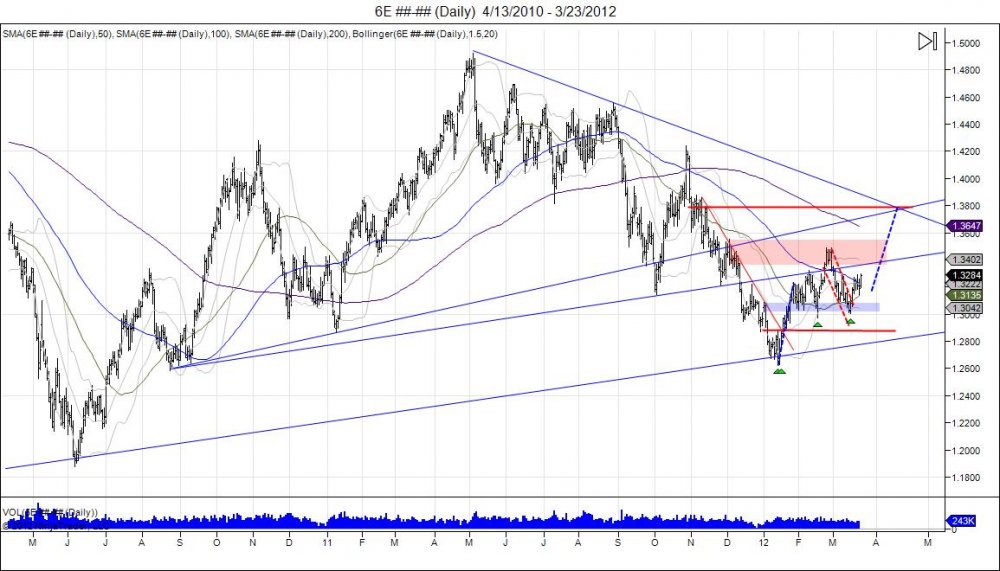
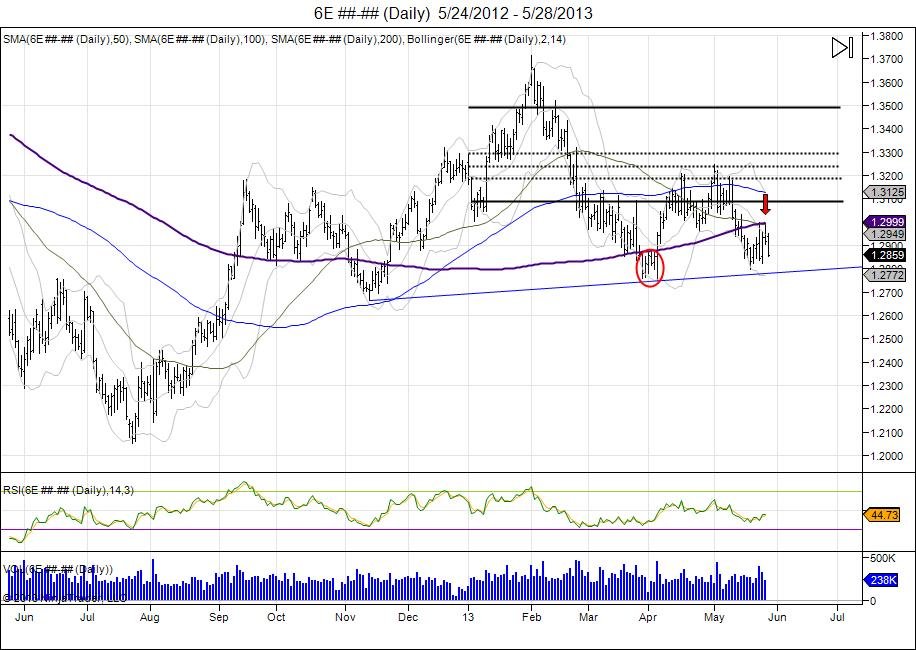
The Euro has closed below its 200day moving average 9 days now since breaking below in May.  This comes after an initial attempt to break the average in April was followed by a reversal off new year lows of 12751 that closed the market above the 200day.  This turned the break of this average premature and caught shorts below trapped as the market ran into 13200 to run stops from March.  Since then, the Euro topped on the 1st trading day of May at 13248, as the 200day moving average slowly caught up to make a tight range.  With the failure to hold the pivot low of 12959 from April 24th, the Euro broke its 200day moving average, and this time around the market is getting comfortable under this level by slowly turning the average which is strong support, into new resistance.  This was seen last week as the market spiked up to 130, touching the bottom of the 200day, however failing.  This consolidation pattern has created a bear flag as a tug of war is taking place by turning the 200day average into resistance, and working to gather strength to break the April lows.  With this, the 50 day moving average has also began to cross the 200day average, also known as a "death cross".  Breach of April lows confirms the bear in the Euro which should continue to find its 200day average weigh down to attempt a retrace into 124 which is where the market broke out last year.  12906-13000 offers new area of resistance for this momentum, followed by 13075-13200.


6E________Weekly___Week_33_2011___Week_22_2013.jpg

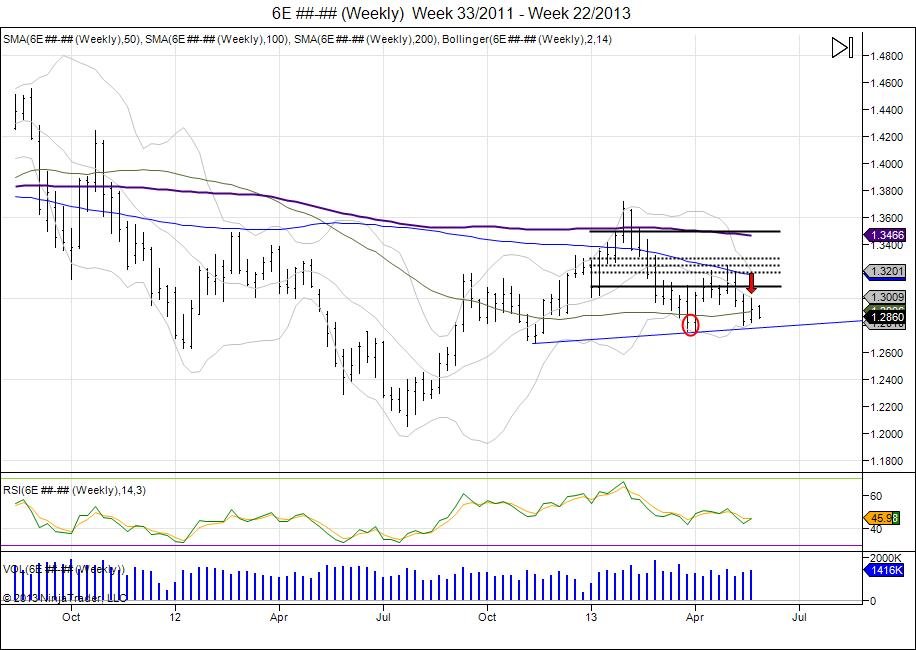
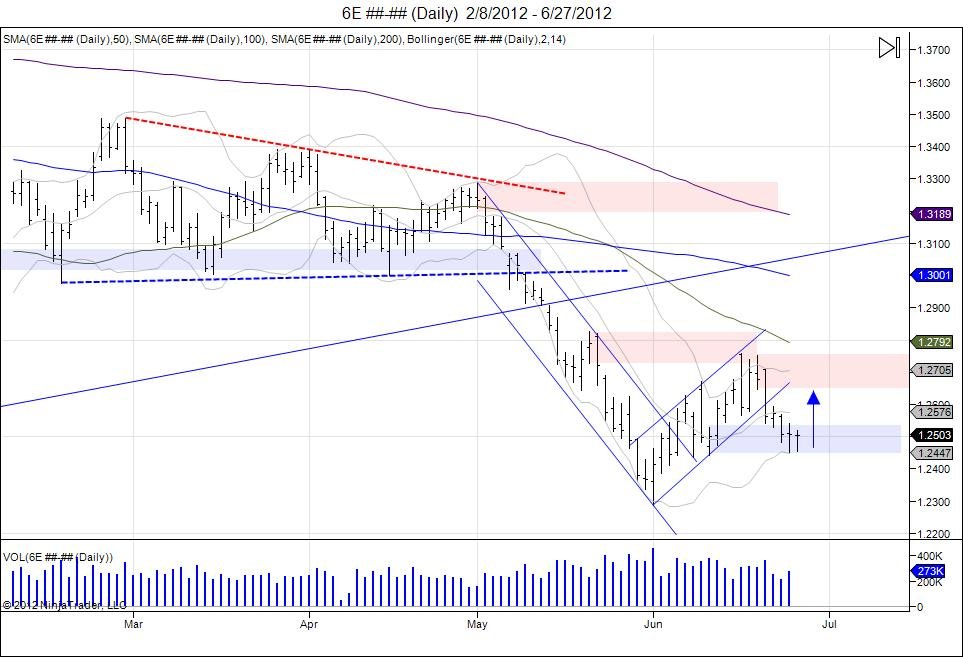
The weekly Euro chart shows a different picture. With last week's attempt at the 200day on the daily chart with highs of 130, shows the market held below its prior weekly high and closed below the prior weekly open, to establish an "inside" week.  This has led to continued weakness as this week has began, in attempt for sellers to target last week's low of 12822.  Closing below this low on the weekly confirms downside to target the rising trend line for stops and eventually the November lows at 12665.

Continue reading
3567 Hits

SP500 Maxes 100% Fib and Reverses

ES________480_Min___5_23_2013.jpg

As soon as the SP500 hit its 100% Fib extension level of 1685.50, sell programs kicked in as the SP500 printed highs of 1685.75.  The move occurred after a squeeze through previous highs of 1673, seeing shorts capitulate which gave way to the 1685 print.  Smart longs sold into this bid to take profits. With longs taking profits, shorts already being stopped, the market fell down to retest its open. After trying to retest the highs and failing to find buyers at 1681, the market fell off to take out its session lows to reverse the intraday trend as more longs locked in profits and short sellers sat on the sidelines looking at the market drift lower.  With shorts out the market, this created a chase to the downside into 164650 to retest the pivot low of 1646 made last Thursday prior to Friday's move into 1665.75. A 40 point rejection off the top level of 1685 and a press to test the downside resistance range at 1656 to see if that old resistance acts as new support for a retest of the mid level at 1666-1670.  This has raised the stakes for bears as the range to defend has widened.  Failure to hold 1646 sees more shorts left on the sidelines and a wider range (40) to defend the high.  Market remains in its 5th wave that began on the breach of the old 1593 highs with a pivot low of 1530.75 occurring during the "4th" corrective wave.  As market moved past 1593, buy side chased and shorts squeezed from the 1593-1530 giving way into 1656.  Sell stops have built along this wave 1530-1685 below 1646, 1620, 1607, 1570.75, and ultimately the 1529.50 low from Cyprus.  Wave 5 ends on a breach of that pivot low that began the wave at 1530.75.  With that taking place, a confirmation will then be made that the move above 1593 was a failure and an "abc" corrective pattern can be seen should the market be able to bounce after breaking 1530 to retest the 1600 level and see if it can get back above. 

ES________Daily___12_21_2012___5_23_2013.jpg

See: "SP500 Wave 5 How High Will It Go"


Continue reading
3647 Hits

SP500, Bonds, Yen, Euro Chart Updates

 SP500

ES________60_Min___3_27_2013b.jpg

Since the gap down two Sunday's ago on the Cyprus news and bouncing off the old highs from February at 1530, the market has gone into a major tug of war whipping short sellers who have tried to come in following the news.  The "plunge protection team" has managed to keep the momentum alive with higher lows.  Just 1 week after that gap down, the squeeze managed to print new highs on the year at 1560.50. Following this new high,  another pullback was seen to retest the prior low of 1535 only to see another higher low develop at 1539.  On Tuesday this led to a recovery that retested and pressed against resistance based off the Sunday high.  This has led to the market climbing back Tuesday night and retesting the 1560.50 level with the market tapping it again, however failing to breach.  Thus far this has led into another pullback, retesting the previous lows of 1539 with lows of 1545.75.  Higher low again as the range tightens and the market builds buy stops above the highs going into the holiday weekend. Sell stops also building below this trend of higher lows and they will be targeted eventually, question will be if momentum can stay alive into the holiday weekend as the range is now 154575-156050.  Resistance met against 1558 with stops above 1560.50.  Support  1548-1539. Bonds as shown below have continued to hold their bid following the Cyprus gap above 14200 and this has led to tap the March highs of 14429.  The squeeze eventually completes on a move past the February high of 14611 to confirm the break below 14200 as a failure.

Continue reading
3458 Hits

Reversals of the Year

 dx3_1.jpg

Continue reading
3439 Hits

Major USD Reversal No One is Talking About


US DOLLAR:

DX2_25.jpg

The US dollar is one of the most important, yet least discussed chart of the year.  Noticing the dollar's break below 79600 late January, early February, only to establish a bearish bias and lure in shorts before turning around higher. The market has held above its reversal window, thus reversing the bearish bias which has led the market to take out its year highs of 8100 set early January.  This U turn is having a major effect and pressure on commodity markets as the USD failed to break lower and is trading on new highs for the year. Take note of the gold chart how it is completely opposite of the dollar chart and is an upside down "U" from the beginning of the year.


ES________Daily___3_14_2012___2_25_2013.jpg


Click charts to maximize

Continue reading
2709 Hits

Nasdaq + Euro

 NQ________Daily___3_16_2012___10_5_2012.jpg

Last month, the Nasdaq future made a higher high of 2871.75, just before reversing to take out the 2775.25 lows made just before that high. The market made lows of 2762.25 on September 26th. Not ready to break the September lows, the market grinded higher off this late September low into retesting where the market failed from the highs. This retest was touched today on the NFP number with highs of 2840.75. This put the market right into the hands of sellers to defend the failed September high, and looking for a right shoulder to build on this failure.  Thus far the market is trading on its lows and giving these sellers oppurtunity to take a portion off as this is being reversed the same day.  Going forward, buyers must work through this 2840-2872 resistance to squeeze out this head/shoulder pattern attempt and stop sellers.  Sellers must look for a move down to the neckline now of 2762.25 to confirm this pattern and allow for another level to take a layer of shorts off.  Continuation of the pattern is seen should the market continue to see sellers below the neckline which gives a downside target of 2652.75, retracing the market to where it broke out early August. 


Continue reading
11992 Hits

SP500, US Dollar, Euro

 ES________Daily___2_23_2012___9_11_2012.jpg


DX________Daily___8_2_2011___9_11_2012.jpg


6E________Daily___7_21_2011___9_11_2012.jpg

Continue reading
1045 Hits

Euro Completes Target Whats Next?

 6E________Daily___9_28_2011___9_7_2012.jpg

The Euro today rallied into highs of 12808, taking out the June high of 12759 and completing the inverted head/shoulder target of 12775 from the 12413 neckline made on the "draghi sale" when the market fell to retest the July lows. The buys at 12147 saw most covered before the break of the neckline.  As the market took out the neckline of 12413 runners were left to see if the Euro can complete its 12775 target. With this complete, this trade is now done. Going forward, new support comes within 12626-12503.  Next major upside resistance is met against 13082 to fill the gap from the May highs of 13287 of where the Euro failed.  

Reference: Euro's Inverted Head/Shoulder

Continue reading
2442 Hits

Euro's Inverted Head/Shoulder

 6E________Daily___2_8_2012___8_7_2012.jpg

Following last Thursday's "Draghi Sale" as the Euro fell down into lows of 12140 which retested the July lows, the market has sprung back as buyers stepped up to defend this low and sellers failed to break the range. A right shoulder developed with this move and the market is back to testing its neckline of 12417.  The move in itself has given brave buyers of the Draghi sale oppurtunity to have locked in most profits and now allow runners to work as the market attempts to chip away at this neckline.  Shorts in the market are now trapped as the market failed to move lower and the squeeze against the neckline puts pressure against these shorts to cover.  Moving past this resistance gives room to continue the squeeze and use shorts as the fuel to move past the 12051-12417 range. The inverted head/shoulder targets the June highs of 12759, putting the market against its 100 day moving average as well as the top of its daily channel.  Failure to attract buyers above 12417 and a move below 12140 is needed for bears to regain control.


6E_09_12__60_Min___8_6_2012.jpg


euro.jpg


Continue reading
4568 Hits

Euro Squeeze?

 06/29/12 Update:6E________Daily___2_27_2012___6_29_2012.jpg

Following Euro's fish for a bottom this week, the market finally breached its continuous June 12 low of 12443 down to 12417 and the market has climbed back to turn 12443 into today's lows as the market has run through Thursday's failed 12535 highs, squeezing shorts and hitting resistance from June 20th within 12646-12753.


______________________________________________________

6E________Daily___2_8_2012___6_27_2012.jpg

Since the Euro reversed off its 12288 lows from June 1st, the market ran up to resistance which was met from the May 21st levels at 12726.  The market failed to breach this level as sellers defended the range and went through a shakedown which led the market down to break its rising channel and fall into testing support from the June 12 lows.  This was the day the market pivoted into 12726.  The September contract lows from this date are 12455 and this week we saw the market clip this level and fall into 12451 before quickly recovering. On Wednesday this low was retested with a 12455 low that failed to break the week low of 12451.  Just as the Emini SP500 put in lows of 1302.50 on Monday and failed to take them out on Tuesday with a 1303.25 low which has been followed by a short squeeze higher into 1328, the Euro should also put pressure against shorts to cover as the market did not give oppurtunity to break the weekly low. On the continuous chart, the June 12 low comes in at 12443.  A close above 12542 is needed to squeeze out shorts and target the next major resistance being 12646 from where the market failed at 12753 on June 20th.  This is a major level of resistance as a test of this can build a right shoulder if sellers can hold the range, or see the market squeeze through to continue higher.  On the downside the 12443 lows are the neckline for this 2 week consoliation. A breach of this gives room to retest the month lows down to 12288.


Tags:
Continue reading
2888 Hits

Euro Market Update

 6E_09_12__Daily___2_3_2012___6_18_2012.jpg

Since reversing off 12298 lows on June 1st, the Euro rallied to break its downward channel created from May 1st. This led the market into a short squeeze and a newly formed channel (bearflag) with the Euro running into its resistance range from May 21st within 12726-12826.  The move has given oppurtunity of buyers early this month to take profits against this major resistance level, as well as sellers a bounce into this resistance to defend.  Today we are seeing exactly that, sellers coming into defend this resistance range and pushing the market lower after a strong overnight gap higher.  Going forward, support is seen down to 12540-12455 as the range buyers must look to defend to keep this upward squeeze in place.  Failure to hold this range sees a retest of the 12298 lows followed by next major support coming in at 12164 off the 11874 lows put in June 2010. Moving through 12726-12826 is needed to turn this downard momentum in the Euro and squeeze out the new sellers who are defending this level with next major resistance coming in at 13000 from the broken April 16th lows.


Tags:
Continue reading
2349 Hits

Euro's Failed Break and USD Head/Shoulder

6E________Daily___11_14_2011___4_26_2012.jpg

 click to maximize

Ever since the Euro broke out of its downtrend from November in January after reversing off lows of 12627 and trading through the first trading day of the year range of 13020-13085, this range has turned into support.  This is the market showing us that the breakdown in January has a head fake and the market is attempting to reverse its momentum as it climbed back above that first trading day of the year range.  Since then, the Euro squeezed into testing resistance from December however was unable to continue the push which was followed by a retest of the 13020-13085 support.  This led to another bounce that failed at the now new resistance from February levels, which was followed by another breakdown to retest its support level.  This failure at the February levels turned into a right shoulder as the market came down to test its neckline as many shorts were looking for a break to confirm a head/shoulders formation.  During the month of April the Euro pressed against this neckline and even clipped it to put in lows of 13000 however held its 12975 lows from February and reversed back higher.  This led to a major consolidation and struggle to hold this neckline as the Euro has fought with its back against the wall trying to chip away at sellers and get the market out of this downward pressure.  This is needed for the market to try and squeeze higher to have shorts in as fuel for an upside rally.  Currently the Euro has worked through its 13200 resistance and is testing its next major resistance from the failed March highs which also meets with a downward resistance from the Feb-Mar highs connected.  Buyers who defended the 13020-13085 support level have opportunity again to lock in profits and leave runners to let the market work itself out to try and squeeze through this resistance.  A move past the March highs squeezes out the shorts who were looking for the head/shoulder breakdown and targets the February highs.  Moving past this February high squeezes out the remaining shorts giving fuel for the next leg up to try and retrace into 138 from where the market broke down from in October.  This 138 is the ultimate resistance in Euro off the 14241 highs and sellers should be looking at this level to defend.  As stated before the Euro is in short covering mode ever since it climbed above the Jan 3rd levels and support is seen down to 12890.  A break below 13000 would shake out weak bulls however taking out the year lows of 12627 is needed to put the ball back in the bears hands. 

 read more...


Continue reading
4400 Hits

138 Euro, 75 USD

6E________Daily___10_6_2011___4_23_2012.jpg

click to maximize

For the past 2 and half weeks, the Euro has consolidated and fought to hold its daily neckline stemming from the February - March lows.  This was breached on the 16th of March as the Euro hit lows of 13000, however quickly recovered and closed back above the trend line.  This shake out has seen the market continue to hold above its neckline, however meeting major resistance at the 13200 level.  Last Friday we saw the Euro close on highs hitting 13232, only to turn back lower on Monday and retest its breakout point.  This is at a critical level for the Euro as if this market is indeed ready to move higher, these Monday lows of 13107 should be supported for buyers to take out the  Monday highs of 13214 to show their strength of pushing back above 13200.  In turn the next major resistance comes within 13280-13387 from where the market broke down on April 2nd, as the range for buyers to squeeze through to target the February highs of 13488 and ultimately complete the retracement to 13800.  

more...


Continue reading
5543 Hits

Euro - USD Analysis

 6E________Daily___3_29_2011___4_11_2012.jpg

click chart to maximize

Since failing the test of the February levels late March, the Euro has fallen to retest its double bottom of 12975-13004.  This neckline is being threatened and the Euro is fighting very hard to hold with its back against this fence.  Upside resistance is met within 13195-13391 as the level to move through in order to break out of this downside pressure and move to take out the February highs to complete its upside target of 138.  Failure to do so and the neckline is in jeopordy of being broken for stops and to attract shorts where the January level will be retested with 12890 as support off that low of 12627, where a false breakdown can be seen to trap these sellers.  Ultimately the January lows need to be broken for the Euro to be back in bear mode, until then the market is in short covering mode and should continue to look into retracing to 138 where it broke down from 142.

DX________Daily___4_1_2011___4_10_2012.jpg

 click chart to maximize

The US dollar most recently has been testing its failed highs from March after the pullback found support at the February lows.  This test builds a right shoulder on a failure to take out this high, giving room to break the neckline of 7812-7880.  With that the 7800 level will have a better chance of being taken out as the market has tested and failed upside levels.  Downside target comes in to take out the October lows.  Currently fighting minor support at 79700.  Buyers need to squeeze March highs to fail this head/shoulder attempt and target the year highs in order to regain control.

Continue reading
3983 Hits

Strong Euro Weak USD

 6E________Daily___4_13_2010___3_23_2012.jpg

click chart to maximize

more...

Tags:
Continue reading
3510 Hits

Euro's Double Bottoms

 6E________Daily___10_20_2011___2_7_2012.jpg

Since the Euro's double bottom in January, with lows of 12627 on the 13th and 12628 on the 17th, the market trapped shorts who were looking for the breakdown and used as fuel to squeeze above 12884 being the highs from January 13.  This squeeze led to reversing the downside momentum and short covering as the market rallied through the year highs of 13085 and up to its next major resistance being 13237 from December 13 where this down leg started.  After hitting this resistance of 13237 and 6 handle move off the lows, the Euro went into consolidation period, building a flag for the move from 126-132.  This flag built right above the year highs of 13020-13085, being the new level of support as the year highs was conquered.  

 more...

Continue reading
2877 Hits

The 'Bull Flagging' Euro

 6E________Daily___6_28_2011___1_31_2012.jpg

Since the Euro reversed its downward trend mid January by climbing above 12900 and through the downward trendline, the market has gone into a short squeeze which led the market to take out the year highs at 13085 and bump against resistance from December 13th at 13237.

 more...

Tags:
Continue reading
3569 Hits

The 2011 Euro trade that made $43k in 3 months.

On October 27th 2011, Chicagostock Trading recommended selling the Euro at 1.4180:

eurotrade10-27.jpg

more...

Continue reading
6237 Hits

Chart 1/8/2012

1-8-12b_1.jpg

Tags:
Continue reading
2782 Hits