Chicagostock Trading

Chicagostock Trading

2018: The Year of the Bull Traps


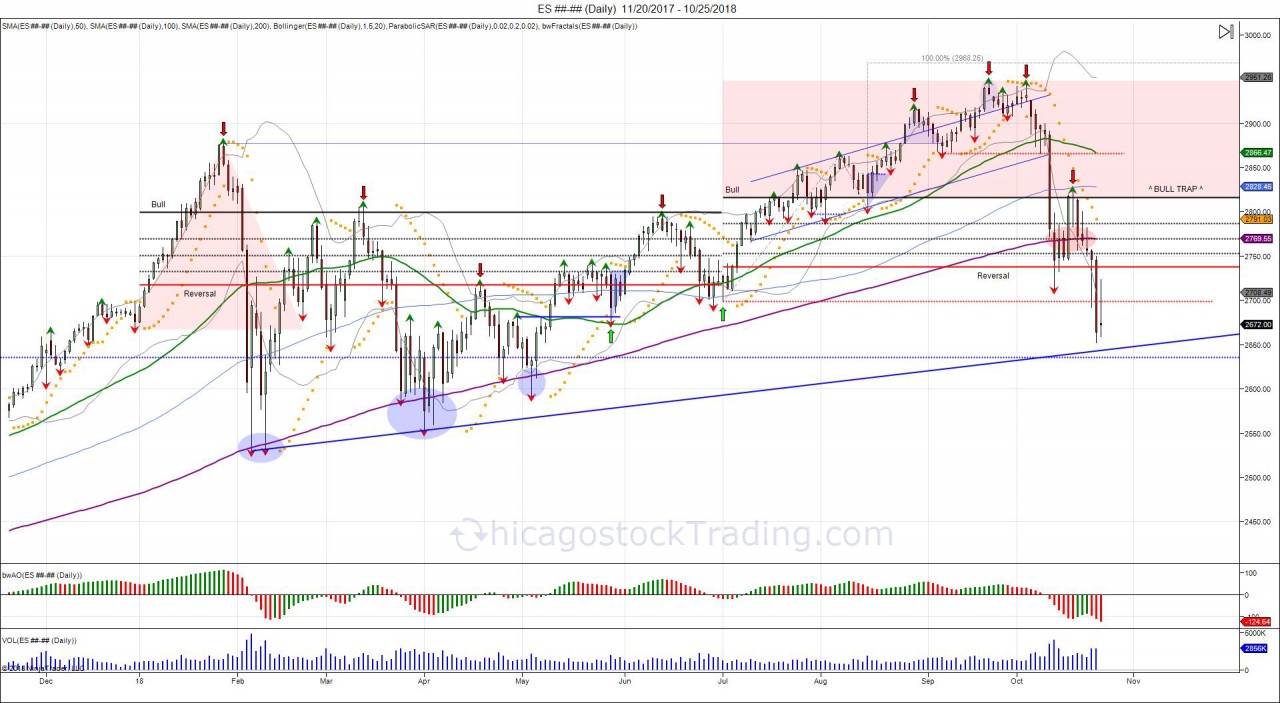
The year of 2018 has been a year that has lured in buyers, only to trap these buyers as sellers took profits into the rallies.  In the beginning of the year, we saw the market stampede from 2700, through 2800 into a high of 2878.  The move over 2800 (the 6 month volatility window), lured in buyers as it established a bullish 6 month bias, that were forced to defend pullbacks.  These buyers turned into "bag holders" a term used for late buyers, as the market fell below 2800 to trap the longs.  Liquidation below the year low came fast.  Reversing the 6 month bull bias, and turning 2800 into resistance as buyers were trapped above, creating overhead supply.  For the rest of the 1st half of 2018, the market was walked higher, from 2529 up to retesting 2800 before going into the 2nd half of 2018.  In the 2nd half, July, new volatility windows were set.  Once again, the market broke through its upper vol window (2816), establishing a bullish 6 month bias and once again luring buyers.  This time around, buyers were able to convert 2800 into support, allowing a move to overcome the January 2878 high.  The breakout over this high lured in new buyers and stopped out shorts, pushing the market up to a high of 2947.  After failing to overcome this high in October, falling short at 2944.75, the bottom fell out, seeing the prior month low of 2865 (September) taken out.  Thus has once again led to a waterfall effect that forced buyers to defend the 6 month reversal window of 2737, based off the July low of 2698.  First test of this level saw buyers with their backs against the wall, forced to defend the level to prevent another reversal bias.  Bulls managed to squeeze the market back to retesting the 6 month vol window at 2816, however failed to overcome the level.  This once again has left buyers above the 6 month volatility window on the hook, showing more supply is trapped above, then demand.  The return to the reversal window at 2737 has saw buyers fail to hold, after using most of their ammo on the first test.  Buyers are out of ammunition.  How many more times can they double down?  This has led to the July low of 2698 to be taken out and as of now, the market has closed below its 6 month reversal window of 2737 for 2 days.  5 daily closes below reverses the 6 month bull bias, giving way to expand the market lower once again.  The correction in the market began in February.  However the market spent the next 7 months grinding out shorts and luring in new buyers.  With shorts being stopped out as new all time highs were made, new buyers are again on the hook with the failed hold of the September low at 2865.  


Buy the rumor, sell the news? 


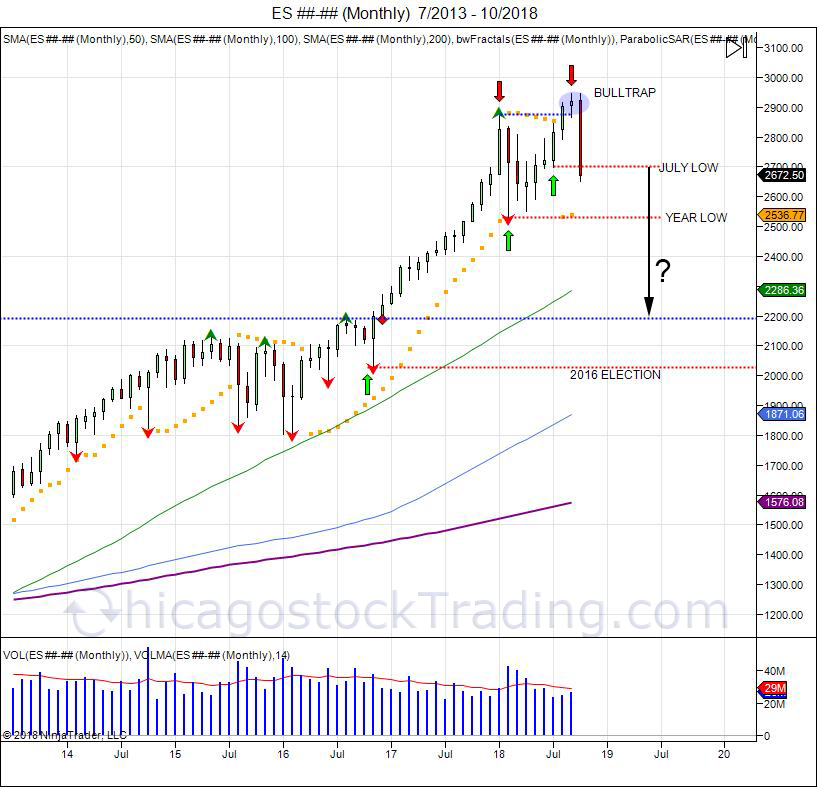
As seen in the monthly chart above, the "Trump rally" started in November of 2016.  Seeing the market breakout from 2170 into a high of 2878 in January of 2018.  For those that follow our work, we pointed out how the Trump V bottom on election day projected 2300.  Obviously the market went much higher, however the buyers that came in to start January of 2018 were the late buyers that panicked in.  They were corrected down to a low of 2529 in February.  From this low, the market spent 7 months grinding out shorts as the market was walked up to take out the January high, luring in new buyers, only to fail in holding above and turning right back down to take out the July low.  This has created a "failed breakout" as new longs above 2800 are now on the hook.  Rallies up to the September low of 2865 provides new resistance for sellers to defend and buyers to overcome to recover the trap above.  Next major stops in the market are seen below the year low of 2529.  Below this low, opens the door to retrace the "Trump rally" from 2200 back down to that level.  Big move? Yes.  Impossible? No.  No guarantee this will take place, however doing so would retest where the market broke out and provide buyers an opportunity to defend the breakout.  In the long run, this would be considered a "healthy" correction.  Unless you think the market going up every month is healthy.  


If you want to see how the October 2018 correction started, check out this link: https://t.co/z3RZmSa8mq

2018 January Correction: http://www.chicagostocktrading.com/blog/sp500-january-2018-mirrors-january-2016-1.html

2016 Election V Bottom: https://twitter.com/Chicagostock/status/801150246906687489

2016 February V Bottom: https://twitter.com/Chicagostock/status/701882994844311553


Continue reading
47839 Hits

What Tuesday's Reversal Means

 05_22_jpg.jpg


On Tuesday, the SP500 put in whats called an "outside reversal bar". What this means is the market took out its prior high, however failed to hold and reversed to close below the lows.  This comes after seeing last week the contract rollover from June into September, see the market sell off down to 191750 after the June contract reached its 76.4% fib extension and 1955 target with its 1954.75 high.  The market recovered after the rollover lows of 191750 last week and ended the week with the market taking out the continuous 195475 high up to 195675. This allowed the September contract to meet its 76.4% fib. Monday saw a continuation of this squeeze overnight with the Sunday globex trading seeing a squeeze up to 195975 and Monday's cash open lower. Tuesday saw the market retest this globex high, take it out by a tick at 1960.00, and fail to hold, falling down to take out the cash open to reverse the market, falling into major support at 1941.  Going forward, this reversal not only caught longs off guard, but has also left some shorts on the sidelines with Tuesday's retest of Sunday night's short squeeze.  The close below 1950 has turned the level into new resistance with pressure against 1941 based off the 1917 low made last week. The reversal down to 1941 allows buyers a retest of major support to defend and prevent the 1917 lows from failing.  Bulls must now get through 1950 resistance and recover the failed 1960 high to regain momentum.  Failure to hold 1941 support gives way to target last week's 191750 low to squeeze longs and confirm the daily new high as a failed breakout. This would be a front run ahead of next week's NFP report with the downside chase to squeeze longs and lure in shorts below 1917.  Failure to hold 1917 gives way to break the June 191375 low and put in a reversal for the month, giving room down to retest major support within 1890-1880 based off the May breakout. 


Continue reading
2526 Hits

RUNNING OUT OF BUYERS?

1-8-12b_1.jpg

Since reversing off the year lows of 1732 and through December's high to squeeze shorts, the SP coiled in a sideways range in attempt to find new buyers following that V shaped short squeeze.  The first peak high was made at 188750 in March on Non Farm Payroll numbers.  This was followed by a reversal down to 182350 mid March, before climbing back up to 1877 as the pullback was bought and the 6 month pivots turned into support.  Breakout attempt was seen early April, having to take the FRB chair to say stimulus is still needed to in order to trigger new buying to run the market into new highs setting up a jump ball on the NFP numbers that were released early April. New all time high were made by 5 points up to 189250, again on Non Farm Payroll numbers and was followed by profit taking and sellers pressing the market post NFP release. Both peak highs being made going into the jobs numbers that were both followed by immediate profit taking. The last high is more troublesome as new highs were made only to fail to continue higher, seeing a reversal back down to press and retest the March lows of 182350.  First test of this led to a bounce this week on the FOMC release the 6.5% unemployment target for the fed funds rate would be removed.  The initial reaction was an embracement by the market, seeing a bounce up to 1867 before running out of gas and reversing back down to close below the recent low of 183075 prior to that FOMC release.  Once again the market brushing off stimulus promises and a pull of the 6.5% unemployment rate that suggests rates can remain low longer. 

Going forward, pressure is being put now against the prior low of 182350 made in March to shake out longs and confirm a short term double top.  A weekly close below 1850 is bearish and creates a new range of resistance within 1850-189250.  Looking at the action made in 2014, with the early sell followed by the V shaped recovery that was fueled by shorts being squeezed, the market traded above those prior highs for 2 months in attempt to build a base and attract new buyers following the short squeeze. Failure to build the base and hold above the 2013 highs, suggests enough new buyers are not coming in to sustain the V reversal to expand higher.  If new buyers are not coming in, then the bus may be too full and this gives room to expand lower to target the year lows and confirm a failed breakout with major support at 1700 based off the October low.  Failure to hold the 2014 low of 1732, breaks the series of higher lows the market has enjoyed since the last major low of 1553 in 2013 when investors feared tapering before being squeezed up 300 points.  By taking out the last major low at 1732, this breaks the upward momentum, and gives room to move down into testing levels from 2013 and attempting a gap fill down to 1420.  Support off the year lows is seen down to 1750 for buyers to defend.

VIDEO: Watch Chicagostock's day trading signals on both peak highs.

Continue reading
4190 Hits

Does Bernanke Leaving End the Bull Parade?

1-8-12b_1.jpg


In the aftermath of what was Bernanke's last testimony to congress, equity markets squeezed new highs for the year just as the testimony wrapped up. Most congressmen were applauding the chairman for his service, somewhat having the feeling of a farewell party. The question is, if the chairman is leaving, does this mean the QE party is over and who will be last to turn off the lights? The uncertainty of the next chairman and actions is unknown. It's been quite a ride for the year, opening above 1440, last year's resistance, and seeing a gap and go breakout. Moving through all resistance and squeeze shorts in the process. This took 5 waves in the first half of the year, with 2 being minor corrective waves as tops failed.. Shorts squeezed and investors piling in, forced into equities on a QE high. This saw record highs of 168575 last May before longs began to sell into the squeezed bid to take profits. Bernanke scared investors out on June 19th with worries of tapering QE, seeing the market reverse lower from 1649.  This started a shakedown and panic into testing major support based off 1530 which originally began the leg up through 1600. The bull strongly defended this test holding in the low 1550s to prevent the reversal in trend. The market was walked back up to the 1649 level just in time to give Bernanke a second chance on another FOMC release of July 10th, and creating a "V" bottom. Bernanke was able to calm the market enough to break through 1649, triggering a short squeeze to give way to take out the all time high from May.  The latest and "last" testimony to Congress from the Fed chairmen had the market sitting on all time highs.

The SP500 followed the Transports lower Wednesday after failing to take out 3 day highs and setting up a small flat top.  The bounce to test the highs was seen as Apple earnings led the stock to jump $20 higher, luring in buyers to the SP500 for a run through 1700, only to reverse lower and close below 3 day lows. The reversal has the market pressing against major support, within 1681-1665, based off last week's pivot higher.  Failure to hold this range sees weakness in buyers and a reversal on the daily chart.  This creates the potential for a double top with the market failing to attract new buyers after taking out the May highs.  New money at these levels have new risk of uncertainty of the next Fed chairman. Next support seen at 1650, followed by 1615 with sell stops below 1550. Breach of 1550 targets 1530 Cyprus lows and the pivot that led into these all time highs. Minor upside resistance 1688-1696, break through needed for buy side to continue momentum.


Continue reading
2673 Hits

Troubled Transports

 IYT__Daily___6_1_2011___9_24_2012.jpg

The Dow Jones Transportation Average Index Fund (IYT) has now cracked 2 month lows and on the verge of testing the year lows set early June at 86.09.  As the equity markets grinded higher in August to complete the Emini SP target of 1420, many investors along with other "personalities" looked to the transports for confirmation of the equity strength. Unfortunately for these 'buyers', the confirmation in transports never came.  The transportation index fund made a high of 93.42 in August just as the Emini SP500 made new highs for the year.  As equities digested this new high and consolidated down to 1395 where a base was built, the transports corrected sharply off their August highs and fell into the summer lows.  This index turned to chase equities as the SP500 base of 1395 was supported to see a squeeze into the 1441 level, the transportation index began to play catch up.  As 1468 highs were made in the SP, the transport fund took out its August highs by 7 cents.  This attempt to breakout failed to hold these prices and breakout of this pennant that has coiled all year.  Once again with the small correction taking place in equities down to 1443.50, IYT fell sharply to take out the pivot low of 88.17 made in September just before it chased the SP higher.  With the break below 88.17, this confirms weakness in this index and the double top made in August-September as the pennant has now been broken to the downside.  Those that were looking for transports for confirmation, not only missed the move up in equities, but should be completely puzzled now of the weakness taking place here.  Going forward, IYT is looking weak. The pennant created all year has seen a break to the downside following the double top at the 9340 level. Rallies up to 90 offer oppurtunity to defend this breakdown and sell with stops above 9350.  This range will need to be taken out for buyers to regain control over this sector. Downside support levels = 83.00, 82.60, 80.84, 80.00.


Continue reading
2929 Hits

Treasury Charts

 ZB________Weekly___Week_47_2008___Week_23_2012.jpg

 Following the squeeze above its weekly resistance dating back from the 2009 highs, the market rallied to 15219 before reversing back to this trendline the market squeezed above.  Failure to hold this level turns this move higher into a failed breakout. Resistance comes in up to 15106 where sellers can look to defend these most recent highs with support at 14818-14622, 14508, 13804-13505.

ZN________Weekly___Week_45_2008___Week_23_2012.jpg

 The 10 year has reversed off its highs of 135085 and taken out the lows from this high at 133155.  In turn this has broken the rising channel the market has seen from early April.  A weekly close below 133155 is bearish and turns the level to resistance which gives potential for this latest squeeze to 135085 to become a failed breakout.  Support is seen at this resistance trendline from highs dating back in 2008 within 13217-13106, followed by next major support at 129095-127230 from where this market pivoted higher in March. 

ZF________Weekly___Week_50_2009___Week_23_2012.jpg

Same scenario in the 5 year, a break through resistance from the August 2011-February 2012 highs and a reversal lower to take out the weekly lows off this breakout.  A close below this weekly low of 123285 is bearish and should be used as resistance for sellers looking to defend this breakout.  This turns this breakout into a failed one, with next major support at 123195-123102 followed by 122080-121135 from the March pivot.


Continue reading
2795 Hits

30 Year Bond Hourly Chart

zb2-3.jpg

 more...

Continue reading
3180 Hits