Chicagostock Trading

Chicagostock Trading

US Dollar: Major Correction Coming?

DX12 28


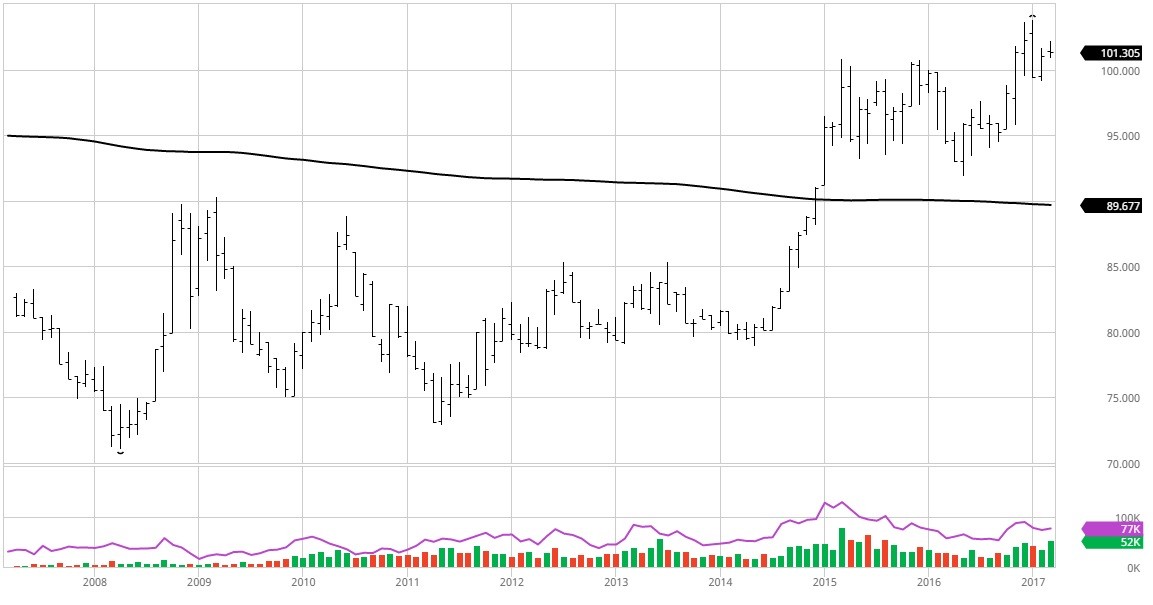
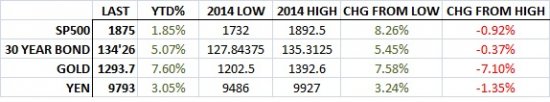
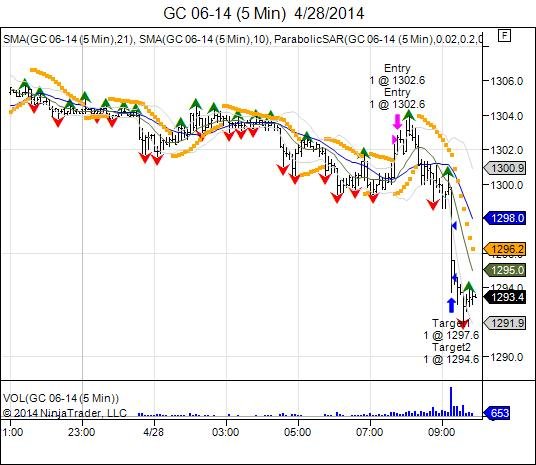
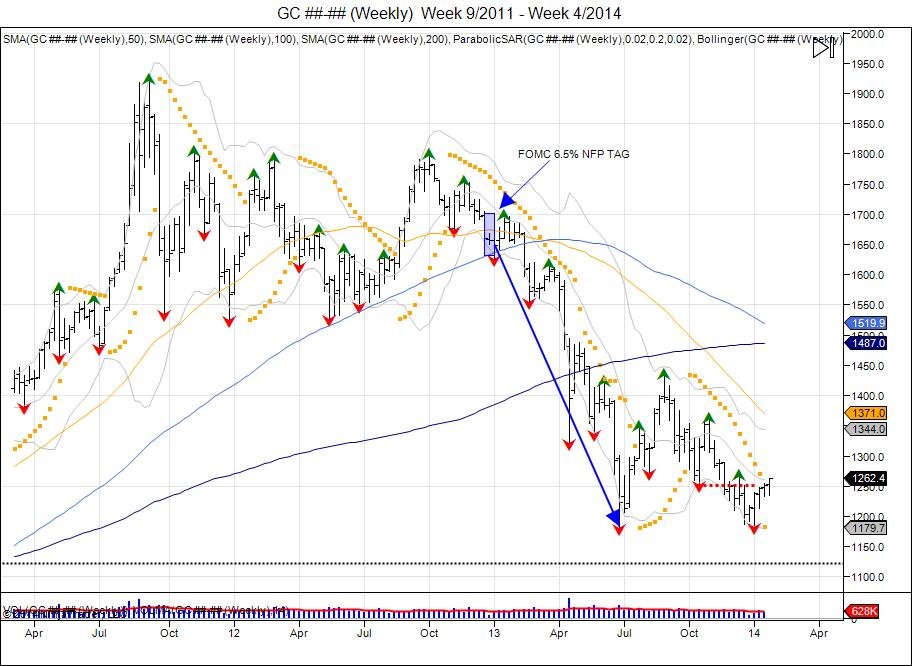
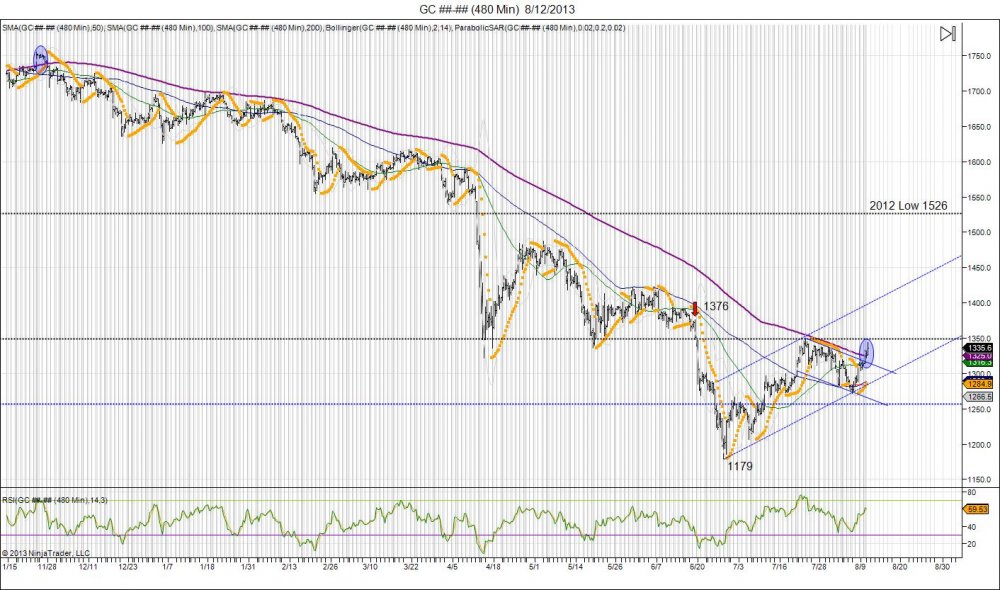
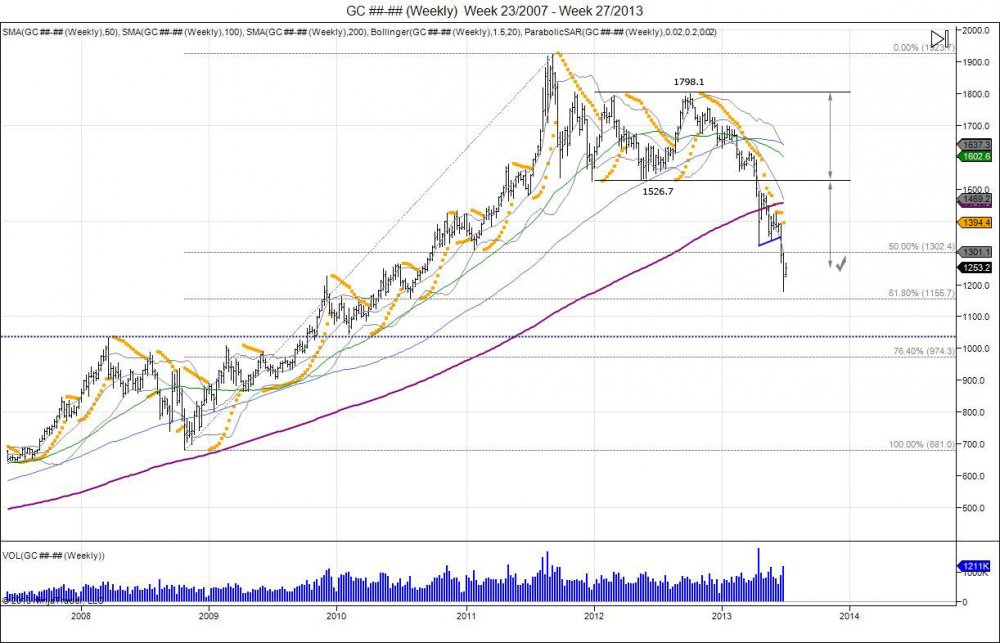
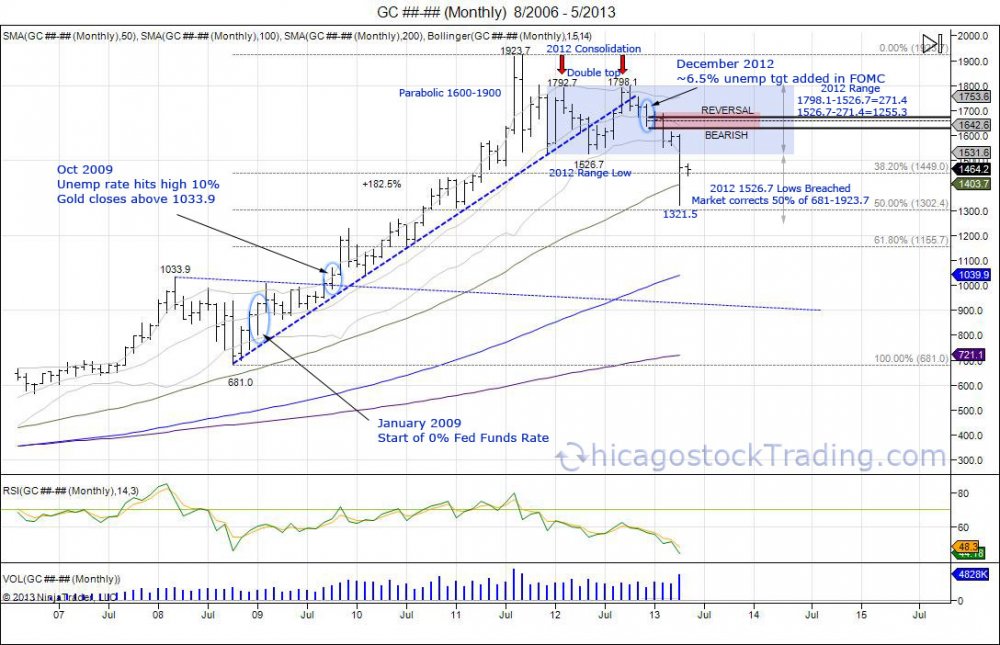
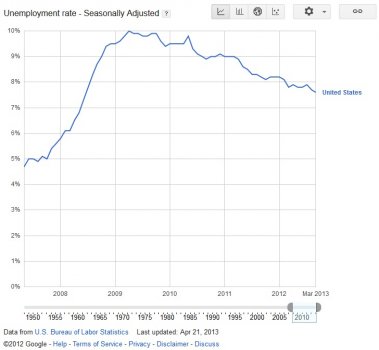
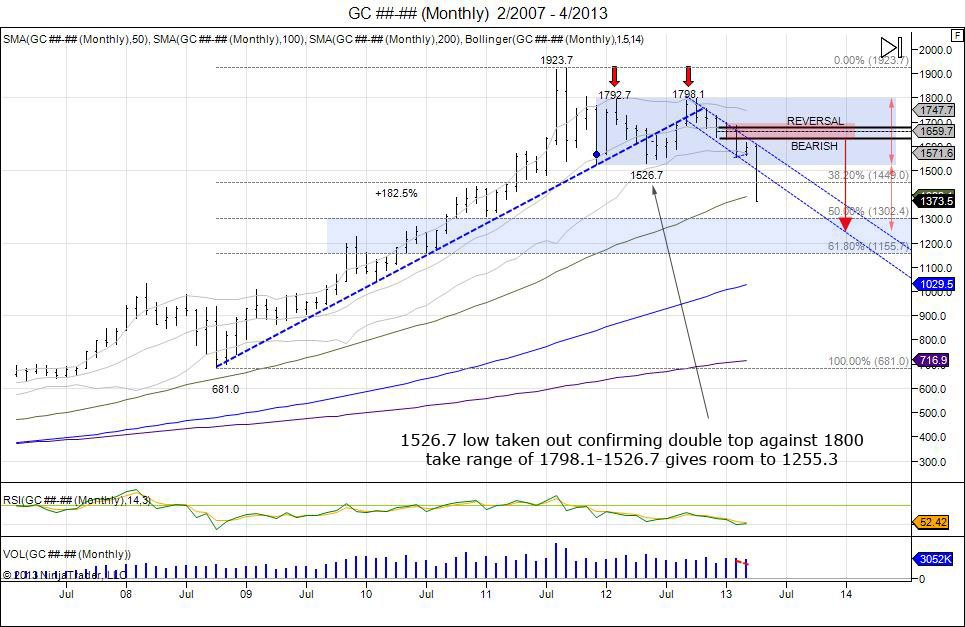
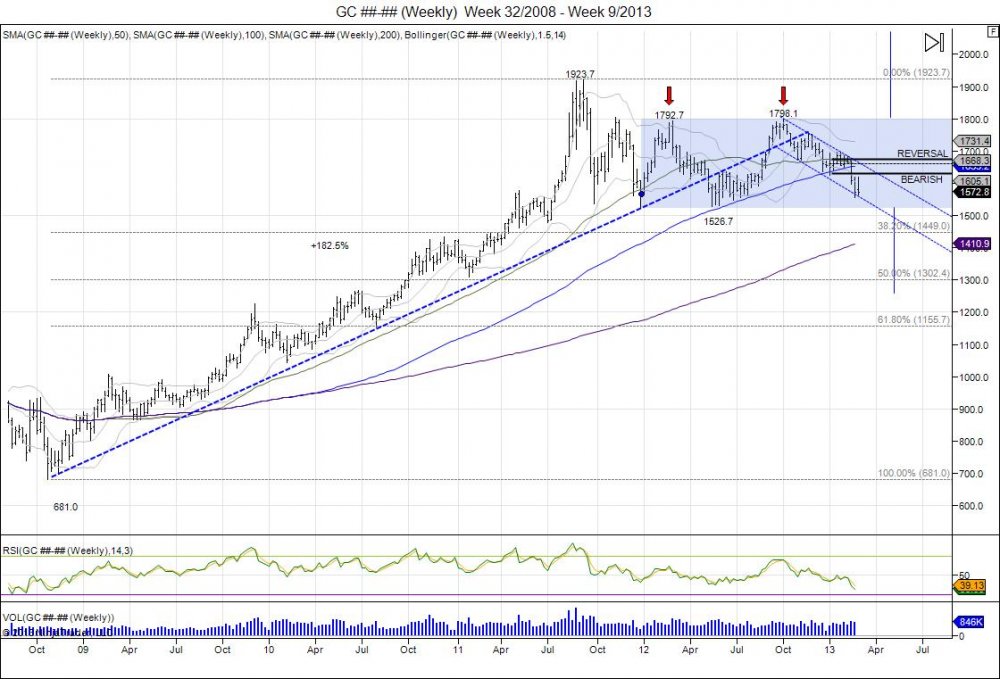
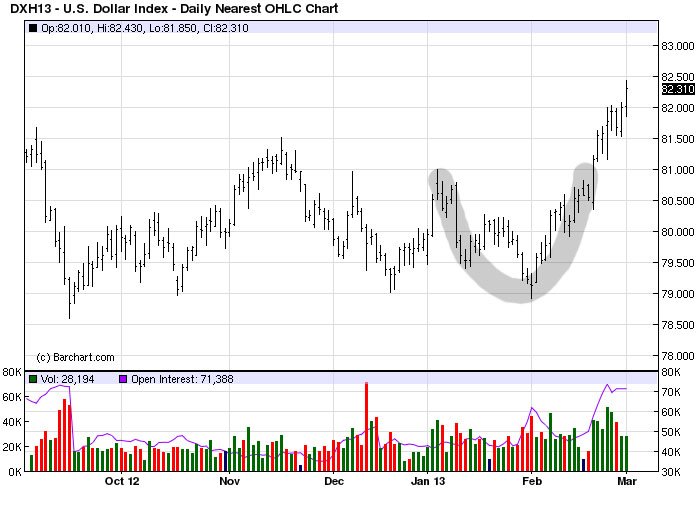
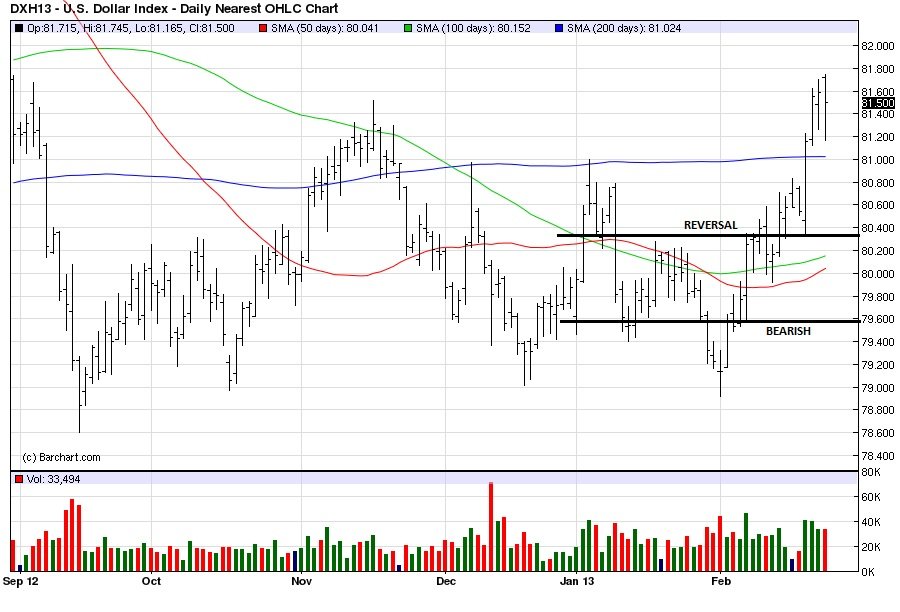
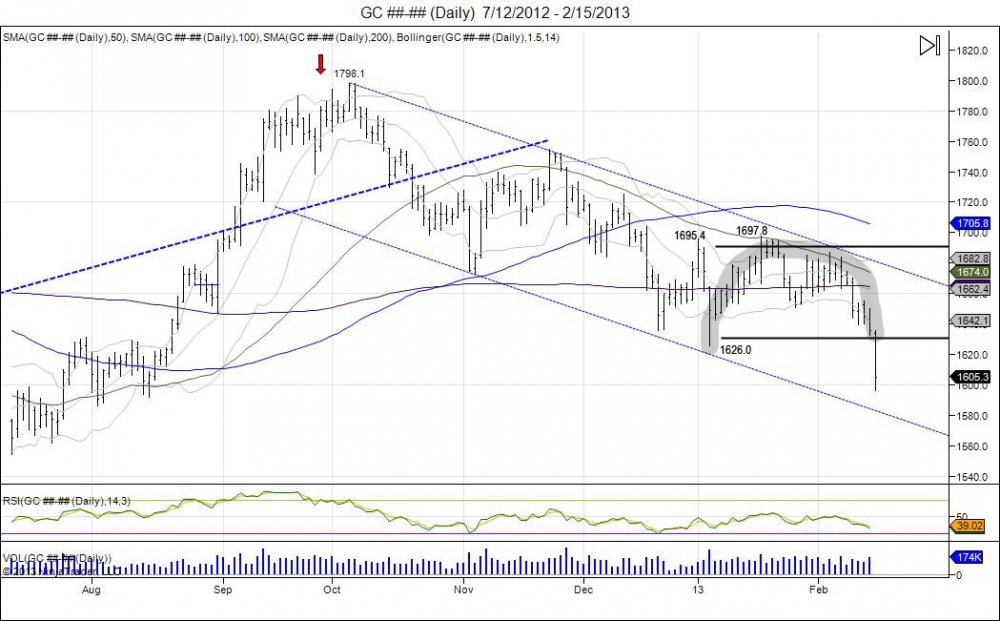
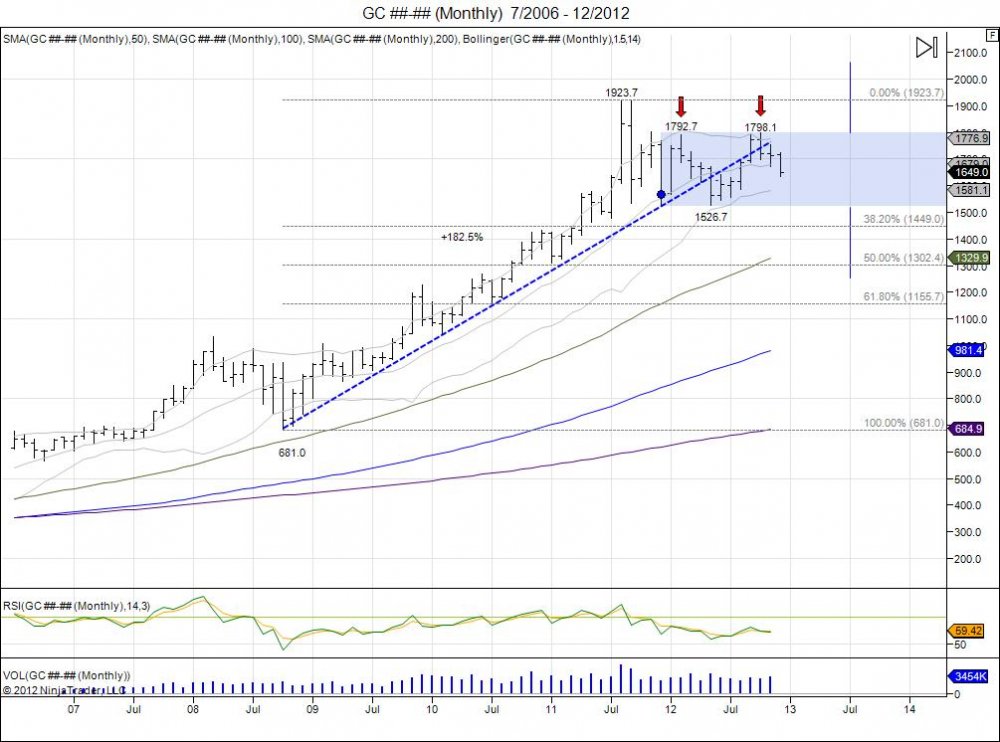
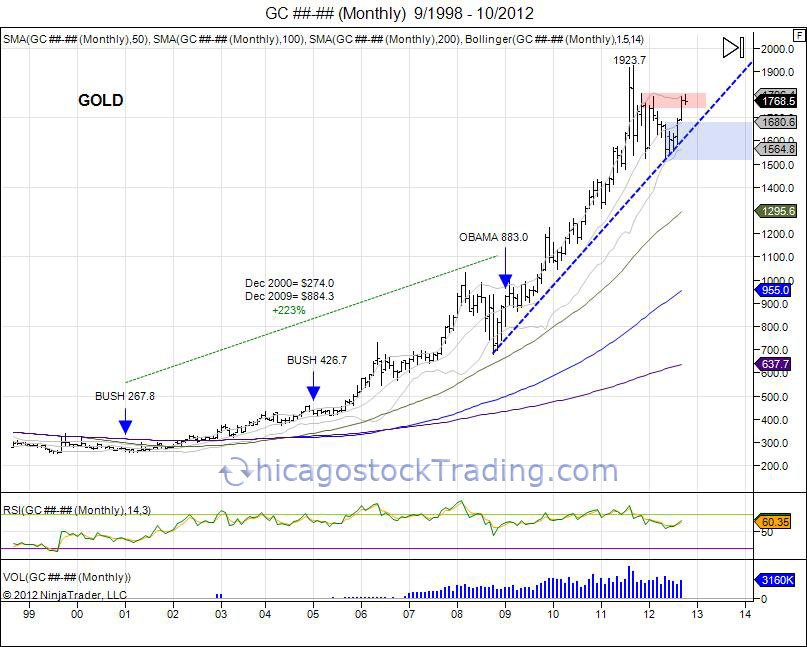
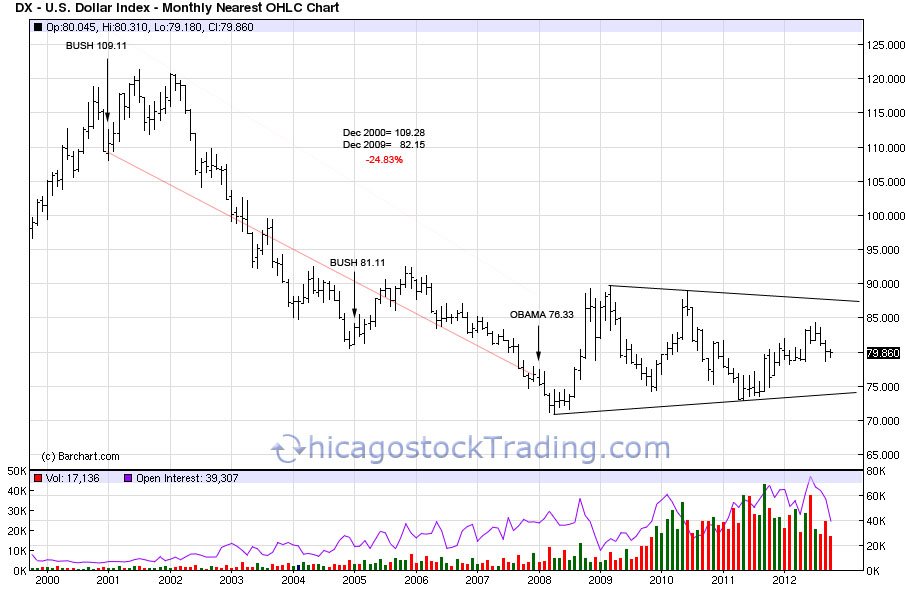
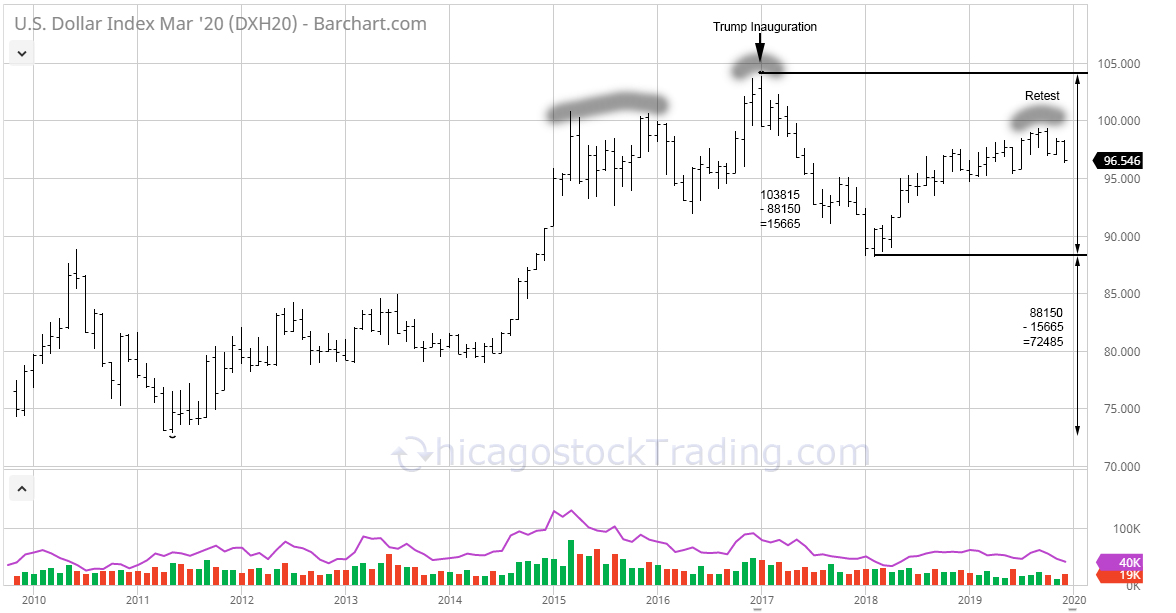
When President Trump was inaugurated in office, the US Dollar topped out with a high of 103815 in January of 2017.  In March of 2017 we wrote, "Will President Trump Devalue the US Dollar", highlighting Trump's comments about the currency, as well as the Bernanke's comments of dollar devaluation as a tool to fight deflation.  One year later, February of 2018, the dollar made a low of 88150, falling 15% from its January 2017 high.  For the last 2 years since this low, the market has worked its way higher in attempt to retest the failure in January of 2017.  The retest is technically major resistance for sellers to defend and buyers to overcome.  Thus far, the dollar has put in a lower high and is slowly backing away. Going forward, the dollar will need to overcome 100 for another shot at the high.  Failure to overcome 100 leaves the market vulnerable to continue falling in attempt to retest the 2018 low which is considered the neckline for a large monthly head/shoulder topping pattern that has developed.  A head/shoulder topping pattern is created when the market takes out a prior high to make a new high (01/17), failing to expand on the new high and falling back to take out the prior low (05/16).  By taking out the prior low, the breakout into the new high is considered a failed breakout. The low made after the breach of the May 2016 low is considered the neckline at 88150 as the market has bounced off this low in attempt to retest the failed breakout.  Breach of the neckline will be key. As breaking the neckline can see sellers chase the market to force expansion of 15.665 range (103815-88150), down to 72485 (88150-15665). The precious metals markets (gold/silver), have already seen a recovery as they have broken away from their multi-year downtrend.  Gold squeezed back to retest the Dec 2012 low of 1520, and has taken a pause since then, consolidating the gains.  Any further weakness in the USD would provide opportunity for the precious metals to push past these resistance levels in attempt to retest their highs.  


Reference: Will President Trump Devalue the US Dollar 

Continue reading
2196 Hits

Will President Trump Devalue the US Dollar?

Before Mr. Ben Bernanke became Fed chairman, he made a speech before the national Economists Club in Washington, DC. on November 21, 2002, titled “Deflation: Making Sure "It" Doesn't Happen Here.” In these remarks, there were 5 major points Mr. Bernanke pointed out as tools the Fed could use to fight deflation:

Continue reading
6096 Hits

The Great Reset

05_22_jpg.jpg

In December’s article “The Yellen that Stole Christmas”, the point was to show how buyers in the SP500 were caught above 2040, and needed a Yellen rescue.  The market attempted to breakout to start December, however the rug was pulled from underneath as Yellen reiterated a rate hike later in the month.  After bluffing the market for 2 years on this rate cut, the call fell on many deaf ears.  So it was. Buyers were left caught at higher prices, betting on a “Santa Claus Rally” only to be hoping for Yellen to save Christmas.  For the first time in 6 years and exactly 3 years from December 2012’s FOMC that placed a 6.5% target on NFP for a decision on Fed Funds rate, the FOMC reset the market and hiked the Fed Funds rate by a quarter point.  Bulls did not get what they were looking for and saw the market fall back to retest 1982 support.  The level barely held on December 18th, as the market rallied back for Christmas holiday and the “Santa Claus Rally” was actually a gift from Yellen for stuck longs above 2040 to “breakeven”, or as we like to call it “get out of jail free card”.  

Continue reading
4497 Hits

The Yellen that Stole Christmas


When the FOMC decided to place a 6.5% target on NFP rates to justify raising the federal funds rate, the SP500 was trading 1427, gold 1718, US dollar 7985, and 30 year bonds at 148.  

“… the Committee decided to keep the target range for the federal funds rate at 0 to 1/4 percent and currently anticipates that this exceptionally low range for the federal funds rate will be appropriate at least as long as the unemployment rate remains above 6-1/2 percent…” (FOMC 12/12/12 source).

Just days after this release, we highlighted the weakness in gold: Whats With Gold? FOMC Spooks Market. Double Top Eyes 1250.

Continue reading
4087 Hits

Pulling the 6.5% NFP Target

Since the December 2012 FOMC statement adding the 6.5% unemployment target to the fed funds rate:

1-8-12b_1.jpg

Bonds, Gold, and the Yen (BGY), all front ran the FRB NFP target, moving down heavily for the year 2013, while the SP500 moved up 33%.


In 2014, just as the NFP target reached 6.7% to near the 6.5% target, it was pulled.

Year to date for 2014:

Bonds, Gold, and the Yen, working against a major downward trend last year falling an average of 20.3%, all started the year of 2014 on the lows and grinded higher. This reversal for 2014 is counter to the 2013 trend, however is the way of the market completing its front run into 6.5% target.  The SP on other hand, coming off a +33% move in 2013, has held flat for 2014, threading on the highs, fighting to hold its trend versus what bonds/gold/yen are doing.  The SP is also needing to take a lot of juicing at these levels as the FRB chair came out on the 31st of March to reassure investors of continued support, WHILE THE MARKET WAS AT ALL TIME HIGHS! Seems to be the last leg of longs are being lured into the market and we did see since March 31st the market ran 20 handles higher into 189250 only to fall 90 lower.


1-8-12b_1.jpg

Thus far both of the last 2 NFP reports turned out to be the peak highs of the year and provided great trading opportunities. Join us for next NFP report by subscribing today.

Continue reading
872 Hits

DAYTRADING SP500, CRUDE, GOLD WITH CHICAGOSTOCK MONDAY 04/28/14

1-8-12b_1.jpg

1-8-12b_1.jpg


1-8-12b_1.jpg

Continue reading
908 Hits

Trading Pivots


Pivots are used to determine areas of reference for support/resistance.  Pivots are calculated by adding the high, low, and close of the determined time period, and subtracting by 3.  This gives a "mean" of the market from that past data. Pivots themselves are not always enough. By adding ranges to the pivot (above and below), this gives an area of cushion around the pivot.  The tighter the range, the more indecisive the previous data was, giving room for expansion of volatility.  In the above examples, the intraday pivots are derived from the previous day's session.  The three day pivots are derived from the last 3 trading sessions.

Continue reading
4094 Hits

Bonds, Gold, and the Fed

1-8-12b_1.jpg


Just a little over a year ago, in December of 2012, the Fed for the first time during its low interest rate policy, attatched a 6.5% unemployment rate to its fed funds rate.  As highlighted in December of 2012, this spooked the gold market, which at that time was trading 1655 with a range of 1526-1798 in 2013.  Bonds on the other hand closed the month of December at 148.  Since this new FOMC policy, both gold and the 30 year bond market front ran the unemployment rate target, seeing gold break its 2012 range of 1526-1798 to expand lower, making lows of 1179 in 2013, and lows of 12723 in the 30 year in January.  On January 10th, 2014, the BLS reported an unemployment rate of 6.7%, down 1.2% from Dec of 2012, and only .2% from the Fed's 6.5% threshold.  So with gold and bonds moving ahead of this target, and now the target coming into play, it only makes sense to see gold and bonds recover and turn the other way.


1-8-12b_1.jpg


30 Year bonds put in a failed breakdown early January as the lows from 2013 of 12801 were taken out down to 12723, and failed to hold.  This has thus far led to a reversal and short squeeze, seeing the market recover above 13100.  Overall trend remains down as seen in longer term weekly chart with major resistance for this trend coming within 13320-13524. Breach of this range will change trend and momentum in the 30 year, confirming the weekly double botom and giving room to retest the March 2013 lows at 14014.

1-8-12b_1.jpg

Gold's 2012 range of 1526-1798 (272), was expanded (272) lower into 1254.  This did not stop as panic selling came in and gold saw a flush down to 1179 before quickly recovering up to 1434. For the next few week's, gold's downside pressure from its new found downtrend below 1526, forced the market to retest the 1179 lows. Tax selling also put pressure into the end of year 2013 as investors sold gold to lock in losses and balance some of their stock gains.  In January, just as the bond market made a new low, gold also made a new low down to 1181.4, however managed to hold the 2013 low of 1179.4 by $2.  This has thus far led to a small bounce, retesting resistance from the prior high of 1267.5 made in December.  Today gold ran into these highs but has fallen short in taking them out by .5.  A move through the December 1267.5 high confirms a short term double bottom and gives room to retest next major resistance up to 1380s based off the 1434 high in mid 2013 before falling back below 1200.  This 1380-1434 level will be huge for the change in momentum and trend. As a break above this confirms a double bottom and gives way to retrace back up to and retest the 1526 level from where the market failed. 

Just as in December of 2012 with gold at 1655 and 90% of community being bullish after 90% was bearish sub 1000, this did prove correct and we did see a correction down to 1179. So at 1179, down $744 off the highs and unemp rate reaching 6.5%, is this the time to be short gold? Opposite as majority of community is back to being bearish metals, this is the time to start looking back into gold, and picking up physicals.  A flush below 1179 can still be seen, but should provide opportunity for longs as a reversal after the flush would be expected.

Continue reading
3941 Hits

Gold Breakout Looking for 1376 Above 1348

1-8-12b_1.jpg


Gold broke out of it's downward channel it has been in since meeting its 1348 resistance level late last month and squeezed through it's 200day moving average for the first time since November 2012 on the 8 hour chart above.  After completing 1255 downside objective from 1526 and even falling further to 1179, this setup oversold conditions which gave way for the short squeeze that saw the market recover back from 1179 into 1348.  This 1348 level is a major level of resistance based off the pivot high of 1376 that led into the flush to 1179.  After hitting 1348 last month the market consolidated and traded lower to shake out longs, putting in lows of 1271.8, to hold 1269.3.  This setup a small double bottom which gave way for a reversal last Friday back above 1300. The reversal late last week above 1300 put pressure against the 1320 pivot high prior to 1271.  Overnight the market took out 1320 to squeeze shorts which gave way to highs of 1343.7.  This is now retesting the 1348 level and putting pressure to squeeze through this to take shorts out and confirm the hold above 1300 to open the gates to the next major level at 1376 being the high that led into 1179.  By taking out 1376 the market recovers its fall from 1376-1179, confirming the "flush".  At this point should gold do this U turn, we look for the market to consolidate and build a base to develop support for continued retracement back to retesting the 2012 lows up to 1526.

Tags:
Continue reading
3445 Hits

Accurately Predicting Gold Trends Using Technical Analysis

GC5_8_9.jpg

(click chart to enlarge)

Gold in 2008 was the first time the market breached the $1000 mark, hitting highs of 1033.9 in March just as the Federal Reserve Bank of New York provided an emergency loan to Bear Stearns to keep the company solvent from it's bets in subprime mortgages.  This was followed by a correction and liquidation in the fall just as the equity markets began to crash in September.  The panic and liquidation selling led gold to fall into lows of 681 in October before retreating back to retest the $1000 mark in February of 2009.  This created an Elliot Wave pattern that saw the first wave 651-1033, second wave being the corrective wave from 1033-681, third wave being the move back up from 681-1007, fourth wave which was a very small 38.2% correction of the 3rd wave, setting up for the fifth wave to try and continue higher.


GCTRADE1-2.jpg

(click chart to enlarge)

The fifth wave completed with gold moving from 865-1227.5 just as the Federal Reserve bank lowered their federal funds target rate to 0% in January of 2009.  This gave gold the fuel to move back through $1000 and continue this 5th buying wave to take out the old $1033.9 highs.  Showing gold's strength and proving naysayers who did not see gold breaching over $1000 again wrong.  As the 5th wave completed with highs of 1227.5, this led to profit taking and a small correction as gold corrected 50% of the 865-1227.5 move as well as coming back to retest the old 1033.9 highs with the gold making a low of 1044.5 in February of 2010. 


Continue reading
4970 Hits

What to do with Gold.

GC________Weekly___Week_23_2007___Week_27_2013.jpg

Back in December of 2012 on the 12th, the FOMC released their statement that “… the Committee decided to keep the target range for the federal funds rate at 0 to 1/4 percent and currently anticipates that this exceptionally low range for the federal funds rate will be appropriate at least as long as the unemployment rate remains above 6-1/2 percent…”.  This was the first time since having rates at 0% the committee attached an unemployment rate “target”.  Since this statement, gold made a high of 1725 on that day, and never looked back.  It has been straight down since then. But this was not the beginning of selling in gold.  This was just a catalyst for long term holders to take profits. As we pointed out back in December “What’s With Gold? FOMC Spooks Market, Double Top Eyes 1250.”   Again this was not the beginning of selling.  Gold had a target of just above 1900 when it created a “diamond” pattern in August of 2011.  This was a continuation of the parabolic stage the market went in after the debt deal passed earlier that month.  Sure enough gold squeezed through 1900 into 1923.7 and reversed down into lows of 1535.  This was a major shakedown in the market place and left a lot of late buyers holding the back at parabolic prices above 1700.  Throughout 2012, the year was one major consolidation period.  After an early high of 1792.7 in March, the market pulled down to put in lows of 1526.7 in May. Not ready to breakdown, the market squeezed shorts and rallied back to take out the March high and print new highs for the year at 1798.1.  These new highs for the year once again failed to push past 1800 and the failure turned into a double top attempt.  Since this 1798 high, gold has been in profit taking and selling.  When the FOMC released their statement in December, this just gave excuse to continue the profit taking and move lower.  To start 2013, gold attempted to rally, only to put in highs of 1697.8 and roll over.  The reversal in January of 2013 to break the year low of 1626, continued the selling pressure, targeting the 2012 low of 1526.7.  With the 2012 low of 1526.7 being taken out in April, this confirmed the 2012 highs against 1800 as a double top.  By taking the range of 1526.7-1798.1 or 271.4, this gave a downside target of 1255.3. 


Most recently, we have seen gold complete this downside target of expanding the 2012 range down to 1255.3.  Of course the market did not stop there and went into further selling as longs panicked and stops continued to be shaken.  This led the market to fall below 1200 into lows of 1179.4, almost retracing 61.8% at 1155 of the 681 to 1923 move.  The breakdown below 1200 after completing 1255 put the market into extremely oversold levels.  The bear in gold is not new, this bear has been around since that 2012 double top, and the trend down since that high has been a $618 decline in prices from 1798.1-1179.4.  Short term gold is oversold, thus the bounce being attempted.  Gold below 1250 gives investors who patiently waited for prices to turn lower an opportunity to come in and pick up some physical and or invest long term at a 50% discount.  Gold remains in major downside pressure until it can close above 1300.  Doing so can give way to squeeze late shorts and attempt to retrace the market back to the 2012 low of where the market failed at 1526.  This old support should then act as new major resistance, however gives an upside target for buyers sub 1250 to target.  Bottom line: As we were bearish gold in 2012, we are now cautiously bullish and like putting some powder to work.  Failure to hold 1150 sees next major support at 1126-1045. Regardless, gold was trading 1900 just a few years ago, at 1250, this is a steal. Yes we can move lower, but it will only allow more opportunity to buy at lower prices, and NOT at parabolic prices.


“Buy weakness, sell strength’


Tags:
Continue reading
4126 Hits

Gold Monthly Outlook

GC________Monthly___8_2006___5_2013.jpg


When the FOMC came out with a 6.5% unemployment target, this put gold on the edge fearing higher rates.  This was enough to hold the 2012 double top after consolidating the 1600-1900 parabolic move with lows of 1526.7 and break below 1700 into 2013 to make this a new level of resistance.  January this year gold tried to rally only to fail at 1697.8 and break below the year lows of 1626 giving way toward the 2012 low of 1526.7. With the market falling below the 2012 low, this squeezed the 1526.7-1798.1 range, retracing the market near 50% of its 681-1923.7 move. Since hitting 1321.5 gold has reversed back above 1400 and quietly trying to fill back the breakdown.  The old lows of 1526.7 as the bottom of the 2012 range will provide a major area of resistance.  For the gold bull to take control after this 50% correction, a 7 day hold above 1700 reverses downside momentum and targets all time highs for resumption of the bull trend. Below 1526.7 will continue to give pressure lower as late buyers in gold during the parabolic move of 1600-1900 are caught holding higher prices.


unemp5_3.jpg


Continue reading
2688 Hits

Where to Buy Gold

GC________Monthly___2_2007___4_2013.jpg


Since the December 2012 FOMC meeting that "Spooked the gold market" as the FOMC members attached a 6.5% unemployment for a target on rates, gold has fallen $362.6.  However since the failure to break above 1800 in 2012 and double topping at 1798.1, the market is down $442.8. So why the sudden crash over the past 2 days? As we know the market ran from 681-1923.7 as the FOMC cut their rates down to 0%.  The year of 2012 was all about consolidation.  It traded in a range of 1526.7-1798.1 which lured in a lot of late buyers betting on "hyperinflation".  As gold has most recently failed and broken below this 2012 low of 1526.7, it has confirmed the highs in 2012 as a double top.  This range of 271.4 (1798.1-1526.7) can now be subtracted below 1526.7 to give room to expand the market down to 1255.3.  This target when put out in December was looked at as a crazy and a lot of "gold bugs" were insulted. Today the market is bringing pain to these gold bugs as it shakes them out.  The current breakdown clears and shakes out buyers who came into the market above 1500.  The move is good for "smart" money who have been sitting on the sidelines awaiting for the market to go on sale. Completion of this move is seen at 1255 which also retraces the market 50% of its 681-1923 move. In the big picture, that would offer a 50% sale off the highs and bring the market back to where it broke out in 2010.  This range of 1200-1300 will offer an area of major support for the market to attempt to build a base for long term buyers to watch for to come in and buy the sale.  A break of 1150 would give room to test major support at 1000 being where the market broke out in 2009.  Failure to hold above sees the 681 low  targeted and at that point the long gold story would be all over. Short term yes the market is very over sold and the long community is in shell shock, the old lows of 1526 is now new major resistance with next level of sell stops below 1309.1 as the 2011 lows.


Continue reading
4404 Hits

Gold $98 Locked & Free Ride for Another $366

 GC________Weekly___Week_32_2008___Week_9_2013.jpg

Gold's double top from 2012's year of consolidation following the 182% gain from 681-1923.7 has seen the market channel lower since that high of 1798.1.  This year began with a early breakdown followed by a bounce up to 1697.8 where the market failed to push through, leading the market to breach the year lows of 1626 in contrast to the US dollar reversed to take out its year highs.  Going forward, the market is now testing its last level of support based off its 1526.7 lows made in 2012.  This week has been a major failure as the market rallied to take out last week's highs of 1618.8, only to fail and turn back lower to where the week opened at 1579.7.  The downside chase continues and the 2012 lows are being targeted by bears.  A breach of thsi 1526.7 low confirms the 2012 double top and gives room to expand that $271.4 range which gives a downside target of 1255.3.  This would retrace the makret 50% of its 681-1923.7 move and offer long term investors a big area to buy.  Move back above 1676 reverses the bearish bias to give room to retest year highs.

Continue reading
3424 Hits

Reversals of the Year

 dx3_1.jpg

Continue reading
3440 Hits

Major USD Reversal No One is Talking About


US DOLLAR:

DX2_25.jpg

The US dollar is one of the most important, yet least discussed chart of the year.  Noticing the dollar's break below 79600 late January, early February, only to establish a bearish bias and lure in shorts before turning around higher. The market has held above its reversal window, thus reversing the bearish bias which has led the market to take out its year highs of 8100 set early January.  This U turn is having a major effect and pressure on commodity markets as the USD failed to break lower and is trading on new highs for the year. Take note of the gold chart how it is completely opposite of the dollar chart and is an upside down "U" from the beginning of the year.


ES________Daily___3_14_2012___2_25_2013.jpg


Click charts to maximize

Continue reading
2709 Hits

Gold Breaks Year Lows, Whats Next?

 GC________Daily___7_12_2012___2_15_2013.jpg

Gold broke its year low of 1626 today after it bounced off the level early January only to take out the early year high of 1695.4 by a few points at 1697.8.  The market failed holding above the year highs in mid January and fell lower to retest the lows later in the month and beginning of February.  After 2 weeks of consolidation above 1650 exhuasting daytraders selling, the market finally broke below 1651 on the 11th of February.  This killed the attempt to build an inverted head/shoulder bottom and regained the bearish momentum as the market held below 1650 to keep buyers above trapped. Trapping these buyers led to the move today in breaking the year lows to run stops and fall down to 1596.7, 101.1 off the year highs.  This has the market now testing major support off last year's lows of 1526.7.  As seen on the daily chart, the market has created a upside down U turn. Meaning gold started at 1626, moved to 1697 and now back below 1626.  Going forward, a 5 day hold below 1630 establishes a bearish bias for the first half of the year and gives room to continue the move lower.

Continue reading
3361 Hits

UPDATE SP500, Crude Oil, Gold

SP500 120 MINUTE:ES________120_Min___2_13_2013.jpg


OIL 120 MINUTE: 

CL________120_Min___2_13_2013.jpg

Continue reading
881 Hits

Whats With Gold? FOMC Spooks Market. Double Top Eyes 1250.

 GC12_20_12.jpg


When gold made highs of 1033.9 on March 17, 2008, it was a day later when the Federal Reserve came out with a FOMC statement, lowering the target for the federal funds rate aggressively by 75 basis points down to 2.25.  It was during this year this federal funds rate had begun to see drastic cuts from the Fed, until it finally got to 0-.25% early 2009.  Throughout all of 2008 the funds rate dropped from 4.25-1.00%.  Throughout this time, gold also saw a correction as the economy crashed in fall of 2008 seeing gold prices down to 681 in October.   Having already seen a 99% increase in prices from 519.5 to start 2006 into 1033.9 in March of 2008 this gave some reasoning for people to sell and take profits.  The shakeout brought prices down to 681 in the fall before bouncing off these lows.  This led to another push back at the 1000 level where the market coiled like a spring looking for direction.  During this time, 90% of the investment and trading community did not expect to see gold to run through 1033.9 anytime soon.  Sure enough,  with the third attempt in 2009, the breakout was seen: http://twitpic.com/co4yy.  This breakout created a parabolic run seeing another 86% added on top of 1033.9 to run into highs of 1923.7 in September of 2011, just 3 years after making the 681 lows.  All throughout this time, the fed funds rate remained 0-.25%.  The investment community jumped on the bandwagon and commercials for gold investments skyrocketed.  Since making this parabolic high of 1923.7, a correction began as the market looked to consolidate the move (http://twitpic.com/7bylsj).


2011 closed out with prices trading at 1566.8.  For the year of 2012, it has been all about consolidation.  The market once again ran into the 1800 resistance level early in the year with highs of 1792.7 before seeing another correction down to 1526.7 in May.  Not ready to move lower, the market held the December lows of 1523.9 and squeezed shorts and sellers as the market returned back to the highs of the year, once again pressing that the 1800 level.  The market put in highs of 1798.1 in October.  Once again, failing to push through 1800 for the THIRD attempt.  This created a double top for the year of 2012 with highs of 1792.7 and 1798.1.  Thus far the market has fallen back to the mean of the year inside the 1660 level.  This pullback has the market retesting where it broke out in  August of 2012 where the market pushed above the 1640 resistance level that troubled it during the summer.  This is now MAJOR support for the market and for gold bugs to defend.  The pullback offers the gold bugs this retracement to defend this pullback where the market originally broke out, turning old resistance of 1640 into new support.  Unfortunately, gold bugs defending this pullback must look to risk a break below the 2012 low of 1526.7.  Since gold is in a trading range of 271.4, this trading range gives the target on any expansion outside the range. Meaning a breach of 1526.7 gives room down to 1255 which would retrace the market down to the June 2010 high and just a little over a 50% retracement of the 681-1923.7 move.  Conversely, should buyers be able to hold the 1526.7 lows (which I don’t expect), a move through 1800 can see an upside target of 2069.5 by simply taking the range of 271.4 and adding it to 1798.1.  This is the task for next year, 2013 to find direction in the gold market. Throughout 2012 the market consolidated and traded within this range of 271.4 and put in a failed higher high at 1798.1 which gives the potential of a double top.  Of course just as 90% of the community was bearish gold sub 1000, 90% of the community is now bullish gold.  Regardless, we have a range bound market seeing pressure to break lower and shake down to 50%. This comes on the heels of the latest FOMC statement where for the first time since dropping the Fed funds rate to 0-.25%, the Fed finally attached a target to how long they will keep interest rates this low.  In the latest FOMC statement on December 12, 2012, “… the Committee decided to keep the target range for the federal funds rate at 0 to 1/4 percent and currently anticipates that this exceptionally low range for the federal funds rate will be appropriate at least as long as the unemployment rate remains above 6-1/2 percent…”. After 3 years of having low rates with no target, a target now given, the gold market is being cautious and since this FOMC statement, already down $82 to 1636.


Continue reading
15505 Hits

-24.8% USD = +223% GOLD

 GC________Monthly___9_1998___10_2012.jpg


DX10_11.jpg


Continue reading
1133 Hits