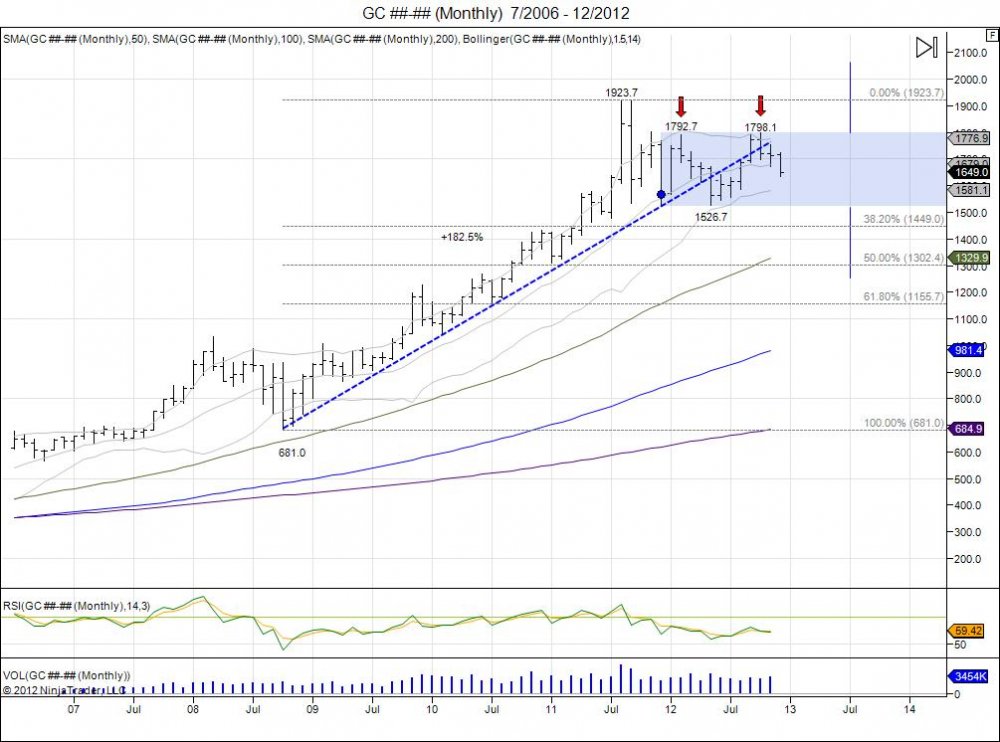
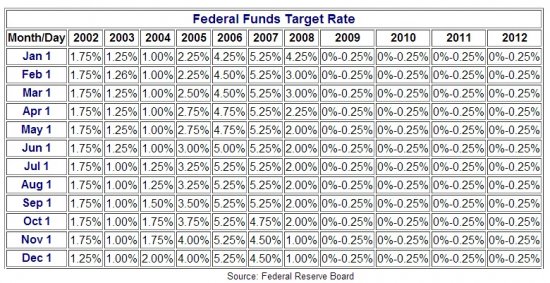
When gold made highs of 1033.9 on March 17, 2008, it was a day later when the Federal Reserve came out with a FOMC statement, lowering the target for the federal funds rate aggressively by 75 basis points down to 2.25. It was during this year this federal funds rate had begun to see drastic cuts from the Fed, until it finally got to 0-.25% early 2009. Throughout all of 2008 the funds rate dropped from 4.25-1.00%. Throughout this time, gold also saw a correction as the economy crashed in fall of 2008 seeing gold prices down to 681 in October. Having already seen a 99% increase in prices from 519.5 to start 2006 into 1033.9 in March of 2008 this gave some reasoning for people to sell and take profits. The shakeout brought prices down to 681 in the fall before bouncing off these lows. This led to another push back at the 1000 level where the market coiled like a spring looking for direction. During this time, 90% of the investment and trading community did not expect to see gold to run through 1033.9 anytime soon. Sure enough, with the third attempt in 2009, the breakout was seen: http://twitpic.com/co4yy. This breakout created a parabolic run seeing another 86% added on top of 1033.9 to run into highs of 1923.7 in September of 2011, just 3 years after making the 681 lows. All throughout this time, the fed funds rate remained 0-.25%. The investment community jumped on the bandwagon and commercials for gold investments skyrocketed. Since making this parabolic high of 1923.7, a correction began as the market looked to consolidate the move (http://twitpic.com/7bylsj).
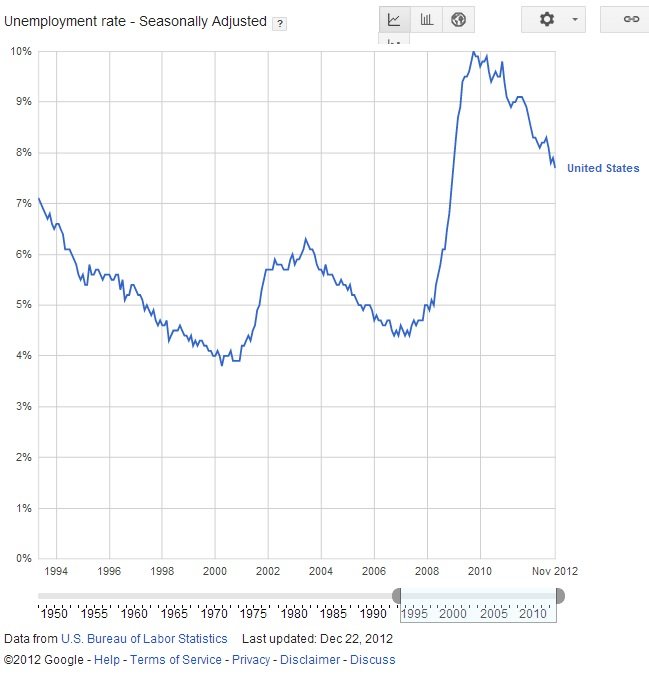
2011 closed out with prices trading at 1566.8. For the year of 2012, it has been all about consolidation. The market once again ran into the 1800 resistance level early in the year with highs of 1792.7 before seeing another correction down to 1526.7 in May. Not ready to move lower, the market held the December lows of 1523.9 and squeezed shorts and sellers as the market returned back to the highs of the year, once again pressing that the 1800 level. The market put in highs of 1798.1 in October. Once again, failing to push through 1800 for the THIRD attempt. This created a double top for the year of 2012 with highs of 1792.7 and 1798.1. Thus far the market has fallen back to the mean of the year inside the 1660 level. This pullback has the market retesting where it broke out in August of 2012 where the market pushed above the 1640 resistance level that troubled it during the summer. This is now MAJOR support for the market and for gold bugs to defend. The pullback offers the gold bugs this retracement to defend this pullback where the market originally broke out, turning old resistance of 1640 into new support. Unfortunately, gold bugs defending this pullback must look to risk a break below the 2012 low of 1526.7. Since gold is in a trading range of 271.4, this trading range gives the target on any expansion outside the range. Meaning a breach of 1526.7 gives room down to 1255 which would retrace the market down to the June 2010 high and just a little over a 50% retracement of the 681-1923.7 move. Conversely, should buyers be able to hold the 1526.7 lows (which I don’t expect), a move through 1800 can see an upside target of 2069.5 by simply taking the range of 271.4 and adding it to 1798.1. This is the task for next year, 2013 to find direction in the gold market. Throughout 2012 the market consolidated and traded within this range of 271.4 and put in a failed higher high at 1798.1 which gives the potential of a double top. Of course just as 90% of the community was bearish gold sub 1000, 90% of the community is now bullish gold. Regardless, we have a range bound market seeing pressure to break lower and shake down to 50%. This comes on the heels of the latest FOMC statement where for the first time since dropping the Fed funds rate to 0-.25%, the Fed finally attached a target to how long they will keep interest rates this low. In the latest FOMC statement on December 12, 2012, “… the Committee decided to keep the target range for the federal funds rate at 0 to 1/4 percent and currently anticipates that this exceptionally low range for the federal funds rate will be appropriate at least as long as the unemployment rate remains above 6-1/2 percent…”. After 3 years of having low rates with no target, a target now given, the gold market is being cautious and since this FOMC statement, already down $82 to 1636.
RISK DISCLOSURE: PAST PERFORMANCE IS NOT INDICATIVE OF FUTURE RESULTS. THE RISK OF LOSS IN TRADING FUTURES AND OPTIONS IS SUBSTANTIAL AND SUCH INVESTING IS NOT SUITABLE FOR ALL INVESTORS. AN INVESTOR COULD LOSE MORE THAN THE INITIAL INVESTMENT.

