In no particular order, here were the top 5 major market changing trends of 2016 identified by Chicagostock:
1- DOW JONES CUP/HANDLE TARGET 20K
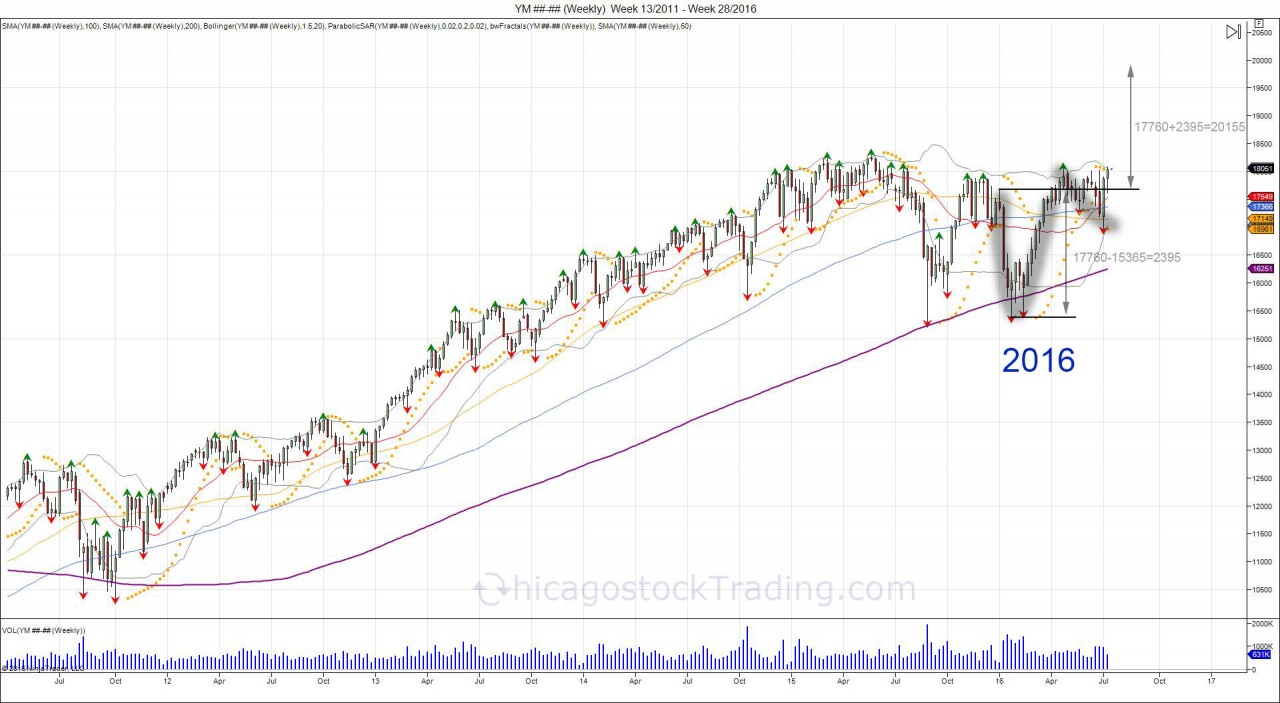
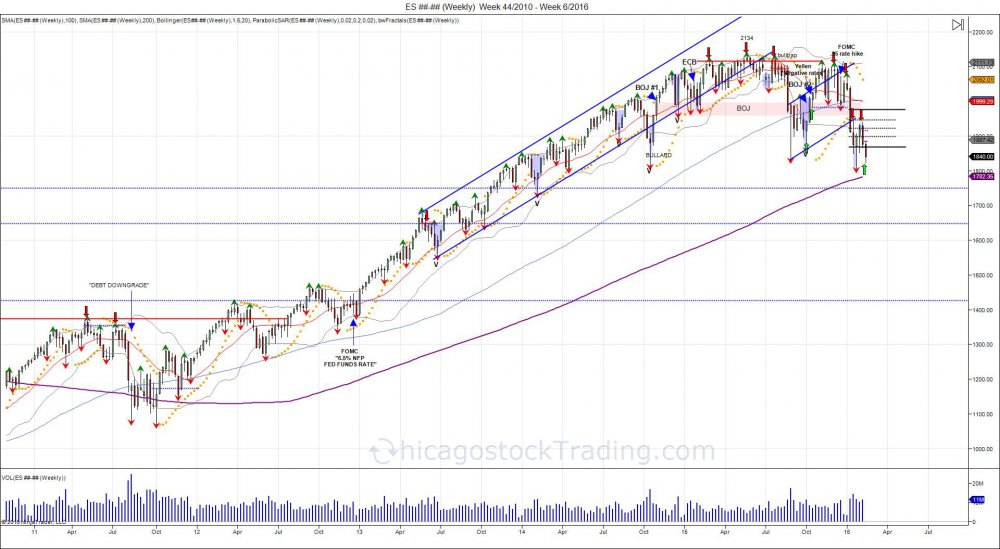
 The stock market started 2016 weak, however recovered the highs of the year by summer, making a U turn. Those that were caught short, bearish, and wrong, were now forced to reverse position, thus creating the cup/handle formation, giving way to expand the U turn up to 20k.
1- DOW JONES CUP/HANDLE TARGET 20K
$YM_F Dow C/H Expansion = 20k... All aboard.. $DIA pic.twitter.com/RuhbCGiM6w
— Chicagostock (@Chicagostock) July 10, 2016

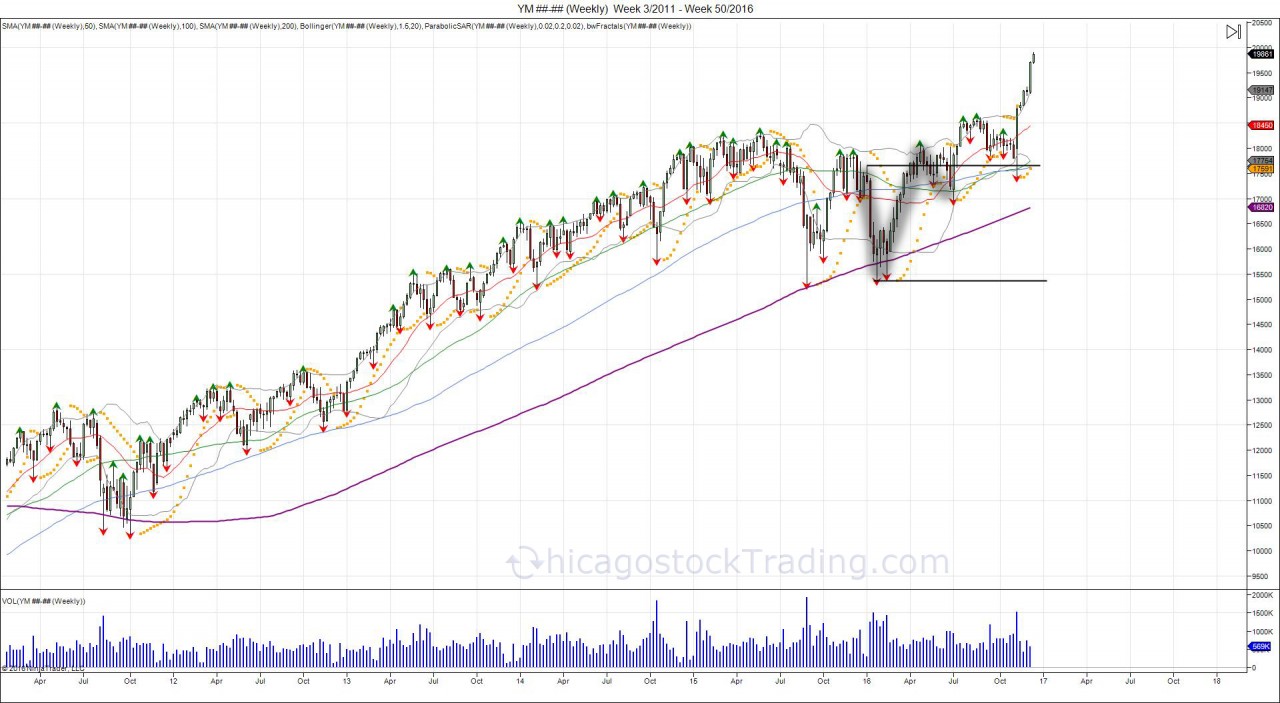
Update to Cup/Handle in DOW posted in July projecting 20k. #technicals #stockmarket #dowjones @NYSE @CMEGroup pic.twitter.com/6fJpdvVmxz
— Chicagostock (@Chicagostock) December 15, 2016
 The stock market started 2016 weak, however recovered the highs of the year by summer, making a U turn. Those that were caught short, bearish, and wrong, were now forced to reverse position, thus creating the cup/handle formation, giving way to expand the U turn up to 20k.
3459 Hits

 3_15_2013_1.jpg)