Chicagostock Trading

Chicagostock Trading

09/17/12 30 Year Bond & SP500 Charts

ZB________Daily___12_23_2011___9_17_2012.jpg 

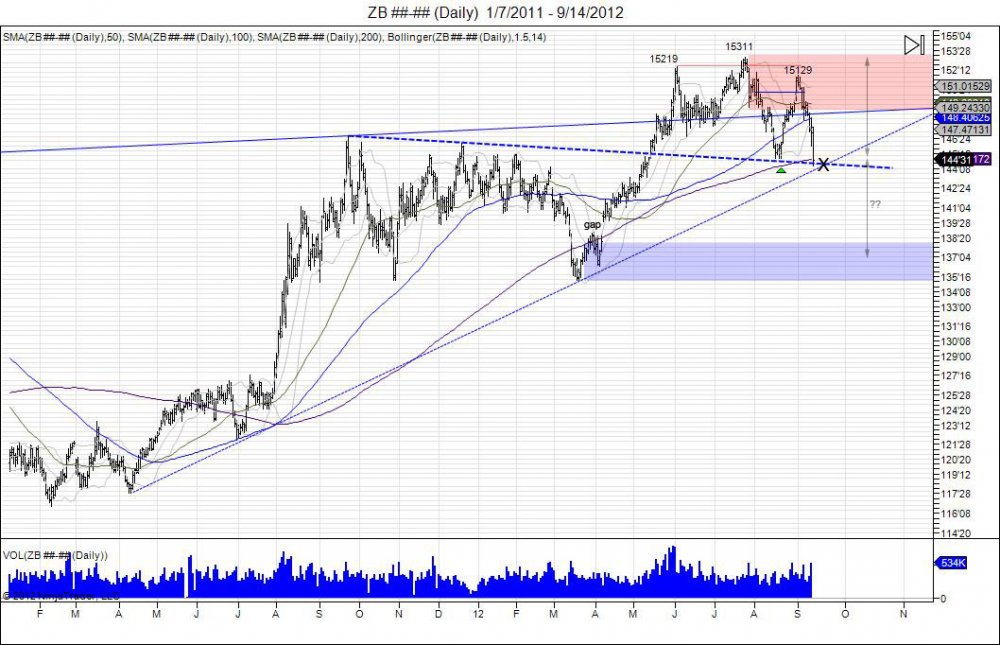
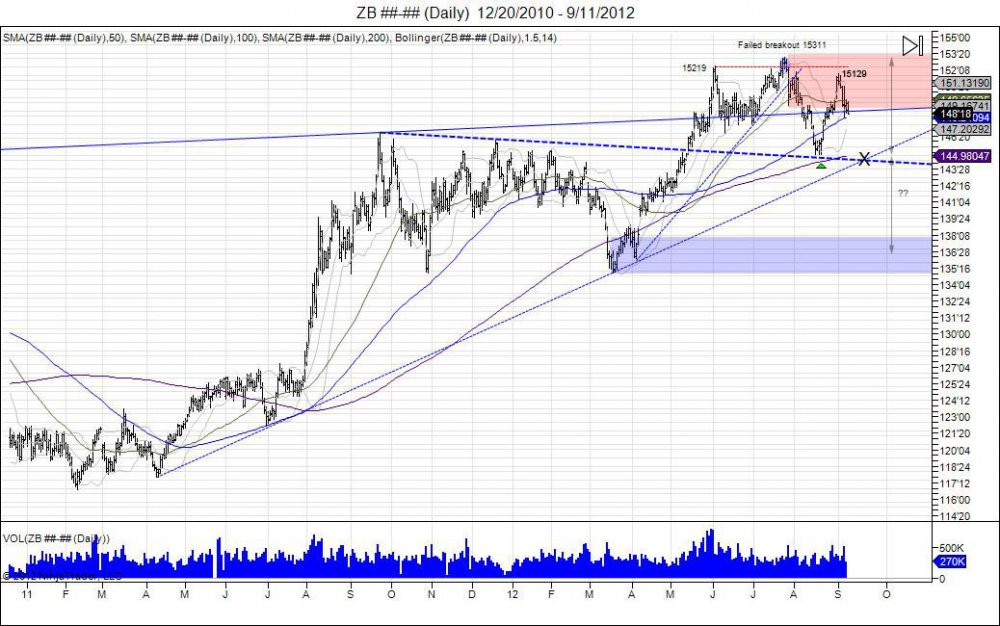
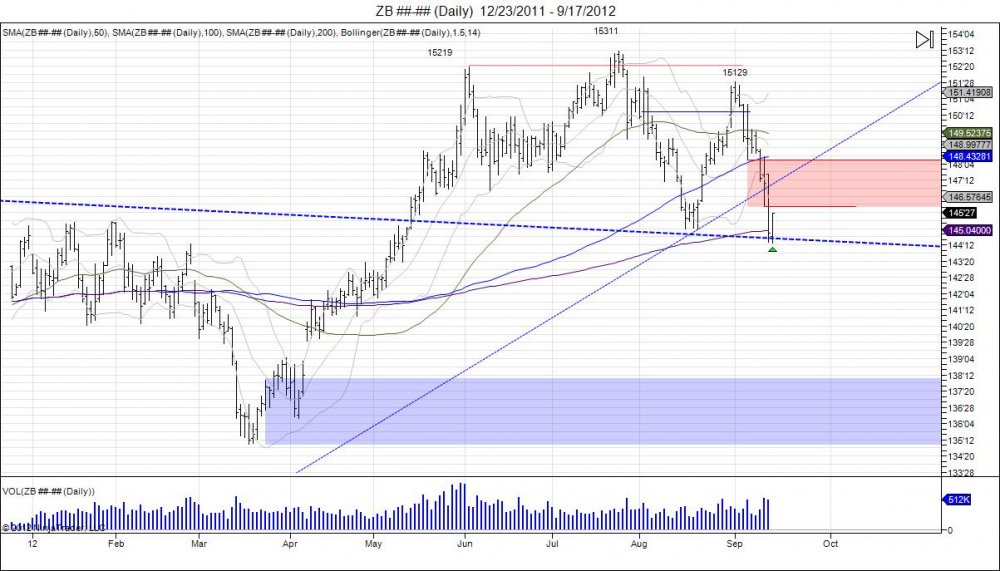
After putting in a lower low by a tick overnight down to 14415, the 30 year bond covered shorts as buyers came in to defend this neckline currently in jeopardy.  This neckline is in jeopardy due to the failed retest of the 15311 high as the market ran to 15129 and turned lower in turn building a right shoulder.  The currently action being seen now is an attempt to flag off this neckline support of 14416 to retrace into testing where the market failed.  First level comes in at the FOMC lows of 14605, thereafter 14810-15129 being the range of the right shoulder. Retracements into this offer sellers a level to defend as a break through 15129 is needed to squeeze the bear and target the 15311 highs to void out this head/shoulder topping pattern.

ES________Daily___2_24_2012___9_17_2012.jpg

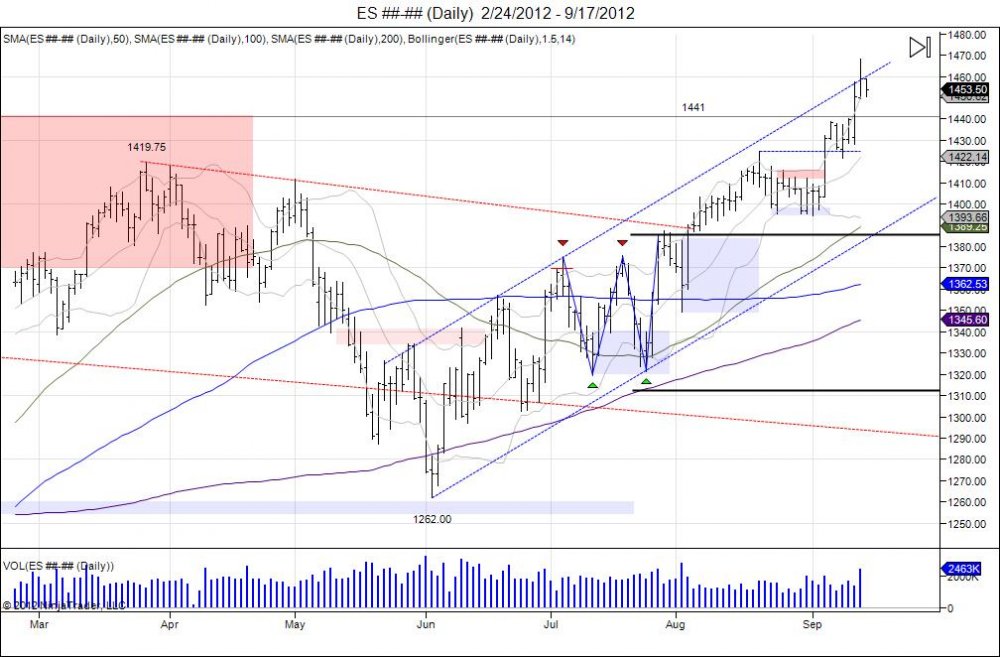
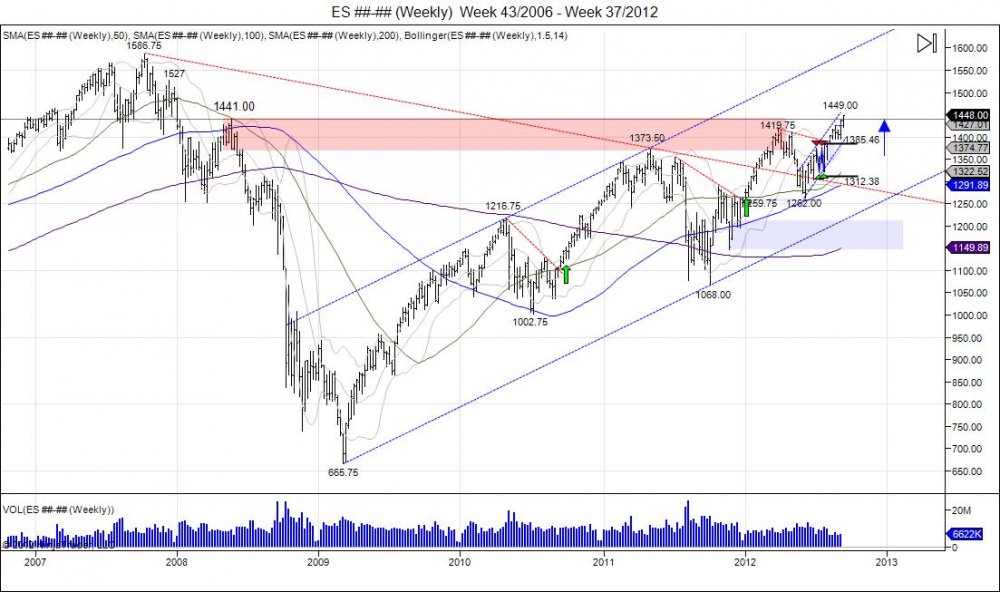
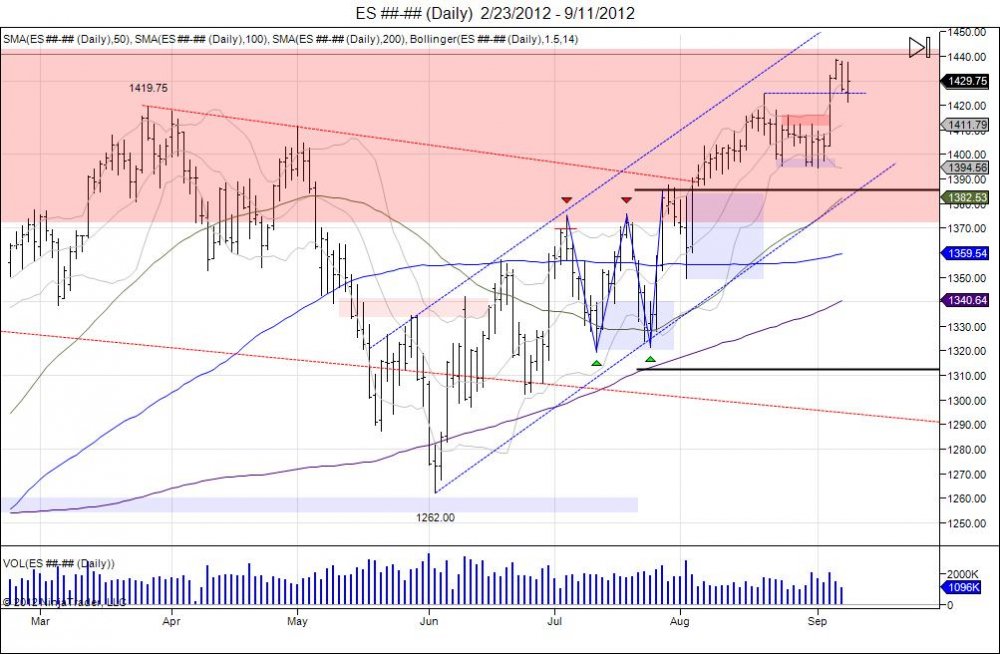
As the 30 year has fallen into a major line in the sand, the Emini SP500 has also crossed through its major level of 1441 and topped at 1468.  This 1468 level was tapped to the tee and kept a lid on prices in the short term as the market pierced the top of its daily channel since the 1262 lows made in June.  Currently pullback is being seen to test Friday's lows of 1449.50 as support for buyers to defend and retest the highs above 1460.  Next major resistance comes in at 1481 based off the December 2007 high of 1527.  Downside support is seen within1438-1421, 1410-1395, and 1383-1349.

Continue reading
3757 Hits

30 Year Bond Market X Marks the Spot

 ZB________Daily___1_7_2011___9_14_2012.jpg


The 30 year bond market has fallen back down to take out its neckline made from the August lows of 14503. This comes as the market bounced off those levels to retest the June highs only to fall short at 15129 on the first trading day of September. Throughout the month of September, money has been coming out of this market going into the FOMC decision yesterday with lows of 14710.  Following this FOMC decision to continue operation twist along with mortgage back securities, panic selling was seen in the bond market to be the catylst in breaking the August lows.  This move has brought the market down into this major support level to test its neckline.  Smart money that defended the highs in turn creating the right shoulder for this attempt to top have reached an area to cover part of any short positions. Should panic continue and buyers fail to step up to defend this neckline, the head/shoulder pattern completes at 13627 to fill the gap made in April within 13811-14015. Going forward, first level of upside resistance is met at 14605 being the lows from Thursday's FOMC. Thereafter, 14810-15129 is the next range of resistance being the right shoulder buyers must work through to target the highs of 15311 in squeezing out sellers and voiding out the h/s pattern.  Last month's open was 15117 with a close of 15113.  The market opened this month trading 15121, this is setting up to be a bearish engulfment for the month unless the market can manage to push back up to 15113 before the end of the month.

Continue reading
2625 Hits

SP500 1441 Done, Now What?

 ES________Weekly___Week_43_2006___Week_37_2012.jpg


The Emini SP500 front month contract switched to December today, starting the contract 7 points lower then the September contract. Yesterday the September attempted to go after the 1441 level before closing out, only to fall short by .75.  Today with the help from the news out of the FOMC, the front month ES (Dec) finally squeezed out that May 2008 high of 1441 and running through 1450s.  We have talked about this 1441 level being a target all year since the market started the year with a gap higher and ran after 1400s.  After a double bottom in summer at 1262 off the year lows of 1259.75, the market climbed higher to complete this target. The reason why 1441 was so important is this was the high the market reversed from in May of 08 before the crash that came later in the year. So moving past this level further squeezes short sellers and retraces the market to where the breakdown began. If there are any bears left in this market, now is the time to start stalking as all the late comers who missed the move are piling in. At these levels, the market still has room to run higher however we are now neutral equities and allow the market to digest this move and offer the next direction.  Bond market is looking lower so there is late money to flow into equities, allowing for longer term equity bulls to lock in profits into.  Next major upside levels in the market come in at 1468-1481 off the 1527 December high in 2007. Followed by 1556 off the 1586.75 all time high made in 2007. 


Tags:
Continue reading
3977 Hits

30 Year Bond Head/Shoulder Topping Pattern

ZB________Daily___12_20_2010___9_11_2012.jpg

The 30 year bond's consolidation above its resistance line from the 2008-2011 highs has seen the market digest within a range of 14503-15311.  The high of 15311 was made in July after an initial high of 15219 in June.  This June high saw the market pulldown to retest its resistance line turning into support. This led to the higher high in July squeezing out early shorts as the market ran into 15311.  Prices were not able to hold above the old June highs and the move above this level turned into a failed breakout as the market reversed lower in August to take out the June lows and fall down to 14503 which retested where the market broke out in May.  Since this low, the market has seen a short covering rally bringing the market back to retest the breakdown off July's highs.  The retest has since fallen short with highs of 15129 put in on the first day of trading in September.  Since this high the market has backed away and retraced down to 14817 which is now retesting the prior week lows of 14810.  This is an attempt to build a right shoulder out of a head/shoulder pattern as the market retested that failed July breakout.  Aggressive bears have already faded the move, however the bear needs a close below 14810 this week to see continue the momentum.  The target for the move is to retest the August lows of 14503 being the neckline.  This brings the market back to where it bounced in August from its old resistance line that turned into support. Should this take place, the bear will have better oppurtunity to take out these lows and fall back below this line since the market saw a squeeze in August to test the July highs in turn building a right shoulder.  X marks the spot as seen in the daily chart above.  The range of 14503-15311 gives a downside target of 13627. Completing this downside target retests where the market reversed in March within 13805-13505 as then next major downside support.  A move past the september highs needs to be seen to trap shorts and target the July high for a short squeeze. 

Continue reading
3741 Hits

SP500, US Dollar, Euro

 ES________Daily___2_23_2012___9_11_2012.jpg


DX________Daily___8_2_2011___9_11_2012.jpg


6E________Daily___7_21_2011___9_11_2012.jpg

Continue reading
1045 Hits