Chicagostock Trading

Chicagostock Trading

Return to "normal"

NQ Monthly 2023 07 9 57 42 AM

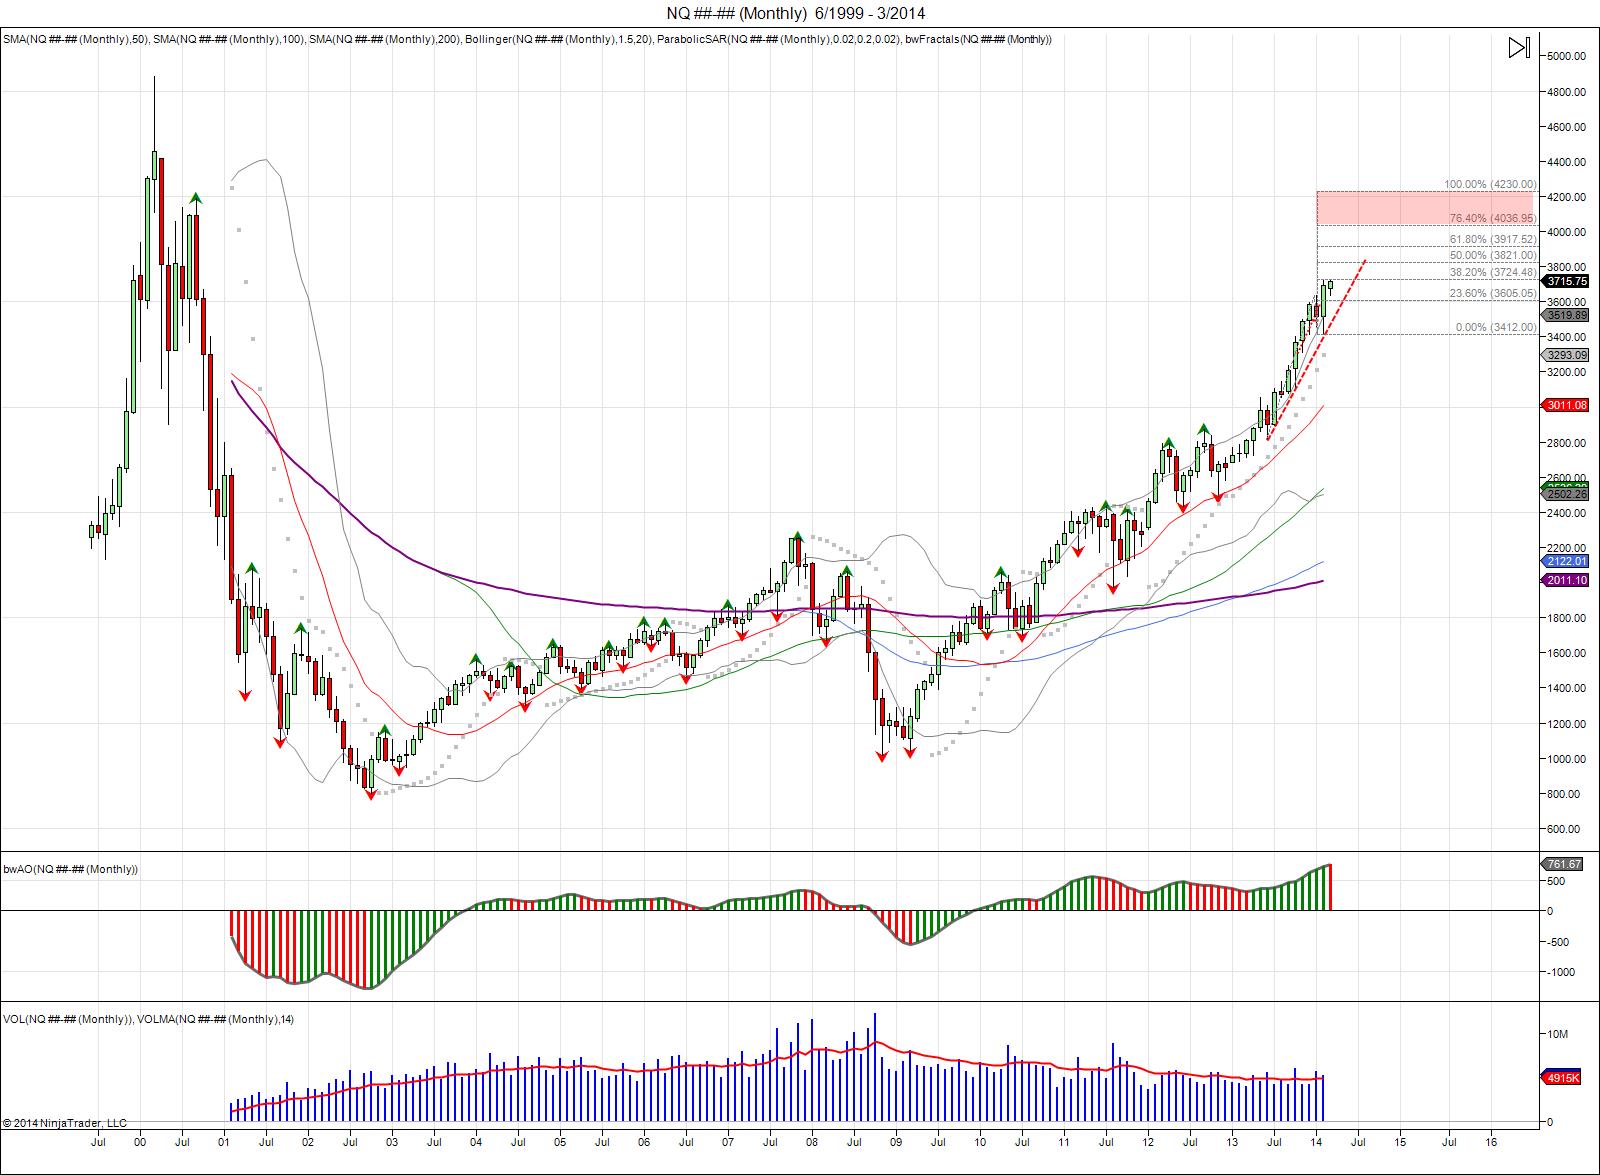
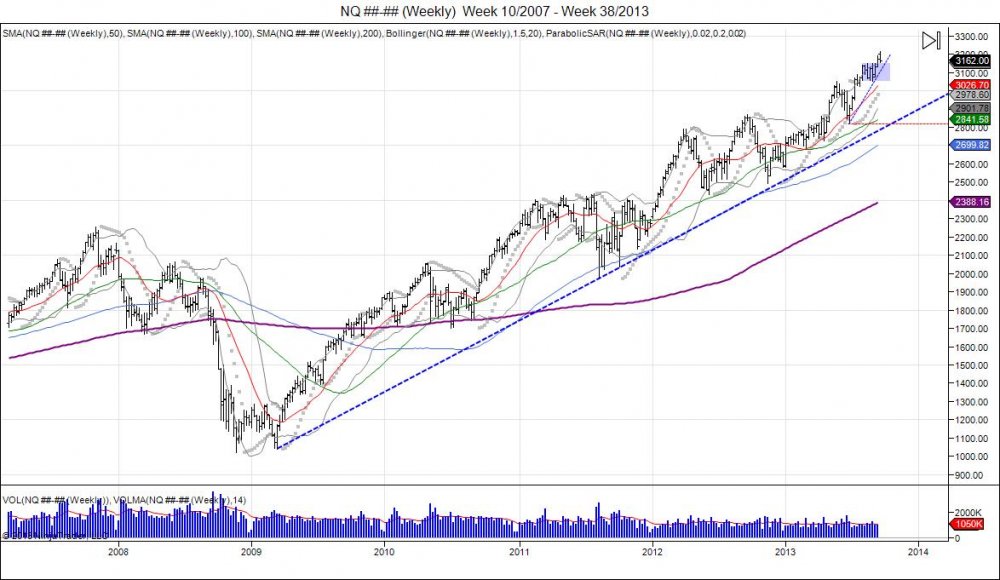
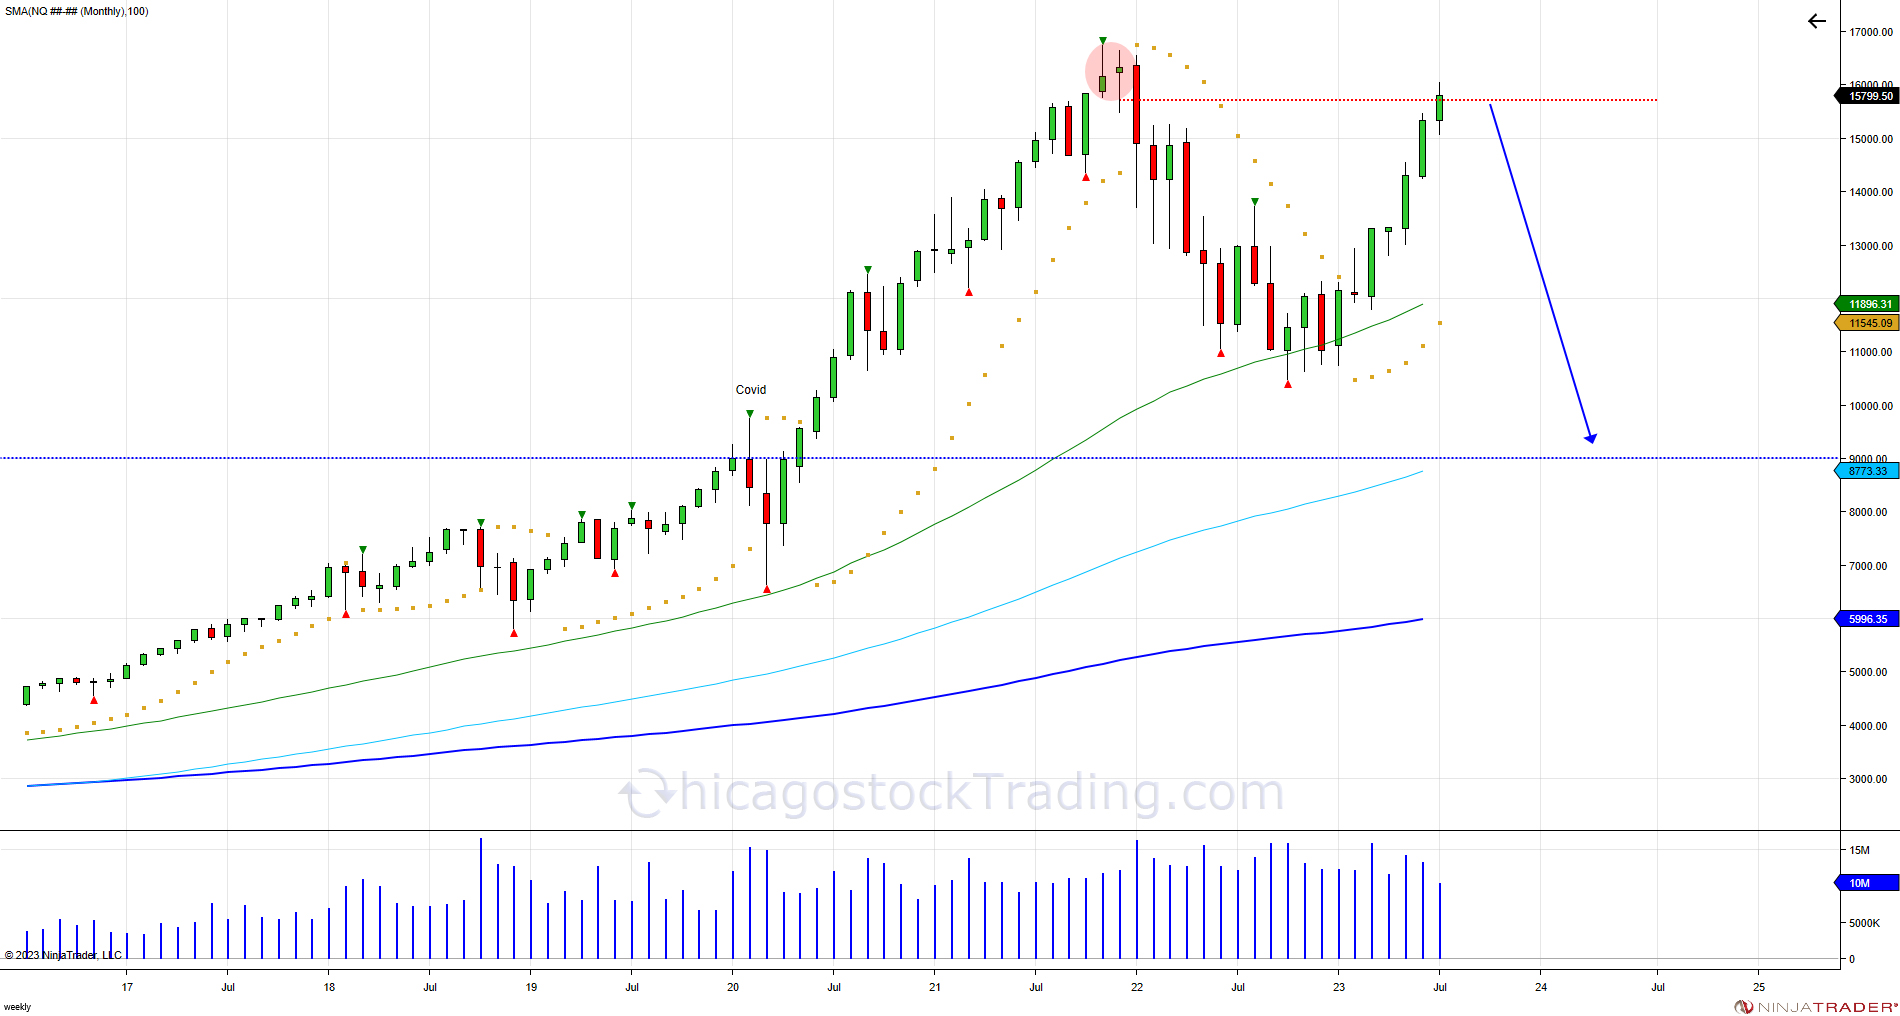
After the Nasdaq put an all-time high in November of 2021 at 16767, the market dropped 37% in the year 2022 to a low of 10484. The Fed has continued its hike program, which has raised rates to a 22-year high while signaling further hikes would be data-dependent. Investors are assuming they are done hiking interest rates. “There is belief that the Fed is probably done,” said Timothy Graf, head of EMEA macro strategy at State Street Bank & Trust Co. “Markets are also seeing a US economy that’s held up far better than the consensus outlook. They are pricing that we have achieved a landing that everyone thought would be impossible to achieve.” Meanwhile, earnings continue to beat analyst estimates. On top of that, GDP rose in Q2 at 2.4% above estimates of 1.8% and higher than the previous period of 2%, showing an expansion of the US economy.


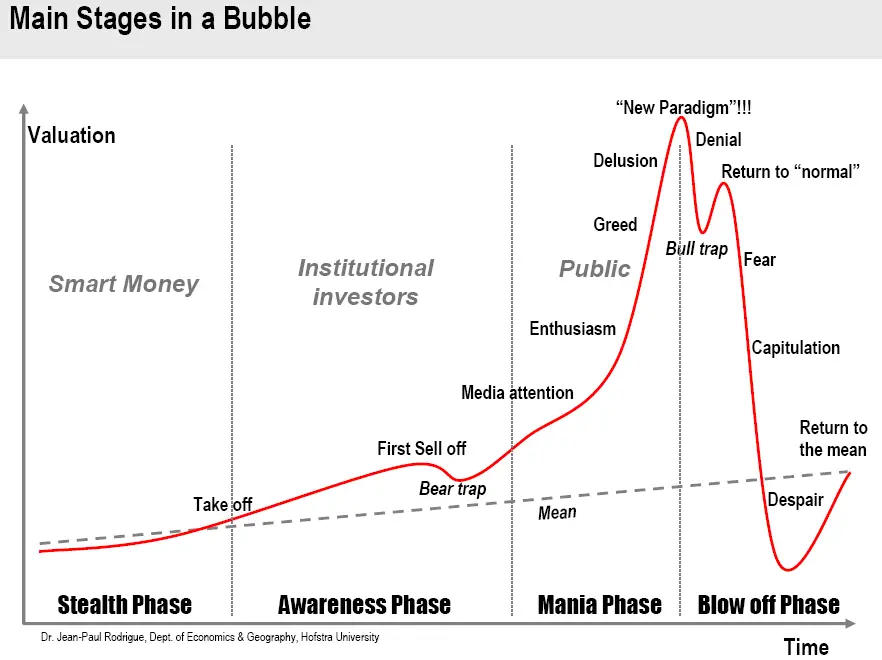
This strong data comes as the market retests the failure from November of 2021 where it trapped buyers to bring up the question, have we returned to "normal"? If you take a look at the chart on the main stages of a bubble, the Nasdaq is tracking it back to the return to normal phase. The retest of the November 2021 failure is key resistance for buyers to overcome, as well as sellers to defend, hedge, or lighten up on positions. We are at a point of testing supply and looking for demand as demand will have to keep up to continue the rally in any attempt at taking out the 2021 high.  Failure to push through and a failure at these levels can give way for another wave down that would be more fierce than what we saw last year, giving opportunity to retrace back down to retest the March 2020 high from where the market took off after the Covid breakdown. 


Image


Tags:
Continue reading
1390 Hits

Pre-FOMC Market Update


Futures, foreign currency and options trading contains substantial risk and is not for every investor. An investor could potentially lose all or more than the initial investment. Risk capital is money that can be lost without jeopardizing ones financial security or lifestyle. Only risk capital should be used for trading and only those with sufficient risk capital should consider trading. Past performance is not necessarily indicative of future results. Video content hosted by third party.

Continue reading
3218 Hits

Pre NFP Market Update Video


Futures, foreign currency and options trading contains substantial risk and is not for every investor. An investor could potentially lose all or more than the initial investment. Risk capital is money that can be lost without jeopardizing ones financial security or lifestyle. Only risk capital should be used for trading and only those with sufficient risk capital should consider trading. Past performance is not necessarily indicative of future results. Video content hosted by third party.

Continue reading
2407 Hits

RUNNING OUT OF BUYERS?

1-8-12b_1.jpg

Since reversing off the year lows of 1732 and through December's high to squeeze shorts, the SP coiled in a sideways range in attempt to find new buyers following that V shaped short squeeze.  The first peak high was made at 188750 in March on Non Farm Payroll numbers.  This was followed by a reversal down to 182350 mid March, before climbing back up to 1877 as the pullback was bought and the 6 month pivots turned into support.  Breakout attempt was seen early April, having to take the FRB chair to say stimulus is still needed to in order to trigger new buying to run the market into new highs setting up a jump ball on the NFP numbers that were released early April. New all time high were made by 5 points up to 189250, again on Non Farm Payroll numbers and was followed by profit taking and sellers pressing the market post NFP release. Both peak highs being made going into the jobs numbers that were both followed by immediate profit taking. The last high is more troublesome as new highs were made only to fail to continue higher, seeing a reversal back down to press and retest the March lows of 182350.  First test of this led to a bounce this week on the FOMC release the 6.5% unemployment target for the fed funds rate would be removed.  The initial reaction was an embracement by the market, seeing a bounce up to 1867 before running out of gas and reversing back down to close below the recent low of 183075 prior to that FOMC release.  Once again the market brushing off stimulus promises and a pull of the 6.5% unemployment rate that suggests rates can remain low longer. 

Going forward, pressure is being put now against the prior low of 182350 made in March to shake out longs and confirm a short term double top.  A weekly close below 1850 is bearish and creates a new range of resistance within 1850-189250.  Looking at the action made in 2014, with the early sell followed by the V shaped recovery that was fueled by shorts being squeezed, the market traded above those prior highs for 2 months in attempt to build a base and attract new buyers following the short squeeze. Failure to build the base and hold above the 2013 highs, suggests enough new buyers are not coming in to sustain the V reversal to expand higher.  If new buyers are not coming in, then the bus may be too full and this gives room to expand lower to target the year lows and confirm a failed breakout with major support at 1700 based off the October low.  Failure to hold the 2014 low of 1732, breaks the series of higher lows the market has enjoyed since the last major low of 1553 in 2013 when investors feared tapering before being squeezed up 300 points.  By taking out the last major low at 1732, this breaks the upward momentum, and gives room to move down into testing levels from 2013 and attempting a gap fill down to 1420.  Support off the year lows is seen down to 1750 for buyers to defend.

VIDEO: Watch Chicagostock's day trading signals on both peak highs.

Continue reading
4203 Hits

CAPITULATION LEVELS

Nasdaq futures are staging the ultimate retest as the market is now 500 points from testing major resistance of where the market failed during the dot com bubble. By taking the low of the last major correction at 281775 (May 2013), using the January high of 362525, and the last recent low of 3412 made February of this year as the market’s attempted to breakdown only to fail, this gives upside fib extension levels of where the market can lead to. Thus far we have seen the market extend 38.2% at 3724, being where and what the market is working on now. Continuation of holding above the early 2014 high of 3635, this gives room to continue the squeeze higher as shorts capitulate. A 50% fib extension is met at 3821, followed by 3858 to complete the range expansion from 3635-3412 up to 3858. MAJOR resistance is met within 3900-4230 as the top level of the fib extension, being a 100% extension of the failed breakdown this year from last year’s move up. The first test of this range, should be sold with both hands forward, as this is the first test of the dot com bubble.


Continue reading
3636 Hits

DAILY EQUITY CHARTS FOR NOV 18 2013

(click chart to maximize)

1-8-12b_1.jpg

Continue reading
2524 Hits

The American Revolution and the SP500

1-8-12b_1.jpg


The SP500 is back at pressing last month's, keeping the rising wedge of higher lows and higher highs since the May correction.  Putting the market back in the hands of sellers to defend just as a deal on the debt ceiling is made.

The last high at 172675 capitulated shorts above its previous high of 1705 as the Fed surprised the market with no taper and no Larry Summers.  This was followed by a pullback which failed to see buyers materialize inside 1680s as the gap was filled post shorts being squeezed.  Establishing a weekly bearish engulfment and eventually grinding down into lows of 1640 to test last and major support based off the 162475 August low.  Sure enough this held to see the market develop a reversal that was fueled by talks of a deal taking place on the debt ceiling. Shooting the SP 60 points back to retesting major resistance within 1710-1715 from the failed high in September.  Just as the SP tests this major resistance, Congress has struck a deal with less then 14 hours before the debt ceiling was to be breached.  Many are looking for sell the news to take place, and the test of the September highs here is the true tell as to whether buyers can continue to support prices to push through sellers now coming into defend this resistance. For the market to reject this test of the September high, a quick reversal needs to be seen to fall back below 1690 to give way to test support at 1658 based off the 1640 lows.  The longer buyers can support prices at these levels, the more pressure to squeeze out the September high and put in another higher high.  Should this take place, we see next major resistance levels coming in at 1740 as a 76.4% fib extension, and ultimately 1776 as a 100% fib extension.  Keeping in mind the May high at 1685 that led to the biggest correction of the year was also a 100% fib extension.  This would be ironic to see the market reach for this number, the year of revolution/America's birth, just as Congress' approval ratings drop to all time lows and they continue to kick the can down the road with no real solutions on cutting spending or the debt.

Continue reading
2700 Hits

SP500 & Nasdaq Back to Bottom of Rising Wedge

1-8-12b_1.jpg


The struggle to top since the first correction in May from 1685-1553, being the most violent of the year, led to higher lows and higher highs as new highs squeezed shorts and every dip became more and more shallow. Buyers continued to pile into these dips making them more shallow, afraid of missing "the next leg up". This recipe is what makes the rising wedge, and a recipe for disaster as bulls and bears make money, but hogs g slaughtered. Thus far the surprises from the Fed on "no summers" and "no taper" have held as the highs as shorts capitulated into 1726s and market gave it all back the following week. Bulls have another opportunity to make a higher low here as the market comes into this support line from the June lows. Failure to hold the August lows of 162475 break the wedge to give way for a test of the June lows to confirm the failed higher high up to 1726.


1-8-12b_1.jpg


Nasdaq chart shows breakout above rising wedge to squeeze shorts and move back inside wedge to retest support.  This can lead to a water fall effect with confirmation of top on a break of 3055.

Continue reading
3094 Hits

Nasdaq's Rising Wedge

1-8-12b_1.jpg

After running through 3050 in July, Nasdaq continued its run into August printing early highs of 3150 before falling back to 3050.  This led to a failed breakdown as the market found support at it's old resistance and turned the month of August into a consolidation month with a range of 3050-3150.  To start September, the pressure was put against the tops at 3150 which eventually gave, seeing the Nasdaq future trade up to 3213 today.  The gap open higher was above its rising wedge which led sellers to come into take profits and bring the futures back down to fill the gap from last friday.  This rising wedge should be taken with caution as the market presses the tops and the wedge tightens.  Going forward, 3150-3050 is new range for Nasdaq to hold to continue the upward momentum. To continue this range expansion of 3150-3050, this gives room up to 3250.  Line in the sand comes at the August lows just below 3050 as a break below this shows the market failed to hold the consolidaiton range and turns the breakout above 3150 as a failure. Major downside support seen within 2920-2870 with stops below the June 281775 low as a breach of this low sees a break of the 200day and a shift in trend momentum. Based off Monday's 3213 high, 3196 is a new level of resistance off these highs.


1-8-12b_1.jpg


Tags:
Continue reading
2490 Hits

Bonds, Stocks, and the YEN


ZB________Daily___3_13_2012___4_28_2013.jpg

The 30 year bond has consolidated above 14617 in an effort to hold above the year highs after seeing a massive short squeeze that reversed the market from the year lows of 14014. Squeeze was fueled by shorts as the market broke below the February lows on the March NFP release to put in these lows, the market saw a recovery the following Friday going into the "Cyprus bailout".  Cyprus news led to gap above 14200 turning level into a failed breakdown as market continued to force shorts to cover until the year high was taken out. The move caught many off guard and in turn cleared out shorts in the market. By holding above 14617 the market now tries to build a base of support to attract buyers that neglected bonds for stocks earlier in the year.  The market sees major resistance against 14923. Taking the range of 14617-14014, gives way to push toward 15221 high from November.  Just as the Yen tries to target its November gap.   


  6J________Daily___8_28_2012___4_28_2013.jpg


Yen and SP500 show almost exact contrast comparison.  As Yen tries to double bottom in April, SP500 is trying to double top.  The Yen made lows of 10008 and 10013 before squeezing through 10158 last week.  This level has turned into a new area of support should the double bottom be good. Holding above 10150 gives room to force shorts to cover to give room to take out April 15th's 10383 high with next major level of stops above 10809 from April 2nd highs. Above 10809 confirms double bottom against 100 to give way for a massive short squeeze to target the year highs at 11531 and give room to fill last November's gap at 11790. During the past 4 years the Yen has had a tendency to bottom during the Spring months. 


ES________Daily___6_18_2012___4_28_2013.jpg

In contrast the SP500 has a small double top as market most recent reversed from 153075 to retest 1593 by making a high of 158825.  As the market hits it's head against this resistance it has managed to hold above 1570 to create a very tight trading range. Move past 1588 is needed to retarget 1593 for stops.  Break of 1570 gives way to test support at 1555 based from the 153075 pivot low.  Taking out this low would confirm the double top to give way to cross the "line in the sand" from the Cyprus lows of 152950 which have held like a rock.  This is line in the sand, just as 108 is the line in the sand in the Yen and 14617 was in bonds.  In contrast to the Yen with the gap at 11790, the SP500 has a gap down to 142575. 

Continue reading
3389 Hits

Major USD Reversal No One is Talking About


US DOLLAR:

DX2_25.jpg

The US dollar is one of the most important, yet least discussed chart of the year.  Noticing the dollar's break below 79600 late January, early February, only to establish a bearish bias and lure in shorts before turning around higher. The market has held above its reversal window, thus reversing the bearish bias which has led the market to take out its year highs of 8100 set early January.  This U turn is having a major effect and pressure on commodity markets as the USD failed to break lower and is trading on new highs for the year. Take note of the gold chart how it is completely opposite of the dollar chart and is an upside down "U" from the beginning of the year.


ES________Daily___3_14_2012___2_25_2013.jpg


Click charts to maximize

Continue reading
2714 Hits

SP500, Nasdaq, and Apple Video Analysis

Continue reading
3910 Hits

The Ultimate Short Squeeze 665-1441 & Accurately Predicting Every Correction Using Technical Analysis


Since the all time highs of 1586.75 set October of 2007, the SP500 corrected into lows of 1255.50 early 2008 with Bear Stearns bankruptcy.  A short squeeze was seen up to 1441 in May of 2008, only to reverse and fall into lows of 1373.50.  This reversal led to a summer decline that took out the years and set up a shaky market going into the fall. As September began, the SP500 made highs of 1303.50 only to reverse and cause a spike in the Volatility Index.  This reversal ultimately led to the crash as the market fell into lows of 665.75, March of 2009.  Since this low, the market has channeled higher on glass stairs as it has gone through few major shakedowns however managed to continue the squeeze and retrace 100% of the breakdown from 1441.  Below are the corrections seen during this move.

Click charts to maximize. 

SP500 sets highs of 1216.75 before stalling to create a head/shoulder topping pattern projecting 1136.75. Ultimately seeing a flash crash with a quick move to 1056 before coming back to the 1130 level. 


2010 SP500 Head/Shoulder Topping Pattern Completes 1136.75 and sees Flash Crash to 1060s:

Continue reading
17934 Hits

Nasdaq Market Update

 NQ________1440_Min___11_8_2012.jpg


Non Farm Payroll Dates:
09/07/12 - Highs 2836.25
10/05/12 - Highs 2840.75
11/02/12 - Highs 2694.00

The daily Nasdaq chart above shows the importance of the last 3 Non farm payroll dates.  The September NFP number marked the left shoulder that was created with highs of 2836.25.  A small pullback was seen off that high down to 2777.75. The market early sellers by taking out this NFP high and ran into 2871.75.  The move into this level failed as a flat top was made and the market fell to take out the previous low of 2777.75 that led into that high.  The breakdown shook longs as the market was digesting the latest QE news.  Not quite ready to break down, another squeeze was seen to retest the 2871.75 highs where the market hit 2840.75 on the October NFP number.  The test of the highs created a right shoulder for a head/shoulder topping pattern as the market broke lower to take out the neckline of 2762.25.  From this level the market moved to expand and complete this head/shoulder pattern by falling into the 2650-2600 range.  Since falling into this the market went into consolidation in attempt to hold this support as the move was digested.  This led to highs of 2694.00 on Novembers NFP number just before the election.  As the election passed, this high was tested and failed, and the downside momentum and chase has continued int he market. This chase is taking place as buyers who missed the August rally higher are coming in to buy the dips only to see the market fail to give an uptick and press down which uses these buyers to sell into as well as squeeze out.  

Looking at the monthly chart below we see this correcting 10% thus far of the 1017.75-2871.75 rally over the past 4 years.  This correction since the failed highs in September and reversal in October has the market now testing the breakout range in June within 2433.75-2628.25.  This is major support for the upside momentum. A target of these lows squeezes shorts and attempts a head/shoulder top formation based off the reversal off the highs and down through these lows. This gives an area of major support as it retraces the market 23.6% and an area to see short covering as well as buyers step in to attempt a retest of the September range. Failure to push the September range sees a right shoulder build followed by a target of the 23.6% neckline again. Breach of the neckline then gives room to expand this range which gives room to the 50% retracement level down to the July 2011 lows of 1972.25.  This is all premature, and what we are seeing now is the chase trade that is targeting the 2433.75 lows from June of 2012.  Breach of these lows confirms weakness in the market and an area for buyers to step in as well as sellers to await a retest of the September range.


Click charts to maximizeNQ________Monthly___2_2003___11_2012.jpg


Nasdaq's 2012 Daily Head/Shoulder Creation

Tags:
Continue reading
4223 Hits

Nasdaq Thanks Current Administration for a 182% Gain

 NQ________Monthly___11_1999___11_2012.jpg


Since the last election in November of 2008, the Nasdaq has risen 182% off the lows of 1017.75 to highs of 2871.75 set just last September.  This 182% increase in 4 years, matches exactly the same amount it rose from 797.50 to 2256.25 within the time period of 2002-2007.  The market corrected after this gain from 2002-2007, falling back to retesting the lows set in 2002.  The test came during the time of the last election in 2008 as the market fell to 1017.75 following the crash of 2008 and found support based off the 2002 lows.  Since this last election and lows, a slow short squeeze and grind higher has taken place, through the 2007 highs and retracing back to where the Nasdaq failed in the dot com era at the 2900 level.  The market fell short of the 2900 level by about 30 points before reversing in October down to 2604.50.  An attempt to test the September high of 2871.75 was seen during the October Non-farm payroll numbers as the Nasdaq rallied to 2840.75 and reversed lower as it failed to move past the September highs. This in turn built a daily head/shoulder corrective pattern that targeted the 2650 level. This small corrective pattern completed in October down as the market fell into its support range of 2650-2600 based off where it broke out to the highs in August.  Going forward, the small corrective pattern is over, however on a longer term picture as we look at the monthly chart, we see this small corrective pattern as a road block going forward.  Based off the longer time frame the September range of 2736-2871.75 now offers a new area of major resistance for the market to work through to regain the upside momentum. Until then, rallies up to this level offer an area for longs to take profits, protect longs, and or short the market.  There is a chance the market fails to test the level as the market is in a downside chase having caught buyers off guard by the reversal and not giving an opportunity to gain on their most recent purchases. Continued pain and chase sees the market falling down to take out the 2433.75 low made in June, to squeeze out these buyers who have been trying to participate in this decline over the last month.  By targeting the June lows, the market squeezes out these buyers and gives opportunity to establish a neckline for a short squeeze to retest the 2736-2871.75 level. This retest of the failure in September gives opportunity for buyers to show their strength by squeezing through and for sellers a level to defend to build a right shoulder for a larger head/shoulders topping pattern based on the monthly chart.  There have been many programs established over the past years to keep the squeeze in equities afloat, the most recent one was the biggest with the Fed coming out with Quantitative Easing without an end date.  This announcement came at the highs and gave the final push in the market up to 2871.75. Thus far it has failed to hold up. Here we are one day before the next election is voted on and the market is in a corrective phase. Regardless of the outcome of the election, we must take caution of October’s reversal as the market is now in sell the rally mode, until a move past the September high is seen.  For buyers and sellers, it is wise to sit on hands as this month of November offers more data to be used. Buyers should await a move down to the June lows to defend, and sellers a test of 2736 to defend.  Ultimately, should the market build this head/shoulder top on the monthly chart, this gives a projection down to the 1900 level to coincide with the August 2011 levels and the 50, 100, and 200day moving averages. During the last 4 years, the stock market (Nasdaq) is up 182%, US government debt per American under 18 is up 53%, the national debt up 52.6% and unemployment has risen from 6.8% to 7.9%.  Looking at these numbers, it appears the past 4 years favored wall street over main street. 


Continue reading
3480 Hits

SP500, Nasdaq, Midcap Daily Charts

 ES________Daily___3_12_2012___10_16_2012.jpg


NQ________Daily___3_12_2012___10_16_2012.jpg


EMD________Daily___3_15_2012___10_16_2012.jpg

Continue reading
3458 Hits

SP500's Double Top, Nasdaq's Head/Shoulder

 ES________Daily___12_22_2011___10_12_2012.jpg


With the SP500 completing its 1441 target coined earlier this early, along with the double bottom made in summer that also targeted this, highs of 1468 were made in September as the short squeeze above the level took the market into this next level of resistance.  The market saw a small pullback off the highs and found support off a small trendline based off the August 2nd pivot lows and through the September 4th lows.  Not quite ready to break down, the market grinded higher to retest the highs made in September.  With the non farm payroll numbers released on October 5th, the market squeezed through 1460, stopping out weak shorts, yet falling short of the 1468 high by 2 handles at 1466 and quickly seeing a rejection during the day.  This rejection continued this week as the market saw this as a failure and a potential to double top.  With the breakdown seen this week that led the market to take out the trendline from the August2-Sep4 lows, this confirmed the double top and now targeted the 1424 pivot lows made on September 26th prior to double topping.  As the market is now working itself through this area of support, next major support comes in at 1410 based off the 1394.50 pivot low made on September 4th, and ultimately sees next major support at 1385 being where the market broke out early August to establish the bullish bias for the second half of the year. This fills the market back to where it broke out during the summer as many coined as a "light volume" rally, and most missed the move higher.  This gives the ultimate level for the market to base out for the year and see if buyers step up at these levels to support the market after squeezing out all these late buyers who have come into the market chasing above 1420.  The 50day moving avearge is being tested here. For this week the bear mission is to close the market below last week's open of 1432.75 to establish a bearish engulfment on the weekly chart to project more weakness going into next week.  Doing so sees first level of resistance at 1427.75, followed by 1451.25 being the lows off the failed 1466 high and the range buyers must work through to regain momentum. 


ES________Weekly___Week_20_2007___Week_41_2012.jpg


Continue reading
5393 Hits

Nasdaq + Euro

 NQ________Daily___3_16_2012___10_5_2012.jpg

Last month, the Nasdaq future made a higher high of 2871.75, just before reversing to take out the 2775.25 lows made just before that high. The market made lows of 2762.25 on September 26th. Not ready to break the September lows, the market grinded higher off this late September low into retesting where the market failed from the highs. This retest was touched today on the NFP number with highs of 2840.75. This put the market right into the hands of sellers to defend the failed September high, and looking for a right shoulder to build on this failure.  Thus far the market is trading on its lows and giving these sellers oppurtunity to take a portion off as this is being reversed the same day.  Going forward, buyers must work through this 2840-2872 resistance to squeeze out this head/shoulder pattern attempt and stop sellers.  Sellers must look for a move down to the neckline now of 2762.25 to confirm this pattern and allow for another level to take a layer of shorts off.  Continuation of the pattern is seen should the market continue to see sellers below the neckline which gives a downside target of 2652.75, retracing the market to where it broke out early August. 


Continue reading
12008 Hits