Chicagostock Trading

Chicagostock Trading

How the 30 Year Front Ran QE2-QE3-Taper

1-8-12b_1.jpg


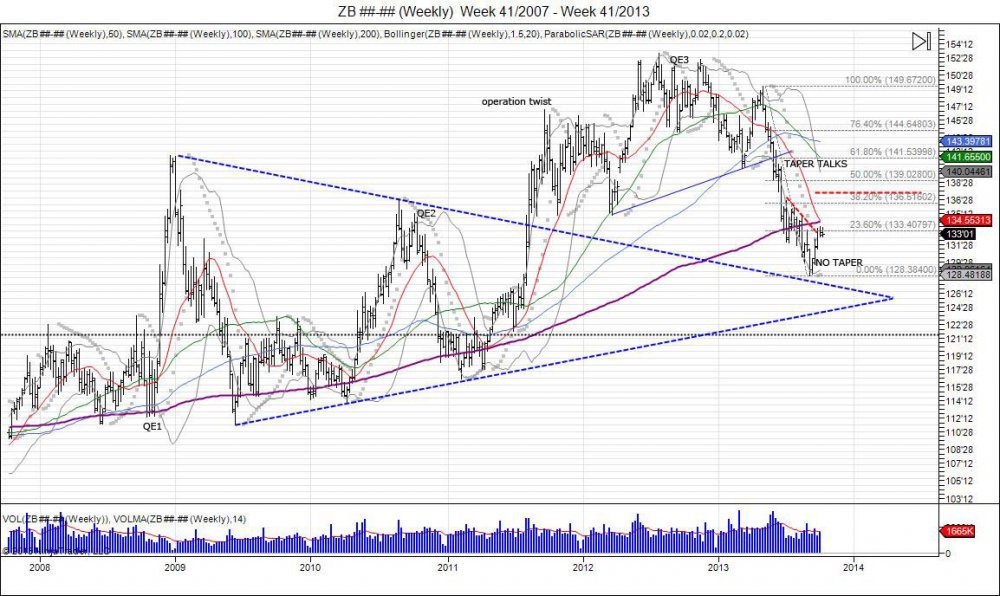
As seen in the above chart, every move regarding QE was front run by the bond market, with the exception of the 1st QE in 2008 that pumped bonds from 112 to 141. When QE2 was announced the market moved lower, from 135s to 116s. September 2011 "operation twist" was announced, with the market having front ran the news 30 points higher to 147.  This eventually led to a period of consolidation as the market dropped to 136 before running up to new highs of 152 just in time for the announcement of QE3.  Another pullback was seen, down to 140 as the news was sold.  With talks and rumors of tapering QE in 2013, this accelerated the downfall into lows of 128, below its 200day weekly moving average.  In September 2013 the Fed surprised the market by not tapering QE.  This led bonds to unwind and squeeze shorts, reversing from 128-133, back to retesting major resistance at the 200day moving average.  The reversal and squeeze of shorts gives new buyers an area to defend down using the lows below 128 as the exit.  Objective would be to retrace 50% back to 13900. If the bond market did get oversold as it got ahead of itself expecting no tapering, then the retracement seems reasonable, maybe even to front run another meeting of no taper or even increase of purchases.


1-8-12b_1.jpg


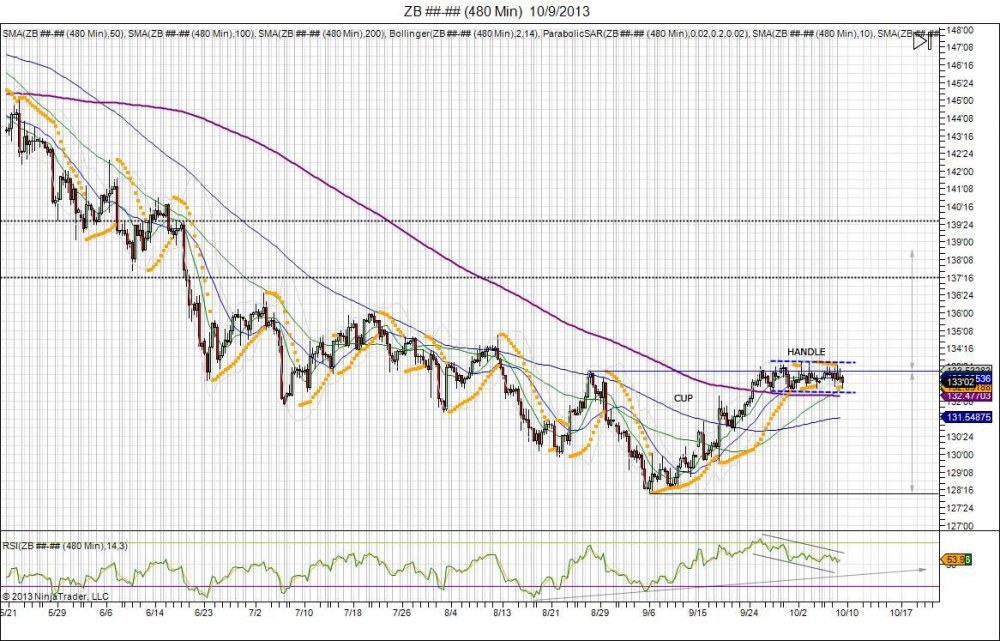
As seen in chart above the 30 year recovered its highs of 13316 from August 27th, rounding out a bottom.  This reversal back through this high was done by the surprise of no taper and shorts being squeezed. Over the past 2 weeks the market traded sideways in attempt to consolidate the reversal and build a base for new buyers to step in.  The longer the market holds above 133 the more of a base it builds and shorts it lures to force a squeeze.  New buyers have to step in to build this base for a breakout to expand the 133-128 range.  This expansion of 128-133 that shorts were squeezed from, gives room for new buyers to target 138-138, also a 50% retracement of the bond market from the May 2013 break down. First downside support seen at 13130 based off 12812 lows. Failure to hold lows shows a failure by buyers to step in with next major support at 12630, 12100.

Continue reading
2838 Hits

SP500 Maxes 100% Fib and Reverses

ES________480_Min___5_23_2013.jpg

As soon as the SP500 hit its 100% Fib extension level of 1685.50, sell programs kicked in as the SP500 printed highs of 1685.75.  The move occurred after a squeeze through previous highs of 1673, seeing shorts capitulate which gave way to the 1685 print.  Smart longs sold into this bid to take profits. With longs taking profits, shorts already being stopped, the market fell down to retest its open. After trying to retest the highs and failing to find buyers at 1681, the market fell off to take out its session lows to reverse the intraday trend as more longs locked in profits and short sellers sat on the sidelines looking at the market drift lower.  With shorts out the market, this created a chase to the downside into 164650 to retest the pivot low of 1646 made last Thursday prior to Friday's move into 1665.75. A 40 point rejection off the top level of 1685 and a press to test the downside resistance range at 1656 to see if that old resistance acts as new support for a retest of the mid level at 1666-1670.  This has raised the stakes for bears as the range to defend has widened.  Failure to hold 1646 sees more shorts left on the sidelines and a wider range (40) to defend the high.  Market remains in its 5th wave that began on the breach of the old 1593 highs with a pivot low of 1530.75 occurring during the "4th" corrective wave.  As market moved past 1593, buy side chased and shorts squeezed from the 1593-1530 giving way into 1656.  Sell stops have built along this wave 1530-1685 below 1646, 1620, 1607, 1570.75, and ultimately the 1529.50 low from Cyprus.  Wave 5 ends on a breach of that pivot low that began the wave at 1530.75.  With that taking place, a confirmation will then be made that the move above 1593 was a failure and an "abc" corrective pattern can be seen should the market be able to bounce after breaking 1530 to retest the 1600 level and see if it can get back above. 

ES________Daily___12_21_2012___5_23_2013.jpg

See: "SP500 Wave 5 How High Will It Go"


Continue reading
3648 Hits

Reversals of the Year

 dx3_1.jpg

Continue reading
3439 Hits