Chicagostock Trading

Chicagostock Trading

The Reset and Squeeze of 2020

ES Daily 2020 12 30 12 19 10 PM


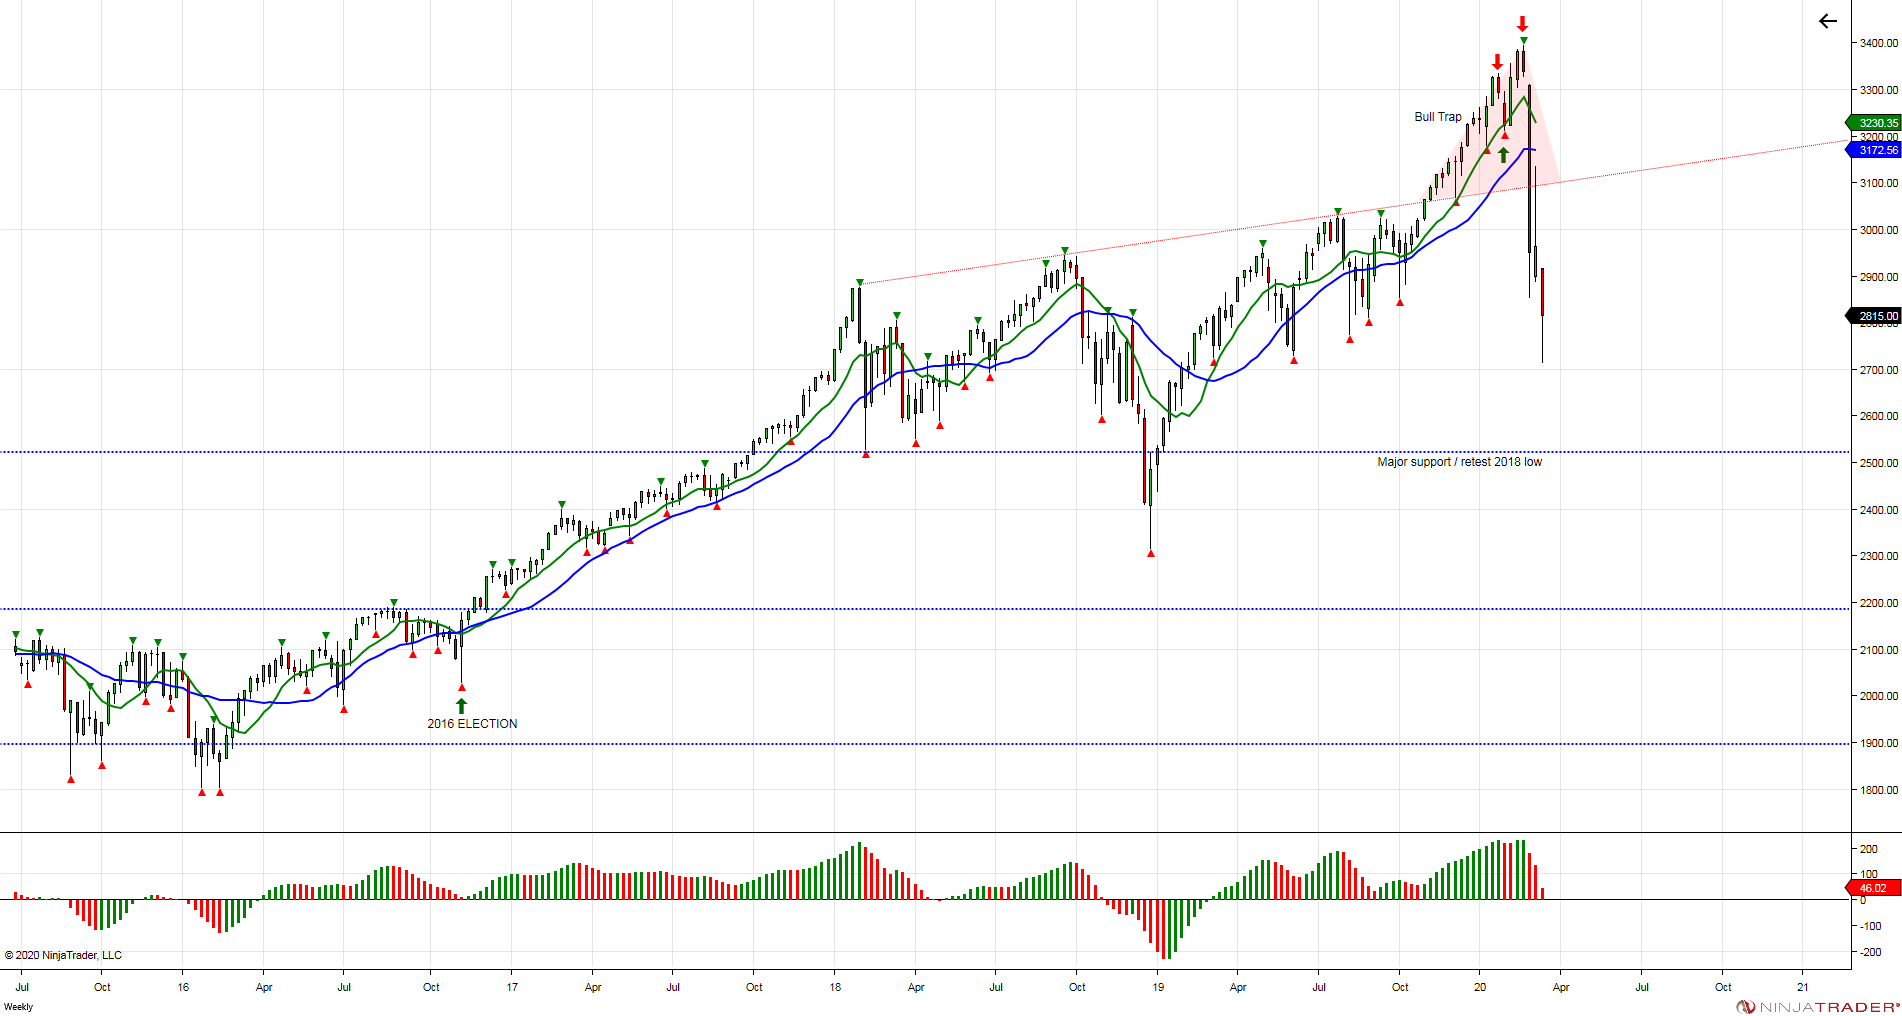
Before politicians or anyone began to talk about "The Great Reset", we titled our article from March 22, 2020 just that.  It was based on the fact that the upside chase since the 2016 election had created a trap in February that was popped by the coronavirus pandemic and fueled lower with longs being forced to liquidate.  The move, dropped the market right into a low of 2174 on March 23rd, resetting all of the gains from the 2016 election and retesting the breakout which provided longs a key level to defend to prevent further losses. 

Things were looking grim.  Coincidentally just when the market reset all of its gains from the 2016 election, the market found its bottom, as bearish sentiment reached a peak and the Fed initiated more programs to support the market.  Technically the 2170 level provided a bounce, however the support from the Fed provided the opportunity to bounce back, and using shorts as fuel to squeeze the market back higher.  On March 23rd they lifted the cap on their asset purchases from $700 billion to unlimited.  They also announced a $300 billion credit program.  
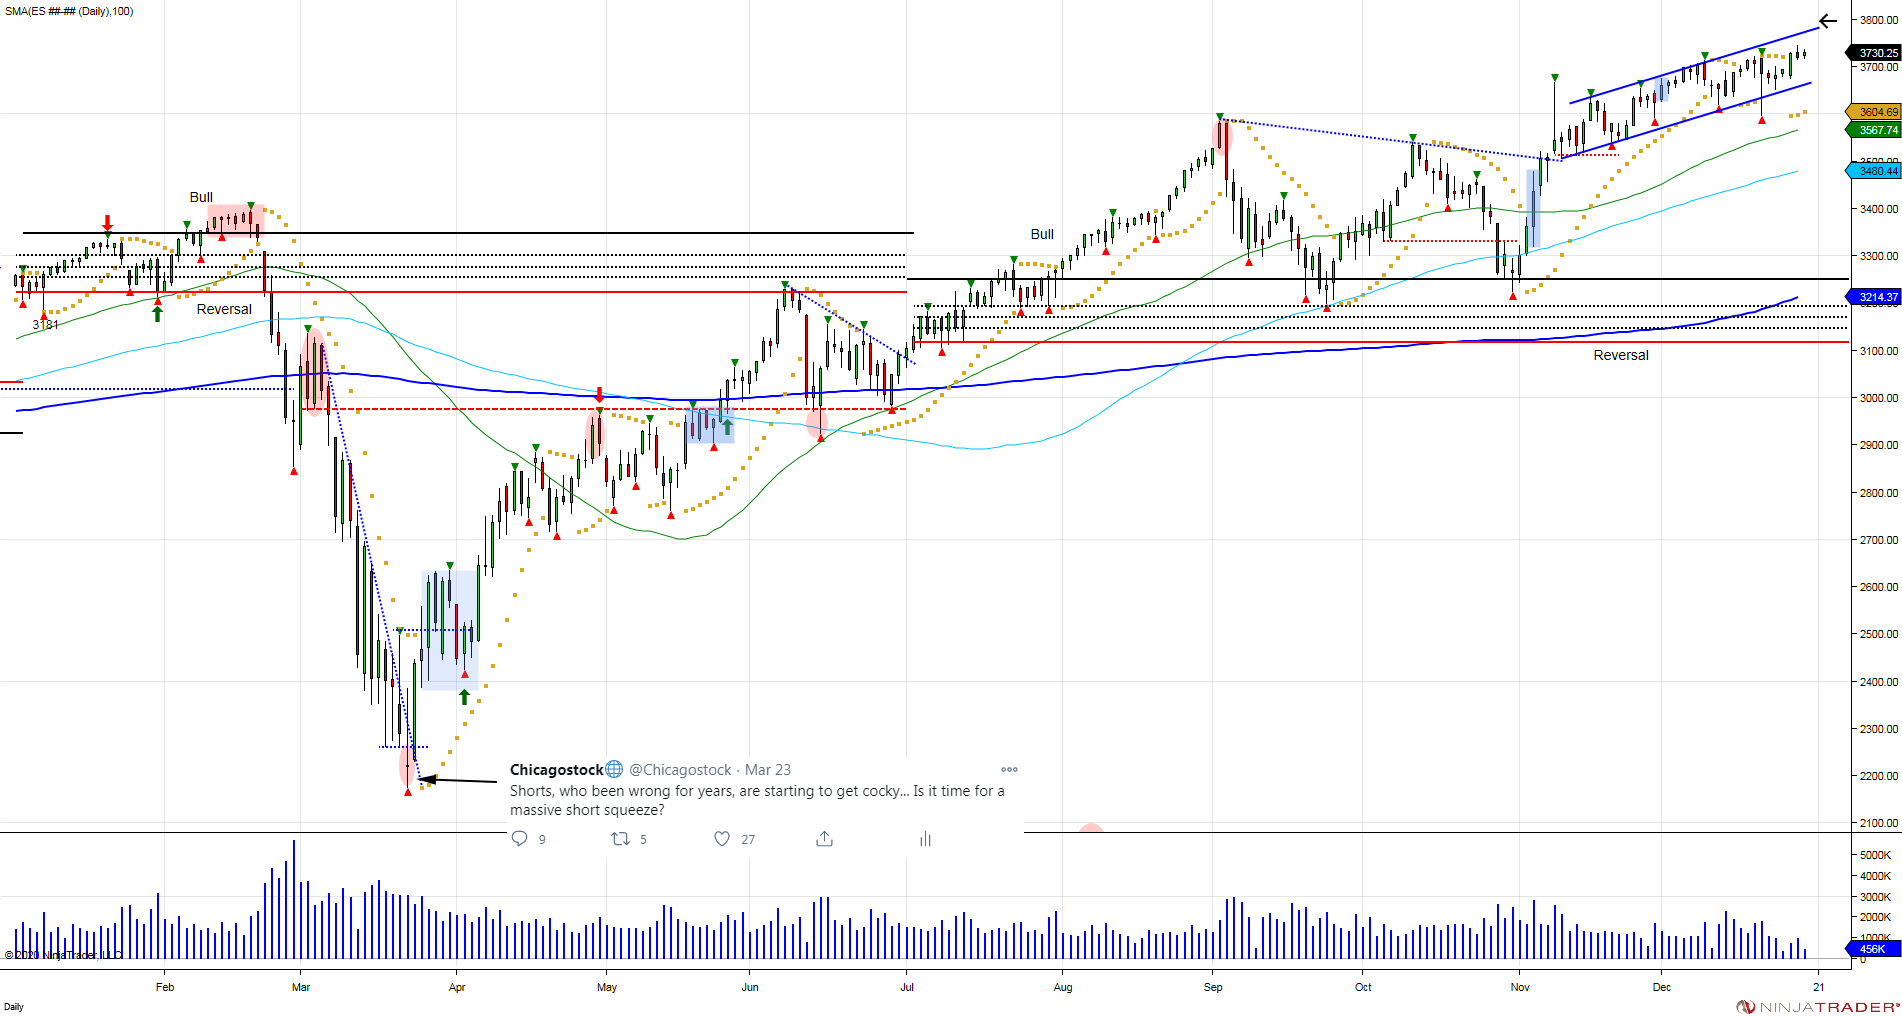
The probe below the prior week lows of 2260 failed to expand, luring in shorts below into a low of 2174 before recovering 2260 to trap shorts and setup a shrot term failed breakdown.  This failed expansion lower forced shorts to cover as sellers lifted and the market bounced back to 2600.  

This was a defensive bounce and short squeeze which led up to the Fed announcing a $2.3 trillion dollar lending program in the beginning of April that held the market maintain its bounce and work its way higher.

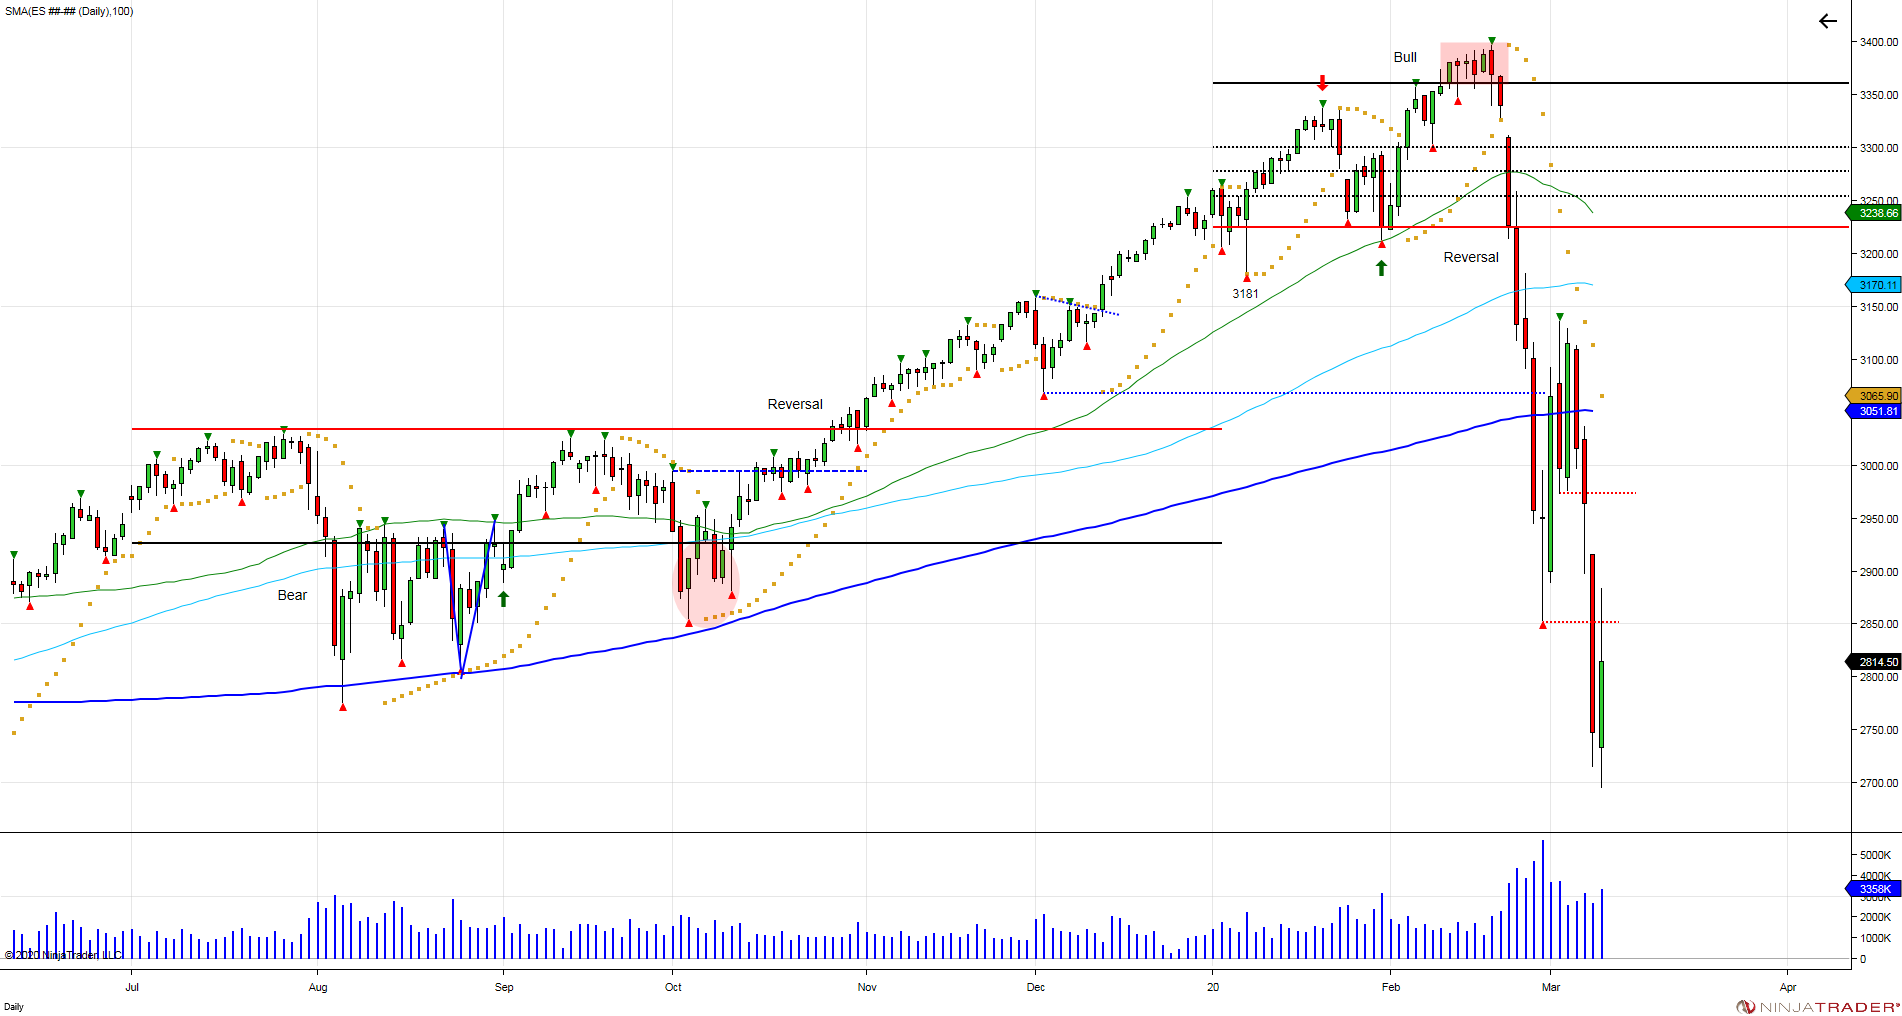
By the end of the 1st half the market had retraced all of its losses back to retesting where the bottom fell out at 3225 which was the 6 month reversal window after the bull trap was set earlier in February.  

The 2nd half of the year provided new 6 month volatility windows with the first 2 weeks of July being the opening range that set the tone for July-December.  July saw the market press against 3235 only to see buyers step up in July to break above the 6 month volatility window at 3250 which was set by July's opening range.  By holding above this window, a bullish 6 month bias was established, which saw the market squeeze into new ATHs, recovering the February high, to 3587 on September 2nd, before retracing to retest the vol window at 3250.  Retest of the vol window was defended to keep buyers in control, which was followed by another test in October that also held up.  So long as the market is above this window, buyers that bought the market above are in control and have opportunity to expand the market higher.  With the election of 2020 being out of the way, the market continued higher.  Positive news on COVID vaccine on November 9th  started a new wave higher, forcing longs to chase into new highs as the market created a bullish channel that is being expanded into the end of the year, following through on the bullish 6 month bias that was set in the 2nd half of the year.  

Chase creates risk, as we saw in early 2018 and 2020.  Going forward, as we close out the year of 2020, the new year brings us new opportunities and windows.  The first 2 weeks of January is considered the opening range which can set the tone for the 1st half of the year.  The opening range will also establish 6 month volatility windows above and below the market.  The windows provide the market an area to trade within, or overcome to establish a bias (bullish or bearish) to trend, or become traps if buyers/sellers fail to expand.  In order to establish a bias, 5 daily closes above a window are needed.  Once a bias is established the other side turns into a reversal window.  We like to use these windows to look for trends. We also like looking at the windows to create potential traps, as we saw in early 2020.  Most of the gains came in the months prior November and December, so the break above the upper vol window in February lured in late buyers that failed to expand, thus creating the trap which saw the reversal window at 3235 fail to hold, which forced longs to liquidate, accelerating the downside.  

With the 2nd half of 2020 closing on the highs of the year, the start of the new year will show us if the market can expand on these gains or attempt to correct in search for support lower.  Shorts have been grinded out since the March lows, but also recently since the vaccine news which has also lured longs forced to chase above the September high. Going forward, the low from the vaccine news in November at 3500 is key as losing this would put pressure on retesting the November election and low of 3243.  


dx1230

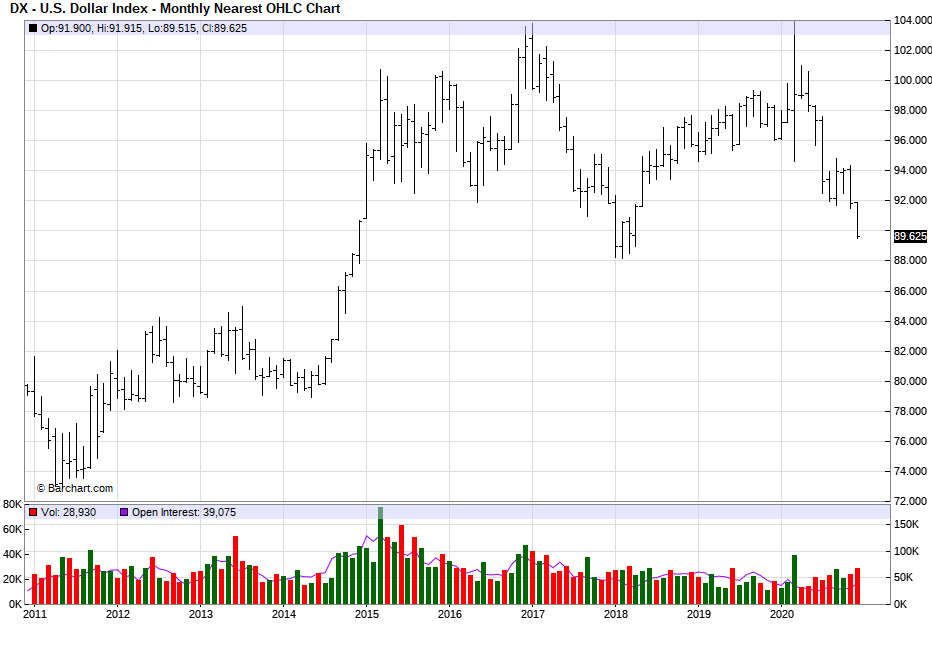
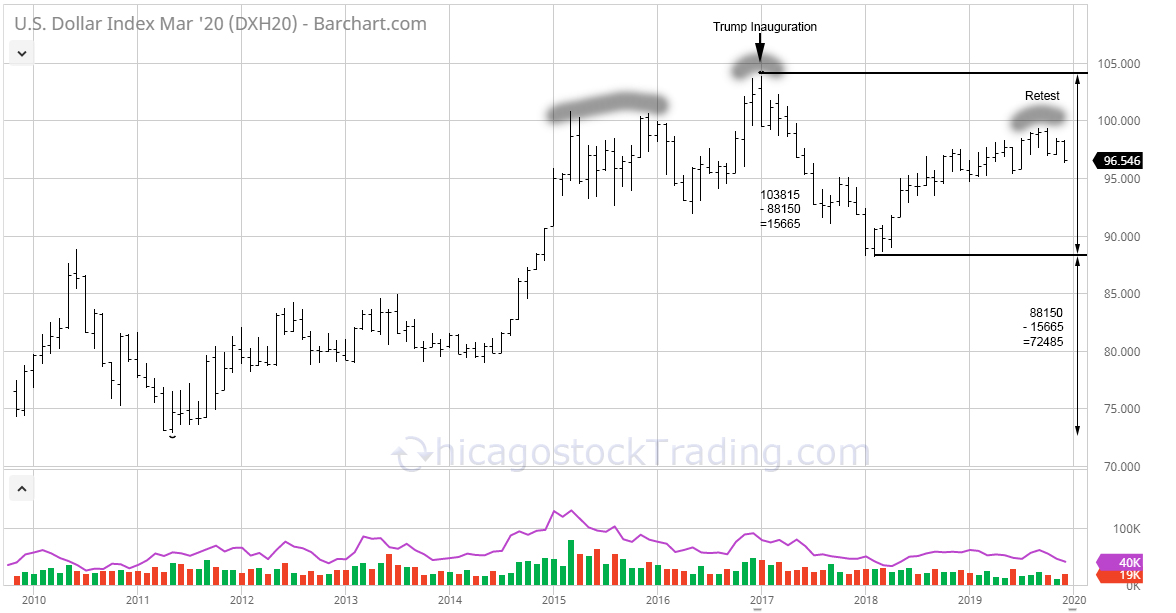
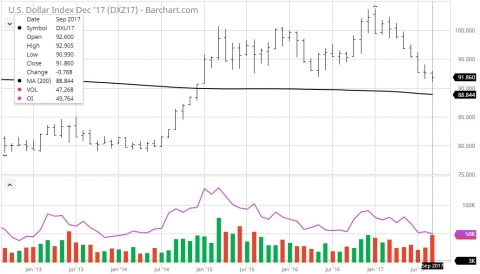
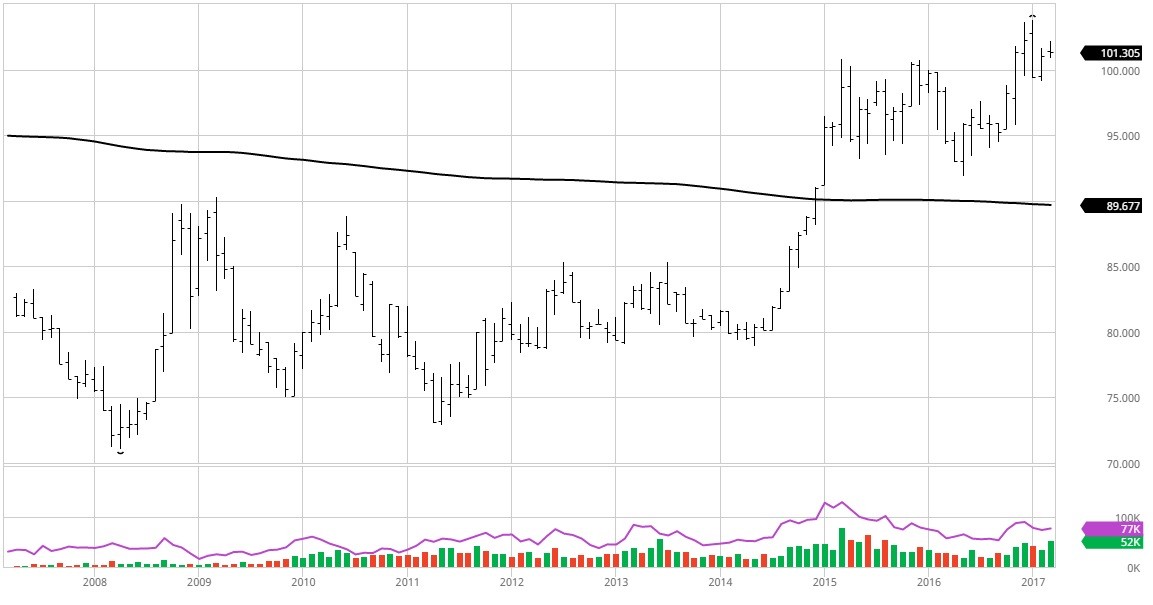
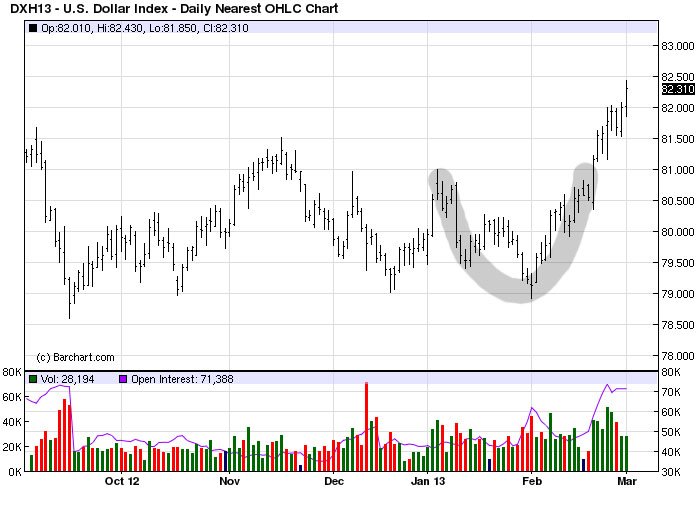
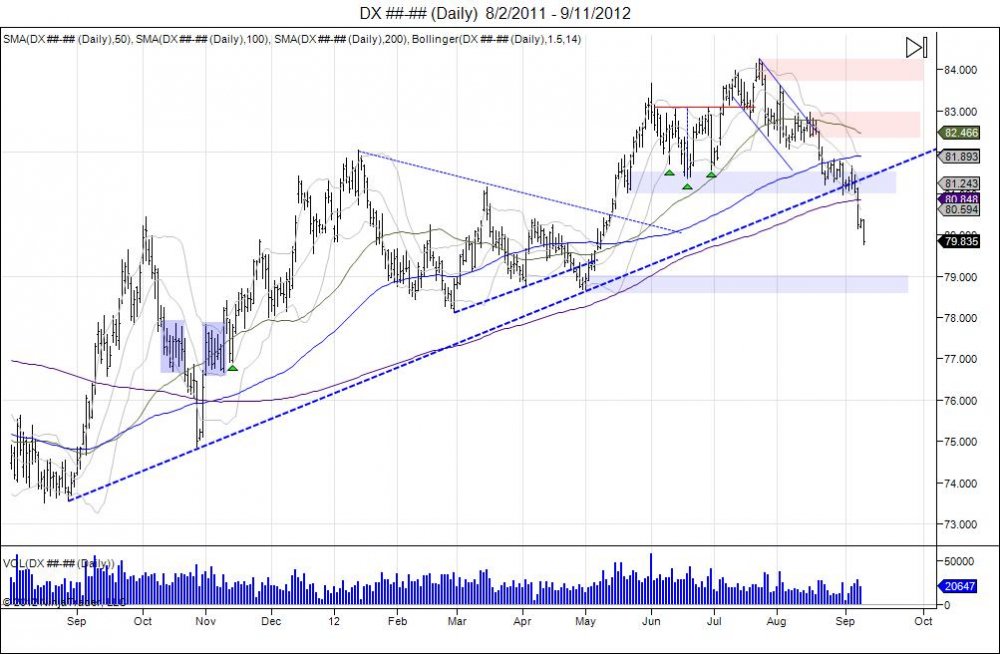
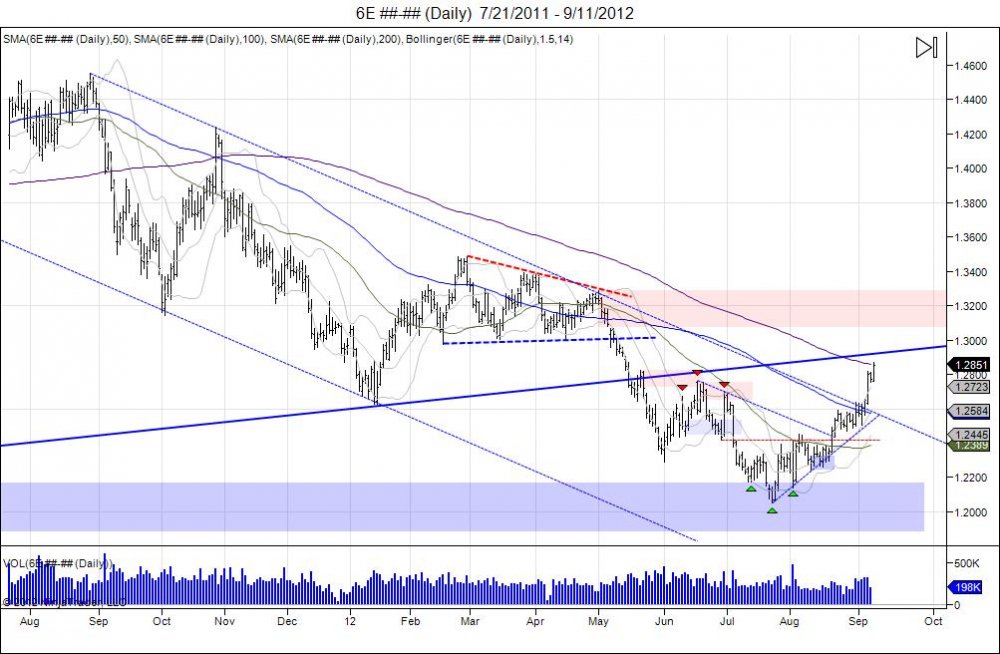
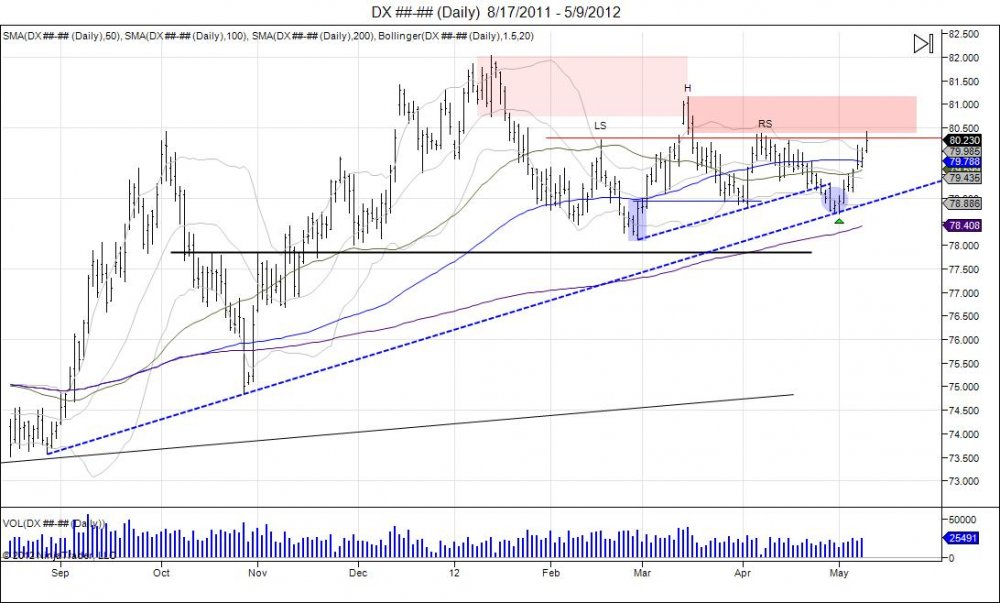
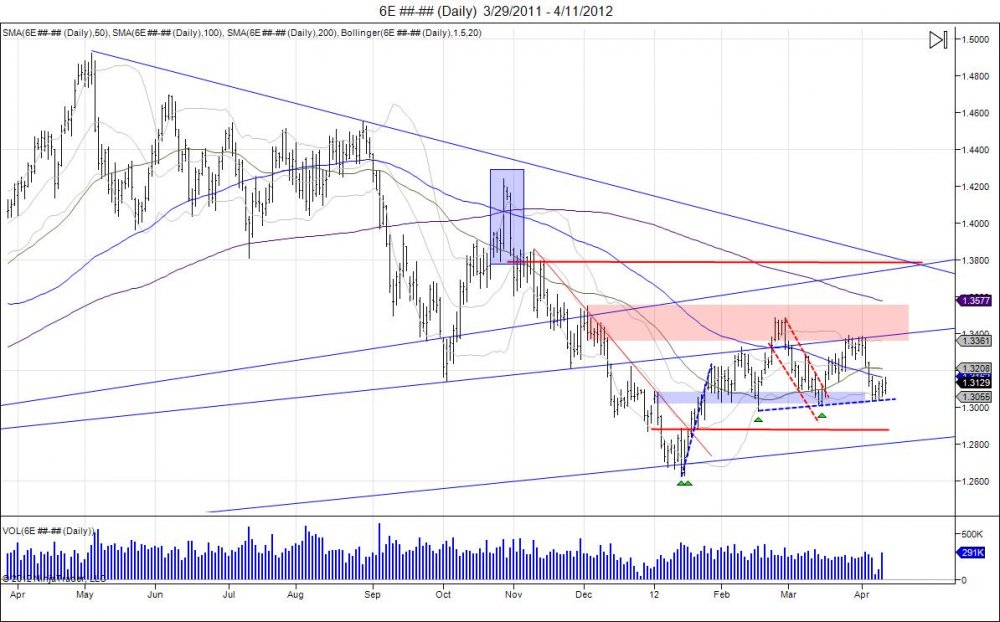
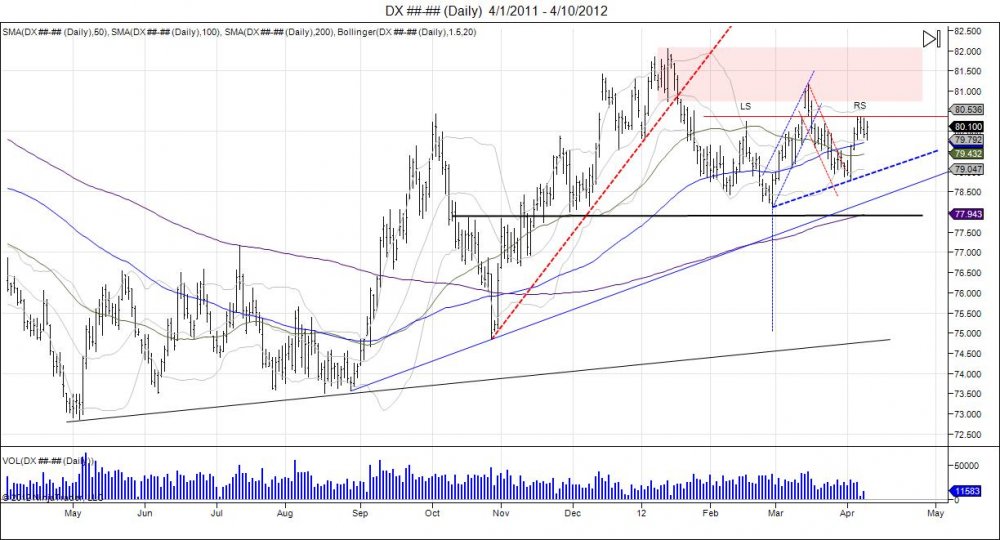
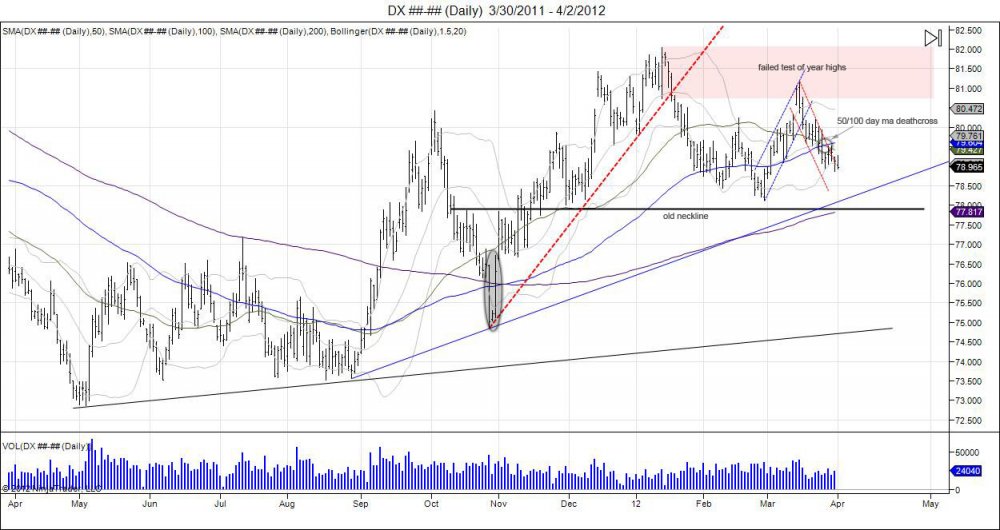
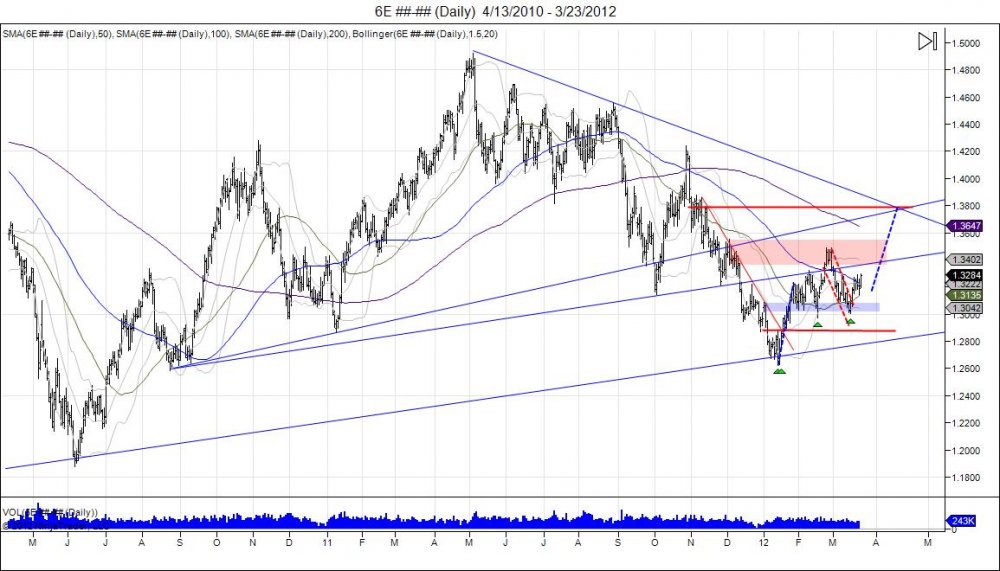
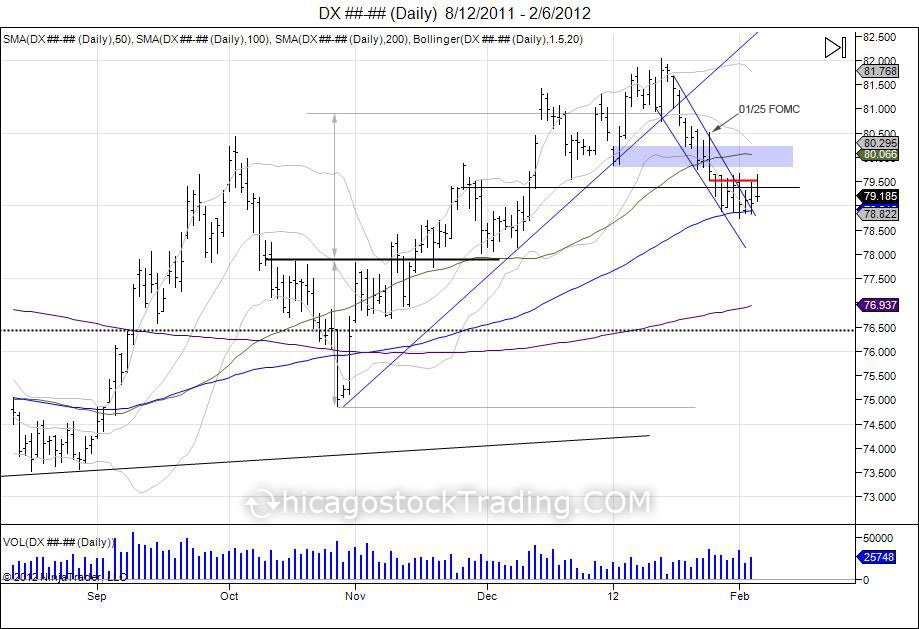
Keep an eye on the dollar index. As stocks bottomed on March 23rd, the US Dollar also topped that day, with a high of 10396.  

We wish everyone a healthy, safe, and prosperous new year.


LIMITED TIME: Get 50% off your first month of Futures Pro Monthly. Includes access to live trading room/screen share, nightly reports, and the 6 month volatility windows for January - June of 2021. Use coupon code "newyeardiscount"


Continue reading
1765 Hits

SP500 6 Month Vol Window Catches Late Buyers Again

ES Daily 2020 03 10 6 51 35 PM


The SP500 established a 6 month bullish bias in February which lured in buyers that were used as fuel to expand the market lower.  We wrote an article late January on the 6 month volatility windows highlighting a failure to sustain a breakout over a volatility window had the opportunity to trap late buyers, similar to what took place in January of 2018.  

You can read more about it here: SP500 6 Month Volatility Window Update

What's taken place has been almost identical to what happened in January of 2018.  Both times the market was coming off a major rally and the upper vol windows were used to lure in late buyers that failed to hold the market, developing into a bull trap that was reversed.  Current action has been sparked by Coronavirus, but the fuel that's expanded the market lower is trapped buyers that failed to hold the year low. Dip buyers failed on February 20th when the market broke below its 3D pivot range, breaking its upward momentum.  The following day on Friday, February 21st, the market fell below its 6 month vol window of 3361, which left buyers above on the hook. Monday's trade on February 24th gapped lower, trapping buyers above as it fell into testing the 6 month reversal window of 3225.  Dip buyers coming out as heroes in attempt to buy the dip (which worked so well until it failed on 2/20) failed to stop the market from reversing.  Too many longs were caught at higher prices and not enough buying to sustain the drop.  Since the door opening at 3225, the market dropped into the October low of 2855 before a defensive bounce up to a high of 3137 in March.  By falling short of the January low of 3181, buyers on the year are still holding the bag above. By holding below the reversal window of 3225 for 6 days, the 6 month bullish bias has been reversed, creating overhead supply that is acting as resistance as rallies are being sold.  The velocity to the downside and failure to hold support levels shows a lack of demand from new buyers. This is what happens when buyers are forced to chase the market, when it does come down, there are not many left, which lead to failures. 

Futures went limit down in Sunday's trade, falling 5% to a low of 2819. Once again dip buying heroes tried to step up, only to see the cash market on Monday trigger another halt with the market falling 7% before opening to see a flush into 2715.  This is what trying to catch a falling knife looks like. Tuesday's trade clipped the recent low of 2715 down to 2695 before bouncing back to retest last month's 2853 low that was lost this week.  This will be a key level for buyers to overcome for a shot at last week's failure at 2970.  Failure to overcome 2850, leaves the market vulnerable to continue trading lower, in attempt to expand lower to retest the breakout from 2500, which provides key support for buyers to defend the December 2018 low of 2316. Buyers who did not chase the market earlier this year and double down, can take advantage of the opportunity of that retest.  Whether it holds is another scenario, but the first test of the level provides buyers opportunity to defend major support from the December 2018 low.  Going forward, any rally back to the reversal window of 3225 will be key resistance for sellers to defend and buyers to overcome.  With supply being caught above, this will make it tough for buyers to recover as new buyers will need to step up to attempt to recover trapped buyers from earlier in the year. 


ES Weekly 2020 11 6 53 07 PM


Looking at the weekly chart above, you can see the market broke above its resistance trend line from higher highs in November of 2019.  This was fueled by shorts that were caught in August that failed to expand lower.  The market reversed its bearish bias on November 1st, trapping shorts and using them as fuel to expand higher. As seen in the weekly chart, you can see the expansion, led the market to break above its resistance trend line, forcing shorts to capitulate, and setting up this year with a higher market that lured in the late buyers that are now caught with the market falling back below. Shorts squeezed end of last year, buyers lured in this year, the downside velocity has increased because longs have been caught on the wrong side and shorts have been sidelined, which is forcing short sellers to chase the market lower.  First major support met at 2500 to retest the December 2018 low, this will give buyers who did not chase this market opportunity to defend that retest.  Failure to hold the December low, sees next major support into 2200 to retest the election low of 2028 from November 2016.  This is how the market moves, when more buyers or sellers are caught on wrong side and are used as fuel to expand the market in the opposite direction.

The Fed cut rates last week, but it was not enough. Soon they will be down to 0%, but that will not be enough either.  According to Ben Bernanke, the Fed has one more tool in their tool box, which is devaluation of the US Dollar.  If you STILL don't believe this can happen, take a look at what the US Dollar has done this year.  We warned of a bearish pattern that was developing in the US Dollar Index monthly chart in December.  If you look at the pattern, the market topped out when President Trump took office.  It has spent the last 2 years coming back in attempt to retest that failed breakout above 100.  This is a major resistance level the dollar will have to overcome for another shot at the 2017 high.  Failure to overcome puts in the lower high and sets up a failed retest that can lead to lower prices.  Obviously no one wants to see the dollar devaluated, but if things get ugly and cutting rates no longer work, it is an option the Fed has and it's better to be prepared for it then not.  Gold is benefiting and already recovered where it failed in December of 2012 when the Fed hinted at higher rates. Here we are, 7 years later and instead of higher rates, they're back to cutting.

Will President Trump Devalue the US Dollar?

2018: The Year of the Bull Traps

January 2019 Bullish Cup/Handle 

November 2019 Bearish Bias Reversal

January 2020 Bullish Bias Trap


Continue reading
2453 Hits

US Dollar: Major Correction Coming?

DX12 28


When President Trump was inaugurated in office, the US Dollar topped out with a high of 103815 in January of 2017.  In March of 2017 we wrote, "Will President Trump Devalue the US Dollar", highlighting Trump's comments about the currency, as well as the Bernanke's comments of dollar devaluation as a tool to fight deflation.  One year later, February of 2018, the dollar made a low of 88150, falling 15% from its January 2017 high.  For the last 2 years since this low, the market has worked its way higher in attempt to retest the failure in January of 2017.  The retest is technically major resistance for sellers to defend and buyers to overcome.  Thus far, the dollar has put in a lower high and is slowly backing away. Going forward, the dollar will need to overcome 100 for another shot at the high.  Failure to overcome 100 leaves the market vulnerable to continue falling in attempt to retest the 2018 low which is considered the neckline for a large monthly head/shoulder topping pattern that has developed.  A head/shoulder topping pattern is created when the market takes out a prior high to make a new high (01/17), failing to expand on the new high and falling back to take out the prior low (05/16).  By taking out the prior low, the breakout into the new high is considered a failed breakout. The low made after the breach of the May 2016 low is considered the neckline at 88150 as the market has bounced off this low in attempt to retest the failed breakout.  Breach of the neckline will be key. As breaking the neckline can see sellers chase the market to force expansion of 15.665 range (103815-88150), down to 72485 (88150-15665). The precious metals markets (gold/silver), have already seen a recovery as they have broken away from their multi-year downtrend.  Gold squeezed back to retest the Dec 2012 low of 1520, and has taken a pause since then, consolidating the gains.  Any further weakness in the USD would provide opportunity for the precious metals to push past these resistance levels in attempt to retest their highs.  


Reference: Will President Trump Devalue the US Dollar 

Continue reading
2197 Hits

US Dollar Down 10%, Now What?


Since our last report on March 17th titled "Will President Trump Devalue the US Dollar?", the US dollar is down over 9%, falling from 100 down to a recent low of 90.79.  This does not mean a dollar devaluation has occurred, or will, however as we pointed out, there are risks out there that needed to be factored in, and the market is doing just that.  

Tags:
Continue reading
2212 Hits

Will President Trump Devalue the US Dollar?

Before Mr. Ben Bernanke became Fed chairman, he made a speech before the national Economists Club in Washington, DC. on November 21, 2002, titled “Deflation: Making Sure "It" Doesn't Happen Here.” In these remarks, there were 5 major points Mr. Bernanke pointed out as tools the Fed could use to fight deflation:

Continue reading
6097 Hits

Reversals of the Year

 dx3_1.jpg

Continue reading
3441 Hits

Major USD Reversal No One is Talking About


US DOLLAR:

DX2_25.jpg

The US dollar is one of the most important, yet least discussed chart of the year.  Noticing the dollar's break below 79600 late January, early February, only to establish a bearish bias and lure in shorts before turning around higher. The market has held above its reversal window, thus reversing the bearish bias which has led the market to take out its year highs of 8100 set early January.  This U turn is having a major effect and pressure on commodity markets as the USD failed to break lower and is trading on new highs for the year. Take note of the gold chart how it is completely opposite of the dollar chart and is an upside down "U" from the beginning of the year.


ES________Daily___3_14_2012___2_25_2013.jpg


Click charts to maximize

Continue reading
2710 Hits

-24.8% USD = +223% GOLD

 GC________Monthly___9_1998___10_2012.jpg


DX10_11.jpg


Continue reading
1133 Hits

SP500, US Dollar, Euro

 ES________Daily___2_23_2012___9_11_2012.jpg


DX________Daily___8_2_2011___9_11_2012.jpg


6E________Daily___7_21_2011___9_11_2012.jpg

Continue reading
1045 Hits

US Dollar PPT

DX________Daily___8_17_2011___5_9_2012.jpg 


Continue reading
8782 Hits

Euro's Failed Break and USD Head/Shoulder

6E________Daily___11_14_2011___4_26_2012.jpg

 click to maximize

Ever since the Euro broke out of its downtrend from November in January after reversing off lows of 12627 and trading through the first trading day of the year range of 13020-13085, this range has turned into support.  This is the market showing us that the breakdown in January has a head fake and the market is attempting to reverse its momentum as it climbed back above that first trading day of the year range.  Since then, the Euro squeezed into testing resistance from December however was unable to continue the push which was followed by a retest of the 13020-13085 support.  This led to another bounce that failed at the now new resistance from February levels, which was followed by another breakdown to retest its support level.  This failure at the February levels turned into a right shoulder as the market came down to test its neckline as many shorts were looking for a break to confirm a head/shoulders formation.  During the month of April the Euro pressed against this neckline and even clipped it to put in lows of 13000 however held its 12975 lows from February and reversed back higher.  This led to a major consolidation and struggle to hold this neckline as the Euro has fought with its back against the wall trying to chip away at sellers and get the market out of this downward pressure.  This is needed for the market to try and squeeze higher to have shorts in as fuel for an upside rally.  Currently the Euro has worked through its 13200 resistance and is testing its next major resistance from the failed March highs which also meets with a downward resistance from the Feb-Mar highs connected.  Buyers who defended the 13020-13085 support level have opportunity again to lock in profits and leave runners to let the market work itself out to try and squeeze through this resistance.  A move past the March highs squeezes out the shorts who were looking for the head/shoulder breakdown and targets the February highs.  Moving past this February high squeezes out the remaining shorts giving fuel for the next leg up to try and retrace into 138 from where the market broke down from in October.  This 138 is the ultimate resistance in Euro off the 14241 highs and sellers should be looking at this level to defend.  As stated before the Euro is in short covering mode ever since it climbed above the Jan 3rd levels and support is seen down to 12890.  A break below 13000 would shake out weak bulls however taking out the year lows of 12627 is needed to put the ball back in the bears hands. 

 read more...


Continue reading
4401 Hits

138 Euro, 75 USD

6E________Daily___10_6_2011___4_23_2012.jpg

click to maximize

For the past 2 and half weeks, the Euro has consolidated and fought to hold its daily neckline stemming from the February - March lows.  This was breached on the 16th of March as the Euro hit lows of 13000, however quickly recovered and closed back above the trend line.  This shake out has seen the market continue to hold above its neckline, however meeting major resistance at the 13200 level.  Last Friday we saw the Euro close on highs hitting 13232, only to turn back lower on Monday and retest its breakout point.  This is at a critical level for the Euro as if this market is indeed ready to move higher, these Monday lows of 13107 should be supported for buyers to take out the  Monday highs of 13214 to show their strength of pushing back above 13200.  In turn the next major resistance comes within 13280-13387 from where the market broke down on April 2nd, as the range for buyers to squeeze through to target the February highs of 13488 and ultimately complete the retracement to 13800.  

more...


Continue reading
5546 Hits

Euro - USD Analysis

 6E________Daily___3_29_2011___4_11_2012.jpg

click chart to maximize

Since failing the test of the February levels late March, the Euro has fallen to retest its double bottom of 12975-13004.  This neckline is being threatened and the Euro is fighting very hard to hold with its back against this fence.  Upside resistance is met within 13195-13391 as the level to move through in order to break out of this downside pressure and move to take out the February highs to complete its upside target of 138.  Failure to do so and the neckline is in jeopordy of being broken for stops and to attract shorts where the January level will be retested with 12890 as support off that low of 12627, where a false breakdown can be seen to trap these sellers.  Ultimately the January lows need to be broken for the Euro to be back in bear mode, until then the market is in short covering mode and should continue to look into retracing to 138 where it broke down from 142.

DX________Daily___4_1_2011___4_10_2012.jpg

 click chart to maximize

The US dollar most recently has been testing its failed highs from March after the pullback found support at the February lows.  This test builds a right shoulder on a failure to take out this high, giving room to break the neckline of 7812-7880.  With that the 7800 level will have a better chance of being taken out as the market has tested and failed upside levels.  Downside target comes in to take out the October lows.  Currently fighting minor support at 79700.  Buyers need to squeeze March highs to fail this head/shoulder attempt and target the year highs in order to regain control.

Continue reading
3985 Hits

US Dollar on the Edge

DX________Daily___3_30_2011___4_2_2012.jpg

click chart to maximize

more...

Continue reading
887 Hits

Strong Euro Weak USD

 6E________Daily___4_13_2010___3_23_2012.jpg

click chart to maximize

more...

Tags:
Continue reading
3510 Hits

Paul, Bernanke, and Dollars Under the Mattress

During the last FOMC conference on January 25th, we highlighted Chairman Bernanke's comments about how the inflation rate only hurts one if they "do their life savings in a mattress"  

Today, Congressman Dr. Ron Paul questioned Chairman Bernanke on this comment:

4:50- "In January at one of your press conferences you said that, you sort of poked a little bit of fun at people to downplay the 2 % inflation rate. But if you say it's 2, I say its 9, lets compromise for the sake of argument its 5%.  You said that it doesn't hurt you unless you're one of those people who stick their money in a mattress, but where are you going to put it? Are you going to put it in a CD and not make any money at all?"

more...

Continue reading
3683 Hits

The Fall of the US Dollar

 DX________Daily___8_12_2011___2_6_2012.jpg


Since the US dollar put in its “Island Bottom” in October of 2010 with the failed breakdown of 74860, the market reversed to create an inverted head and shoulders with a neckline of 77855, targeting 8100.  After breaking through its neckline in November, this 77855 level turned into support and the short squeeze was on as the market squeezed into completing its inverted h/s at 8100.  Consolidation was seen at these highs with a tug of war taking place.  The market began 2012 on Jan 3rd with lows of 79830 and highs of 80225.  Following this first day of trading, the market ran into new highs, touching off at 82045 on January 13, 2012.  This 8200 level turned into the last hoorah for the short squeeze, trying to get as many shorts out as possible, as the market began to roll over and broke its uptrend line from the October lows on January 18th.  Following this break of the uptrend, the market began trading in a newly formed channel pointing down as it targeted the year lows at 79830.  These lows for the year were eventually taken out on January 23rd, leading up to the January 25th FOMC statement by the Fed chairman Ben Bernanke.  On the 25th as the Fed released their FOMC statement, the US dollar had attempted to rally, however failed.  Putting in highs of 80505, only to reverse into lows of 79515.  Since this FOMC and break of the year lows, this level has now turned into major resistance for the past 2 weeks at 79515.  The year lows that was support at 79830 has also turned into major support as the market reversed its early momentum in the year.  At this point the market has reached its 100day moving average on the daily chart and has been in consolidation mode in a fight to hold this support as upside resistance is being tested.  Pressure remains to the downside now with the Jan 3rd range of 79830-80225, followed by the FOMC high at 80505 as major resistance.  A push past these levels would be needed to get buyers back into control, however only leading to retest the next major resistance coming in at the year highs at 8200 where a failure would create a right shoulder.  The question is will the market rally up to test this high and give sellers an opportunity to get out or continue this chase to the downside.  Buyers who did not get out in time from last year’s rally are now seeing the pressure turn against them. Below the 100day moving average on the daily, next major support comes in at 77855 being the old neckline from November, followed by the October head at 74860 and year lows of 72860.

  more...

Continue reading
5228 Hits