Chicagostock Trading

Chicagostock Trading

The Turkey Squeeze - T/A Galore: 2 Inverted Head/Shoulders and a Cup/Handle


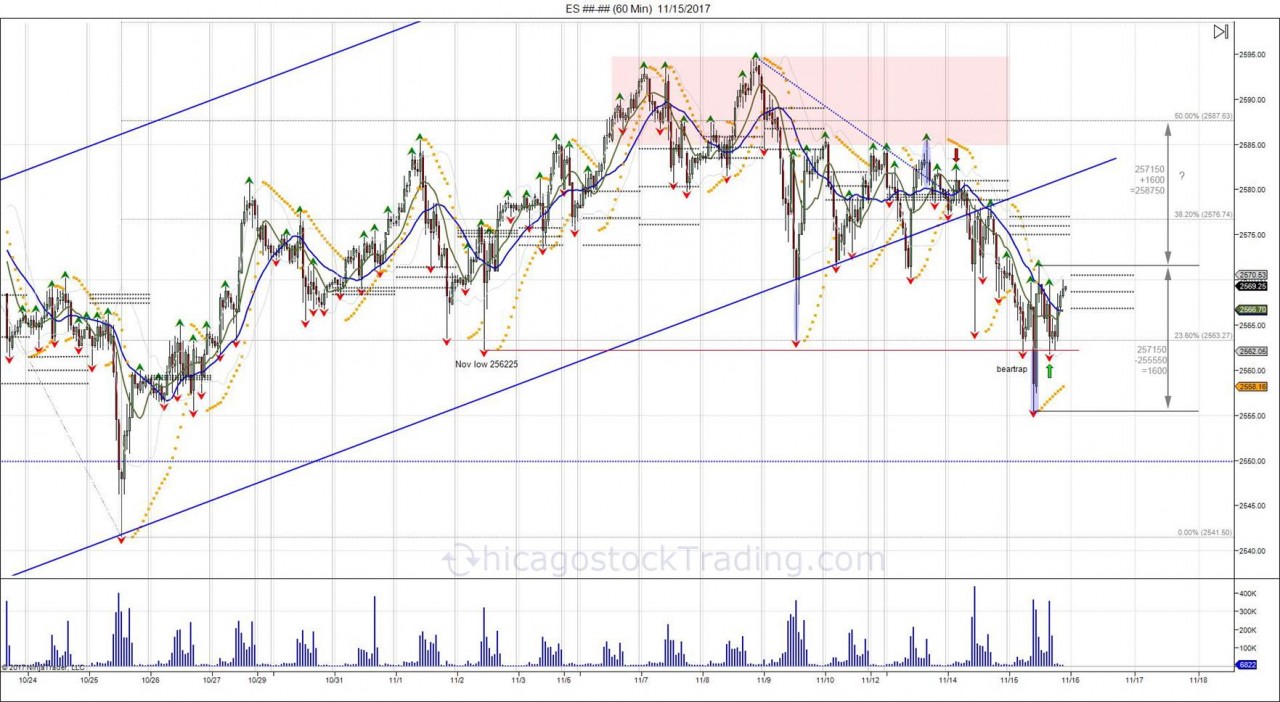
 Last week, the market took out the early November low of 256225, falling into 255550, before quickly bouncing back to 257150.  This break of the monthly low turned into a failed breakdown and a head fake as the market retested 2562 into the end of day, creating a right shoulder for an inverted head/shoulder pattern.  Shorts below 2562 were left trapped, giving opportunity to expand the range up to 257150.  


Continue reading
3365 Hits

SP500, Bonds, Yen, Euro Chart Updates

 SP500

ES________60_Min___3_27_2013b.jpg

Since the gap down two Sunday's ago on the Cyprus news and bouncing off the old highs from February at 1530, the market has gone into a major tug of war whipping short sellers who have tried to come in following the news.  The "plunge protection team" has managed to keep the momentum alive with higher lows.  Just 1 week after that gap down, the squeeze managed to print new highs on the year at 1560.50. Following this new high,  another pullback was seen to retest the prior low of 1535 only to see another higher low develop at 1539.  On Tuesday this led to a recovery that retested and pressed against resistance based off the Sunday high.  This has led to the market climbing back Tuesday night and retesting the 1560.50 level with the market tapping it again, however failing to breach.  Thus far this has led into another pullback, retesting the previous lows of 1539 with lows of 1545.75.  Higher low again as the range tightens and the market builds buy stops above the highs going into the holiday weekend. Sell stops also building below this trend of higher lows and they will be targeted eventually, question will be if momentum can stay alive into the holiday weekend as the range is now 154575-156050.  Resistance met against 1558 with stops above 1560.50.  Support  1548-1539. Bonds as shown below have continued to hold their bid following the Cyprus gap above 14200 and this has led to tap the March highs of 14429.  The squeeze eventually completes on a move past the February high of 14611 to confirm the break below 14200 as a failure.

Continue reading
3446 Hits

Reversals of the Year

 dx3_1.jpg

Continue reading
3427 Hits

Major USD Reversal No One is Talking About


US DOLLAR:

DX2_25.jpg

The US dollar is one of the most important, yet least discussed chart of the year.  Noticing the dollar's break below 79600 late January, early February, only to establish a bearish bias and lure in shorts before turning around higher. The market has held above its reversal window, thus reversing the bearish bias which has led the market to take out its year highs of 8100 set early January.  This U turn is having a major effect and pressure on commodity markets as the USD failed to break lower and is trading on new highs for the year. Take note of the gold chart how it is completely opposite of the dollar chart and is an upside down "U" from the beginning of the year.


ES________Daily___3_14_2012___2_25_2013.jpg


Click charts to maximize

Continue reading
2695 Hits

SP500, Nasdaq, Midcap Daily Charts

 ES________Daily___3_12_2012___10_16_2012.jpg


NQ________Daily___3_12_2012___10_16_2012.jpg


EMD________Daily___3_15_2012___10_16_2012.jpg

Continue reading
3445 Hits

SP500, US Dollar, Euro

 ES________Daily___2_23_2012___9_11_2012.jpg


DX________Daily___8_2_2011___9_11_2012.jpg


6E________Daily___7_21_2011___9_11_2012.jpg

Continue reading
1045 Hits

GLD Chart Update

 GLD (Daily)  12_10_2010 - 1_27_2012.jpg

more...

Continue reading
2894 Hits