Chicagostock Trading

Chicagostock Trading

CST Pro May Trial

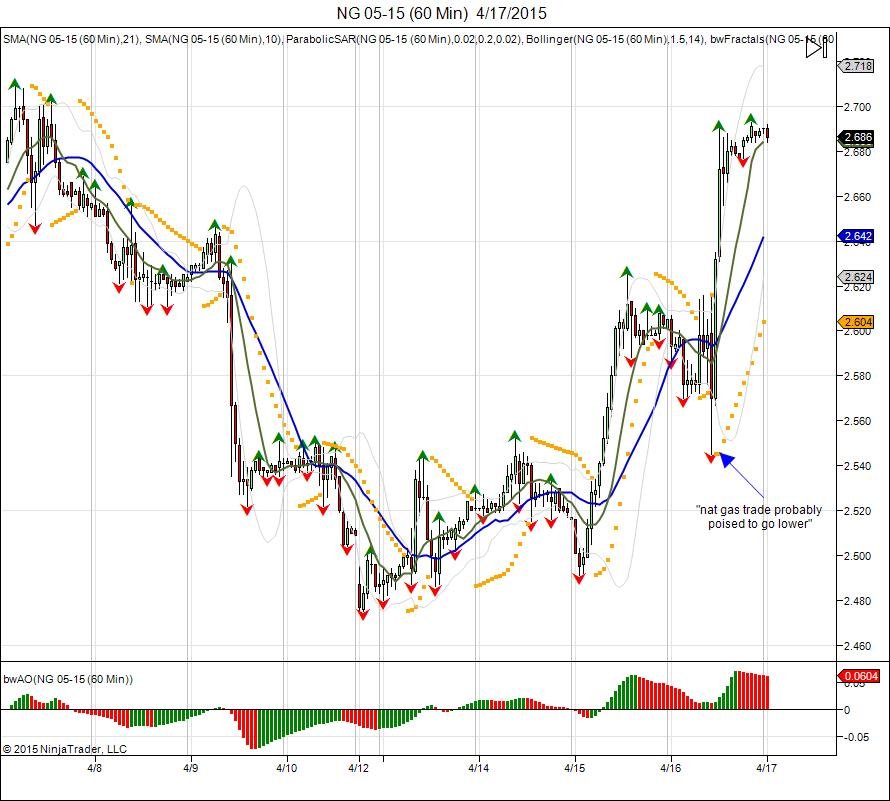
Excerpt from CST Pro subscription email sent on 04/27/15 for trade day 04/28/15.  As highlighted in the report, 209050 was a long trade with specific stop and target levels. Bottom left of image is excerpt from our chat, highlighting Chicagostock's intraday analysis, followed by a chart of the intraday Emini SP500 on 04/28/15.  

CST Pro Subscription- 2 Week Trial 

  • Daily Emini SP500 Futures Analysis
  • Daily pivots & vol windows (ES/CL/GC)
  • Volatility Windows PDF Guide
  • Swing trade recommendations
  • Live trading chatroom
  • Live charts
  • Live day trading signals 

CHATROOM TESTIMONIALS


For the month of May of 2015, we are offering a special 2 week trial period to CST Pro for only $99! This will gain you access to the daily letter, pivots, live day/swing trade signals, trading room, and screen share.  

This is an open offer to allow you the opportunity to try our group and see what we are about. Only serious traders apply. We have room for a maximum of 10 new traders. If you beleive you can find value in joining our group and services, please feel free to apply. See you soon and best of luck trading!

 Please email This email address is being protected from spambots. You need JavaScript enabled to view it. for future trials and or any questions.


By accepting trial membership you agree to terms and conditions. Chicagostock Trading uses proprietary and copyright protected material.

RISK DISCLOSURE: PAST PERFORMANCE IS NOT INDICATIVE OF FUTURE RESULTS. THE RISK OF LOSS IN TRADING FUTURES AND OPTIONS IS SUBSTANTIAL AND SUCH INVESTING IS NOT SUITABLE FOR ALL INVESTORS.  AN INVESTOR COULD LOSE MORE THAN THE INITIAL INVESTMENT.

Continue reading
2930 Hits

Losing money watching TV...

 05_22_jpg.jpg

Continue reading
3403 Hits

Where to Buy Gold

GC________Monthly___2_2007___4_2013.jpg


Since the December 2012 FOMC meeting that "Spooked the gold market" as the FOMC members attached a 6.5% unemployment for a target on rates, gold has fallen $362.6.  However since the failure to break above 1800 in 2012 and double topping at 1798.1, the market is down $442.8. So why the sudden crash over the past 2 days? As we know the market ran from 681-1923.7 as the FOMC cut their rates down to 0%.  The year of 2012 was all about consolidation.  It traded in a range of 1526.7-1798.1 which lured in a lot of late buyers betting on "hyperinflation".  As gold has most recently failed and broken below this 2012 low of 1526.7, it has confirmed the highs in 2012 as a double top.  This range of 271.4 (1798.1-1526.7) can now be subtracted below 1526.7 to give room to expand the market down to 1255.3.  This target when put out in December was looked at as a crazy and a lot of "gold bugs" were insulted. Today the market is bringing pain to these gold bugs as it shakes them out.  The current breakdown clears and shakes out buyers who came into the market above 1500.  The move is good for "smart" money who have been sitting on the sidelines awaiting for the market to go on sale. Completion of this move is seen at 1255 which also retraces the market 50% of its 681-1923 move. In the big picture, that would offer a 50% sale off the highs and bring the market back to where it broke out in 2010.  This range of 1200-1300 will offer an area of major support for the market to attempt to build a base for long term buyers to watch for to come in and buy the sale.  A break of 1150 would give room to test major support at 1000 being where the market broke out in 2009.  Failure to hold above sees the 681 low  targeted and at that point the long gold story would be all over. Short term yes the market is very over sold and the long community is in shell shock, the old lows of 1526 is now new major resistance with next level of sell stops below 1309.1 as the 2011 lows.


Continue reading
4410 Hits

Gold $98 Locked & Free Ride for Another $366

 GC________Weekly___Week_32_2008___Week_9_2013.jpg

Gold's double top from 2012's year of consolidation following the 182% gain from 681-1923.7 has seen the market channel lower since that high of 1798.1.  This year began with a early breakdown followed by a bounce up to 1697.8 where the market failed to push through, leading the market to breach the year lows of 1626 in contrast to the US dollar reversed to take out its year highs.  Going forward, the market is now testing its last level of support based off its 1526.7 lows made in 2012.  This week has been a major failure as the market rallied to take out last week's highs of 1618.8, only to fail and turn back lower to where the week opened at 1579.7.  The downside chase continues and the 2012 lows are being targeted by bears.  A breach of thsi 1526.7 low confirms the 2012 double top and gives room to expand that $271.4 range which gives a downside target of 1255.3.  This would retrace the makret 50% of its 681-1923.7 move and offer long term investors a big area to buy.  Move back above 1676 reverses the bearish bias to give room to retest year highs.

Continue reading
3430 Hits

How We Played This SP correction and Setting Runners for Homeruns

 ES2_26.jpg


With the SP500 squeezing the December 2007 high of 1527 and running into 1530, the rug was pulled underneath as bids lifted and sellers came in to take profits.  This led the market to correct down to 1495.00, testing its 1498 support level it broke out of in January.  This setup an aggressive attempt to sell any retracements retesting the 1530 level.  On Monday, the retracement was seen.  Our signal was offered at 1515 and using the 1530 highs as the exit.  The market came close up to 1524.50 before reversing lower to complete target 1 at 1498, locking in 1 times the risk for 17 handles.  Target 2 was 2 times risk at 1481, however with the market falling so quickly the same day, we were happy to lock in 1483 for another 32 handles to total 49 locked in. What is left is "running" positions where only profits are risked.  The runners should double the 49 handles locked in to turn the trade into a home run.  These don't always happen, but this is how we like to position trades for big moves, by scaling out to reduce exposure and leaving only runners to go after big targets.  Target on these runners are currently 1420. This is not to say the market will go straight there, however this would be a breach of MAJOR support within 1455-1465 and would fill last year's gap down to 1423.  Doing so, will pay 95 handles just on the runner positions.

Continue reading
2977 Hits

Oil moves up $16 off lows, pays 27k


CL________Weekly___Week_48_2008___Week_33_2012.jpg

September crude oil contract ran up to highs of 94.90 today with only 5 days remaining for the contract to trade with it's expiration nearing on August 20th.  The move approaches the 9750 target which retraces the market to where it failed May of this year.  With the contract having to go into another roll and only $3 shy of its upside target, it is good enough to finally close out the runner position from 7840.  This contract already had to go through a roll from August into September and with the close of September, the two contracts combined have paid a total of 15.87 on this runner position. More then the first two targets combined which netted 11.35.  There was no risk on the runner after taking profits on targets 1 and 2 and allowing the 3rd to run with a stop at entry, however the trade has completed for a total of $27.22.  

Going forward, 9750-10643 is a major area of resistance for crude oil to work through.  Moving past this range retraces the market to where it failed in May, making a U turn on the weekly chart, where at this point consolidation would need to be seen to build a base and target the year highs above 110.  Until then this is speculation and we need to see the market trade through this major resistance range of 9750-10643. Downside support is seen 8936-8684 and down to 8530.


CL_09_12__60_Min___8_15_2012.jpg


Reference: How We Played Crude

Continue reading
2838 Hits

How We Played Crude


07/03/12 Update:CL_08_12__60_Min___7_3_2012.jpg 

Crude reached its 2nd target of 8640, currently trading 8660s. 2/3 of trade is out.  Total locked $11.35. Next resistance 9020-9220, target on runner = 9750. This runner target will add $19.10 if completed.


_________________________________


CL_08_12__60_Min___6_29_2012.jpg

It was no easy task holding crude long this week. After attempting to breakout at 8092, the market failed on Thursday and a shakedown was seen squeezing out weak hands as the market fell into new lows for the week at 7728. Wiping paper gains. Sure enough this breakdown turned into a failed one as the market has reversed through Thursday's failed highs of 8084, completing the first upside target of 8240. Having taken some heat, we locked in target one at 8195 with no complaints. The market has confirmed the long side direction following Thursday's failed breakdown by this reversal, and we are seeing that today with the squeeze higher as shorts are forced to cover and longs who were squeezed out are forced to chase the market higher.  To continue higher, downside support is now seen down to 8090. Next upside targets come in at 8640 and 9750. 8474-8589 offers next major resistance, followed by 9750 which retraces the market to where it broke down the first week of May off highs of 106.43.

Continue reading
3530 Hits

How We Played the Yen

 6J_09_12__60_Min___6_20_2012.jpg


Following last Friday's squeeze into the sellzone in the Japanese Yen, the market opened lower this week, keeping buyers from that squeeze locked in allowing for the market to run lower and test downside support.  Today the market fell into retesting its monthly lows of .012546 with a low of .012558, giving oppurtunity to take some money off the table on the short side, and allow the market to now work this support.  If this downside is any good, it should be ready to break this monthly low in the coming days and turn lower to retest the .0124 level of where the market broke out late April. Thereafter comes the .011879 low from March, and ultimately the flash crash highs at  .011375. Reversing to take out last week's highs of .012737 gives room to retest the .012881 June 1 high.

Continue reading
2804 Hits

Day Trading into Swing

ES 06-12 (60 Min)  6_6_2012_1.jpg 

On Tuesday there was a buy recommendation of 1271 with targets of 1278, 1285, and 1308.  The first 2 targets were completed intraday which allowed to take money and risk off the table by then moving stops to breakeven at 1271 for the last runner target of 1308 to be ran.  The third target or runners are always the gravy or cherry on top of everything as these give profits larger then the first two targets combined. Sometimes they work out, sometimes they don't. However to take out the greed, thought of "should I hold on, should I get out", taking money off the table along the way eliminates this and leaves a position that can continue to gain should the market continue to move in that direction.  On Wednesday the market ran up to 1299 and this was good enough to take off that 3rd target for a gain of 28 handles, totalling 44.5 handles.  Sure enough the market ran to 1308, however no complaints. 


Continue reading
3599 Hits

30 Year Bond, on the Edge, again.

 ZB 03-12 (120 Min)  2_29_2012_1.jpg

click image to maximize

Notice a pattern above?

Over the past 2 months we have seen the 30 year bond attempt to breakout only to fail.  Thus far, we have seen 3 setups that attempted this.  The first one was during January 13-18, followed by January 30-February 2nd, and most recently February 27-29.  All these attempts have couple things in common, one they were all led by short squeezes as the market tried breaking down but was not ready to, and two- as they tested the highs and tried to break out, they failed and created a 3 point consolidation that was followed by a selling.  Most recently, once again the 30 year tried to breakout as short covering led the market into testing its 14400 level, only to once again fail and create a head/shoulders pattern with highs of 14403/14411/14404.  This thus far has once again repeated the pattern and broken down as the June contract has taken over for the front month.  Lower highs, and higher lows are now being created and this market is getting tighter.

read more...


Continue reading
3707 Hits

The November 2011 Gold swing short that made $46k

In November, the gold bounce from 1535-1804 was recommended to sell against.  By December gold fell back to clip the 1535 lows with a new low at 1523.9 before turning back.  This offered oppurtunity for aggressive traders to short the market and profit on the way down, along with oppurtunity for gold bugs to use the pullback as an area to defend and buy physical considering the market was $300 more just a month back.

GCNOVTRADE.jpg

more...

Continue reading
2107 Hits

The 2011 Euro trade that made $43k in 3 months.

On October 27th 2011, Chicagostock Trading recommended selling the Euro at 1.4180:

eurotrade10-27.jpg

more...

Continue reading
6246 Hits