Chicagostock Trading

Chicagostock Trading

SP500 Market Update - Video


Futures, foreign currency and options trading contains substantial risk and is not for every investor. An investor could potentially lose all or more than the initial investment. Risk capital is money that can be lost without jeopardizing ones financial security or lifestyle. Only risk capital should be used for trading and only those with sufficient risk capital should consider trading. Past performance is not necessarily indicative of future results. Video content hosted by third party.
Continue reading
2601 Hits

Technical Analysis Right Before Your Eyes

Continue reading
3481 Hits

This Week's Meltdown Eerily Similar to Last Week's

Last week, we took a close look at the intraday SP500 action and shared the view through vol windows. (Click to view). This week, we couldn't help but notice a very similar pattern. Take a look below at the chart comparison between last week vs this week, without Friday completed (tomorrow).  

Tags:
Continue reading
2501 Hits

Stocks and Volatility Shorts on Tight Rope

05_22_jpg.jpg 

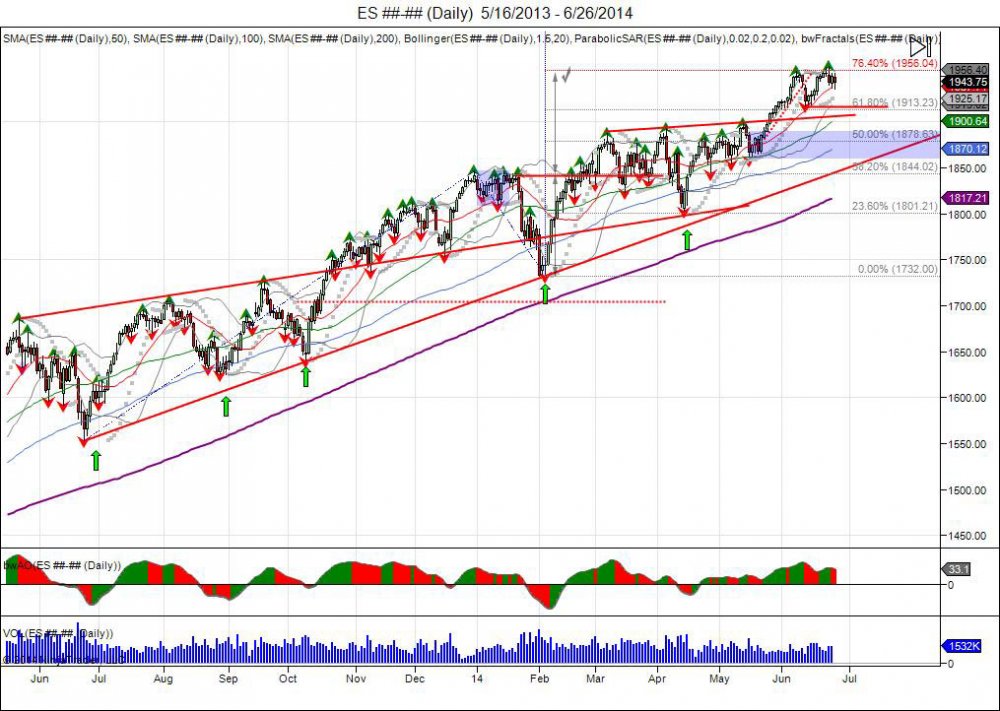
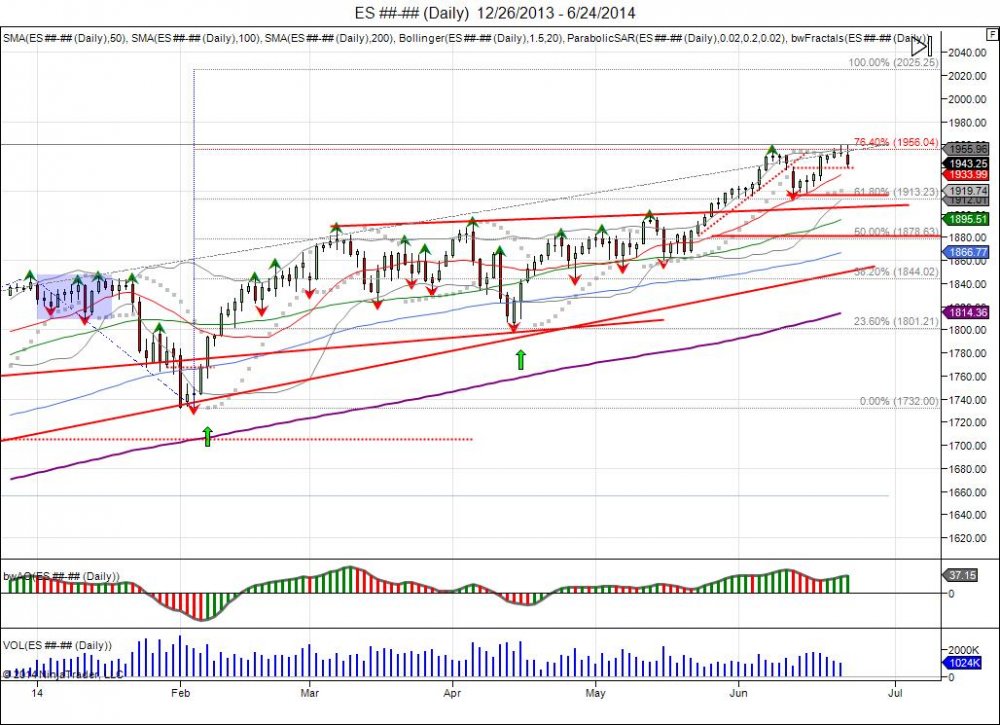
SP500 futures have been in limbo after completing the 1955 target based off the January-February range expansion (1844-1732 = 112, 1844+112=1956).  This level has also coinciding with a major fib extension at 76.4% based off the May 2013 low (1553) to the December 2013 high (1846) and the February 2014 low (1732).

We know this year started off sideways from last years close, which was followed by a massive liquidation from 1844 down to 1732.  This selloff was reversed, with the market recovering above 1844 to squeeze out shorts.  The reversal above 1844 created the plateau to allow new buyers to come in and support prices to attempt and expand the 112 point move down up into 1956.  After 3 months of sideways consolidation and bear traps, the market printed new highs in May at 189850 followed by a low of 1859 that barely held its May low of 185450.  By holding this low, the market managed to reverse and squeeze through 1898, giving way to breaking outside of the 3 month range and expanding up to complete the target as shorts once again were squeezed.  The ECB came out on the 5th of June to cut rates to negative, giving the boost in the SP to hit 1940.  The following day was the Jobs report on the 6th of June which continued the move into highs of 184975. Spilling over into Monday, highs of 195475 were made completing the range expansion and meeting the 76.4% fib, give or take a point.  The futures rollover from June into September saw prices rollover with, falling down into 1917 to test the June lows and hold, before reversing back up as the September contract became the front month and went toward to meet with its 76.4% fib as well. 

Highs of 195975 were made during last Sunday's Globex session that further squeezed shorts after September took out the continuous highs. Since this Globex high, the cash market opened lower only to rally back and retest this high, making a new one by a tick at 1960 before going offered down to 1936.  Over the past 2 trading days the SP has fought to hold above 1940 as it attempts to defend the reversal off the 1917 lows and develop a base to squeeze shorts through 1960.  Buyers at the 1940 level need a move through 1960 to be rewarded based on their risk of defending the 1917 low.  Doing so, gives way to the next major fib level of 100% at 2025.  Failure to hold 1940, gives way down to target the 1917 low made last week.  Failure to hold 1917 confirms the new highs as a failed breakout with buyers that will be forced to liquidate which gives way down to retracing into the May breakout at 1890 to allow buyers to defend.  This would be alot healthier to the market as it would allow buyers a opportunity to buy a dip and use a break of the May lows as their exit, as opposed to forcing buyers to chase above 1960 in which will continue the capitulation of shorts and parabolic squeeze. It is the struggle to accept 1950.


unemp1_7.jpg


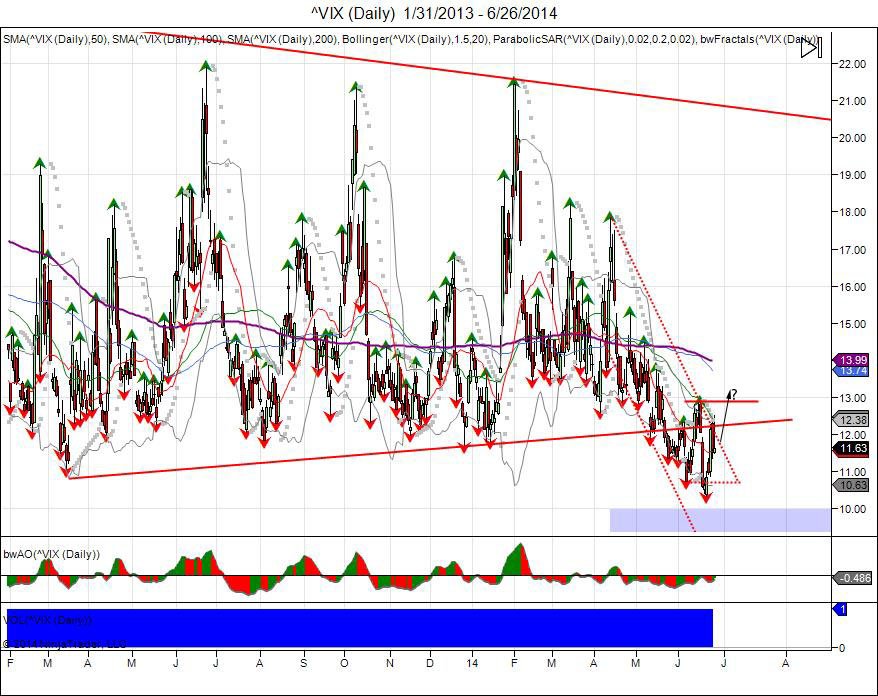
It is important to pay attention to VIX futures here.  After taking out multi year lows and falling below its trend line from the 2013 lows, VIX fell into 1073 early June, before bouncing up to 1289 in an attempt to come back.  This early attempt was rejected and VIX was sold down to make new lows (as the SP made new highs), falling down to 1034 before seeing a push back to highs of 1233 on the 25th of June.  It is interesting to note the take of the Volatility Sonar report from Optionmonster TV that highlights July call sellers in the VIX futures and an absent of what they call the "call stupid buyer" that has been buying premium in VIX not show up on that particular weakness from the 25th.  Jamie Tyrell explains how VIX can turn higher toward the end of the video.  Thursday saw VIX press against highs of 1251, nearing that 1289 June high, before backing away. Shorts in Vol should be concerned as a squeeze through the June highs forces shorts to cover as the June lows setup a failed breakdown, giving way for a move to retest the April range of 16-18.  

This was our projection of VIX just a little over a month ago: http://stks.co/p0M9e


Continue reading
3693 Hits

What Tuesday's Reversal Means

 05_22_jpg.jpg


On Tuesday, the SP500 put in whats called an "outside reversal bar". What this means is the market took out its prior high, however failed to hold and reversed to close below the lows.  This comes after seeing last week the contract rollover from June into September, see the market sell off down to 191750 after the June contract reached its 76.4% fib extension and 1955 target with its 1954.75 high.  The market recovered after the rollover lows of 191750 last week and ended the week with the market taking out the continuous 195475 high up to 195675. This allowed the September contract to meet its 76.4% fib. Monday saw a continuation of this squeeze overnight with the Sunday globex trading seeing a squeeze up to 195975 and Monday's cash open lower. Tuesday saw the market retest this globex high, take it out by a tick at 1960.00, and fail to hold, falling down to take out the cash open to reverse the market, falling into major support at 1941.  Going forward, this reversal not only caught longs off guard, but has also left some shorts on the sidelines with Tuesday's retest of Sunday night's short squeeze.  The close below 1950 has turned the level into new resistance with pressure against 1941 based off the 1917 low made last week. The reversal down to 1941 allows buyers a retest of major support to defend and prevent the 1917 lows from failing.  Bulls must now get through 1950 resistance and recover the failed 1960 high to regain momentum.  Failure to hold 1941 support gives way to target last week's 191750 low to squeeze longs and confirm the daily new high as a failed breakout. This would be a front run ahead of next week's NFP report with the downside chase to squeeze longs and lure in shorts below 1917.  Failure to hold 1917 gives way to break the June 191375 low and put in a reversal for the month, giving room down to retest major support within 1890-1880 based off the May breakout. 


Continue reading
2535 Hits

The American Revolution and the SP500

1-8-12b_1.jpg


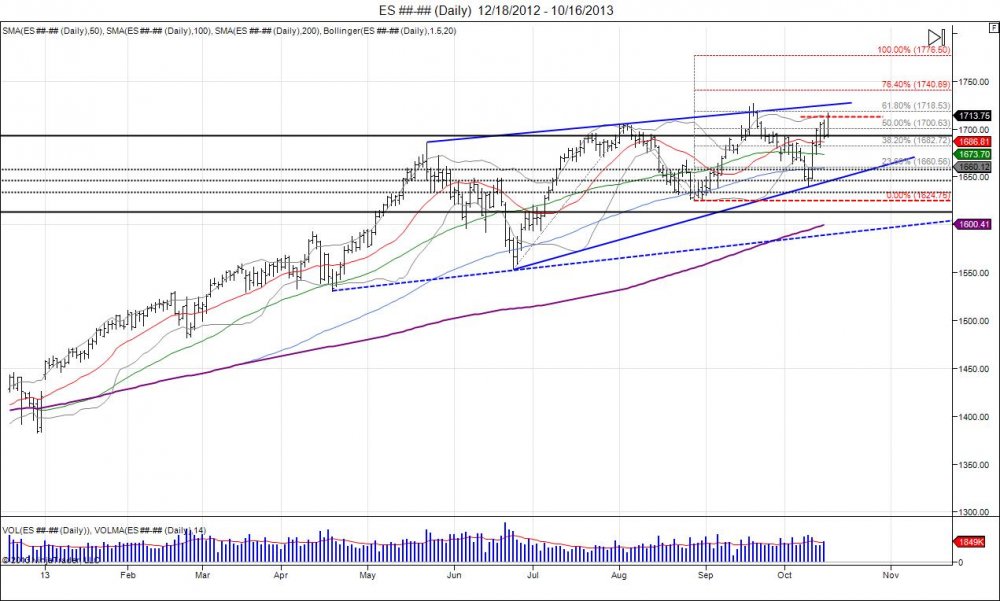
The SP500 is back at pressing last month's, keeping the rising wedge of higher lows and higher highs since the May correction.  Putting the market back in the hands of sellers to defend just as a deal on the debt ceiling is made.

The last high at 172675 capitulated shorts above its previous high of 1705 as the Fed surprised the market with no taper and no Larry Summers.  This was followed by a pullback which failed to see buyers materialize inside 1680s as the gap was filled post shorts being squeezed.  Establishing a weekly bearish engulfment and eventually grinding down into lows of 1640 to test last and major support based off the 162475 August low.  Sure enough this held to see the market develop a reversal that was fueled by talks of a deal taking place on the debt ceiling. Shooting the SP 60 points back to retesting major resistance within 1710-1715 from the failed high in September.  Just as the SP tests this major resistance, Congress has struck a deal with less then 14 hours before the debt ceiling was to be breached.  Many are looking for sell the news to take place, and the test of the September highs here is the true tell as to whether buyers can continue to support prices to push through sellers now coming into defend this resistance. For the market to reject this test of the September high, a quick reversal needs to be seen to fall back below 1690 to give way to test support at 1658 based off the 1640 lows.  The longer buyers can support prices at these levels, the more pressure to squeeze out the September high and put in another higher high.  Should this take place, we see next major resistance levels coming in at 1740 as a 76.4% fib extension, and ultimately 1776 as a 100% fib extension.  Keeping in mind the May high at 1685 that led to the biggest correction of the year was also a 100% fib extension.  This would be ironic to see the market reach for this number, the year of revolution/America's birth, just as Congress' approval ratings drop to all time lows and they continue to kick the can down the road with no real solutions on cutting spending or the debt.

Continue reading
2700 Hits

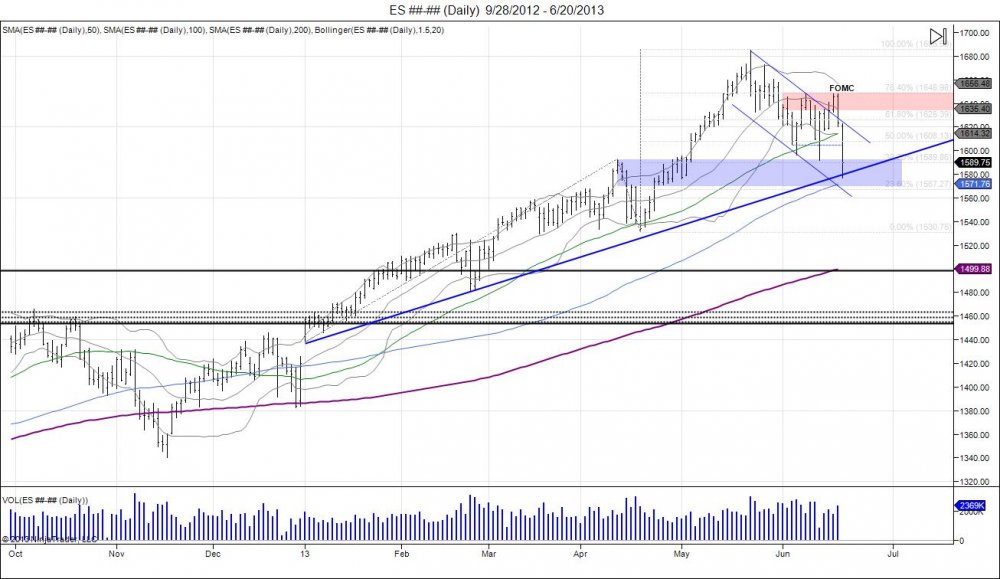
SP500 FOMC Headfake = 157075, 153075.

ES________Daily___9_28_2012___6_20_2013.jpg

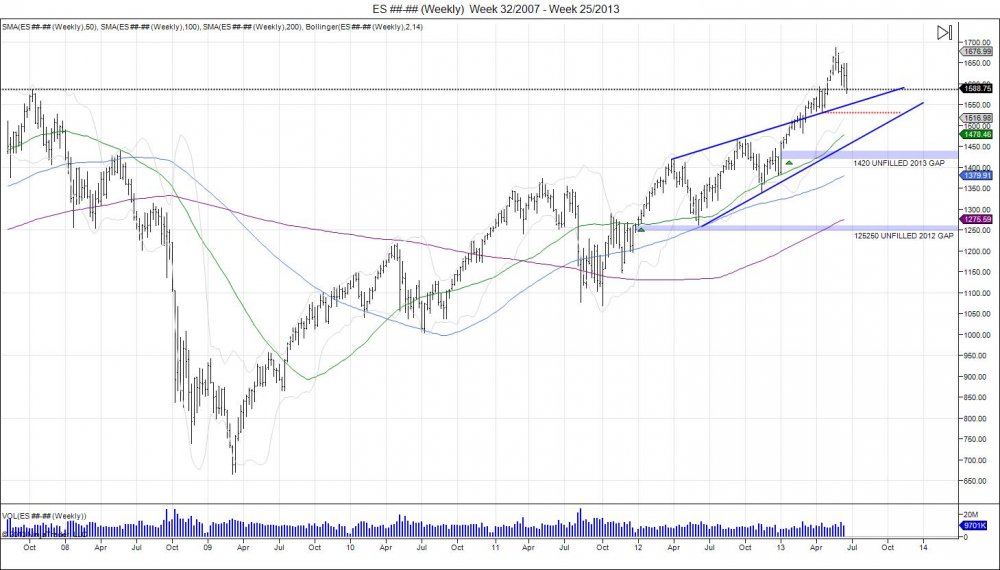
The SP500 fell down into a major trend line on Thursday based off support from the year lows.  This comes after the market originally broke out in May above 1593 to start the “5th wave” of the year from 1530.75-1685.75.  The highs at 1685.75 completed a 100% fib extension and since touching this level, sell programs from longs have been taking profits into rallies.  We saw the market fall down below 1600 in June twice. Both seeing a sharp reversal as the market squeezed shorts selling lows.  The last reversal on the 13th was much more violent.  It led the market to take out its 164850 high from June 10th by .50 as the market put in highs of 164900.  This turned into a failed breakout as sellers who stopped selling awaiting the FOMC statement, returned following the release.  They resumed taking profits in the market as the Fed continues to outline its strategy for exiting.  Why wait until the last minute when they are already hinting they want to slow down purchases? This is the case, especially after running up from 1438 this year and into 1685, 17%.  The resumption of profit taking post FOMC caught many off guard as it created that head fake above 1630, leaving shorts on the sidelines and buyers forced to exit the failed breakout. This is what has led to the fast chase into 1577 seen Thursday, just one week following the major reversal off 159175 and into 163350.  Going forward, this breakdown has caught many off guard and many are still not short the market.  This means the downside pressure continues to not allow shorts in and continue to press against next major support levels.  As the market retraces into this old 1593-157075 support range that led to the breakout in May, sell stops are seen below this range under 157075, being the lows late April that developed the support to breakout higher.  Breach of these stops takes the market to test its 100day moving average on the daily chart with next major sell stops being under 153075 as the pivot low in April that led to the 5th wave higher.  Once this low is taken out, then the market confirms the 5th wave is completed and that the move above 1593 is a potential for a failure.  This is the level (1530) one can look for support and to defend the market for a retest back to the 1593-1600 level to see if the market can regain above the level or turn support into resistance to start an abc corrective pattern following the 5 Elliot waves of the first half of the year.  New upside resistance now comes in within 1600-1610, followed by 1620, 1630, and finally 1640.  Move above 1649 is needed to derail the downside momentum and look for a retest of the highs.  Once 153075 fails, we are looking for a bounce into 1600 to create a right shoulder for a head/shoulder topping pattern. This 1530-1685 is a 155 point range which gives room to the downside at 1375.  However first thing is to fill the gap that started 2013 at 1420, followed by the 1375 support level. Thereafter, the market still has a gap from 2012 at 125250 that has yet to be filled. 


ES________Weekly___Week_32_2007___Week_25_2013.jpg


Tags:
Continue reading
1924 Hits

SP500 Johnny 5 Update

Who is Johnny 5?

Latest wave in SP500 1530.75-1685.75:

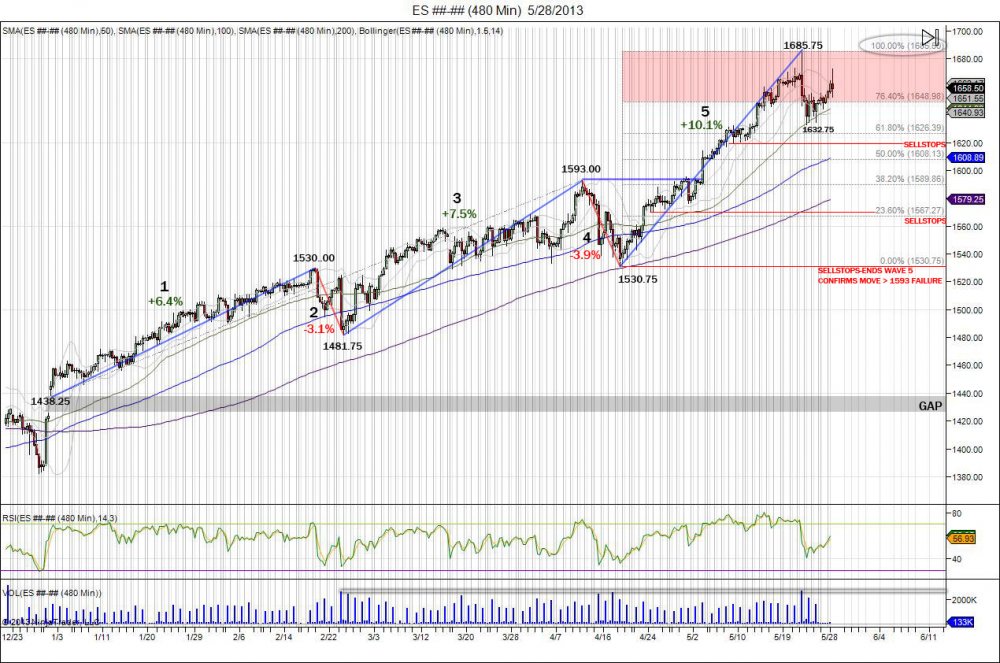
(click chart to enlarge)ES________480_Min___5_28_2013.jpg

SP500 8 hour chart above showing year to date trade.

First 6 months of 2013 = 5 waves:

Wave 1: 1438.25-1530.00 +91.75 6.4%

Wave 2: 1530.00-1481.75 -48.25 3.1%

Wave 3: 1481.75-1593.00 +111.25 7.5%  AVG VOLUME 9,436,701 

Wave 4: 1593.00-1530.75 -62.25 3.9%

Wave 5: 1530.75- *1685.75* +155 10.1% AVG VOLUME 9,344,753


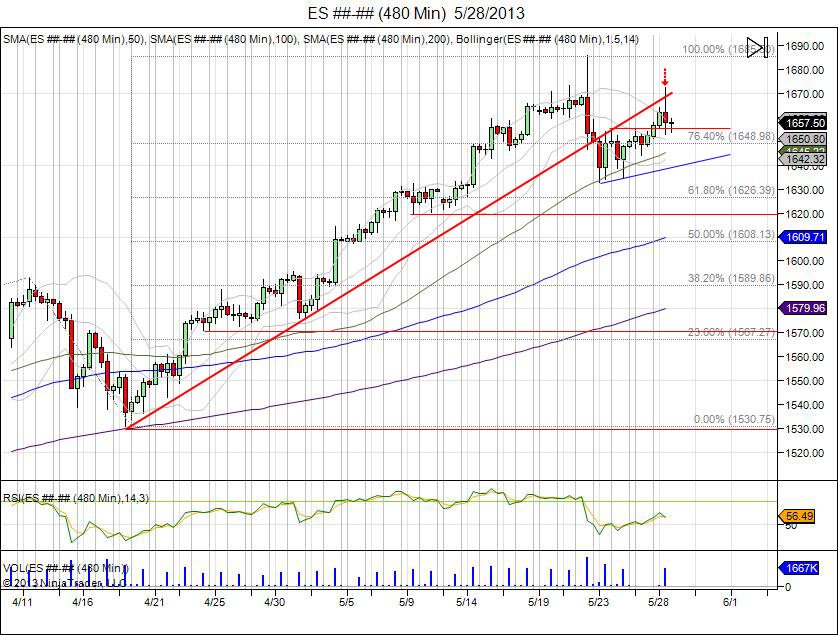
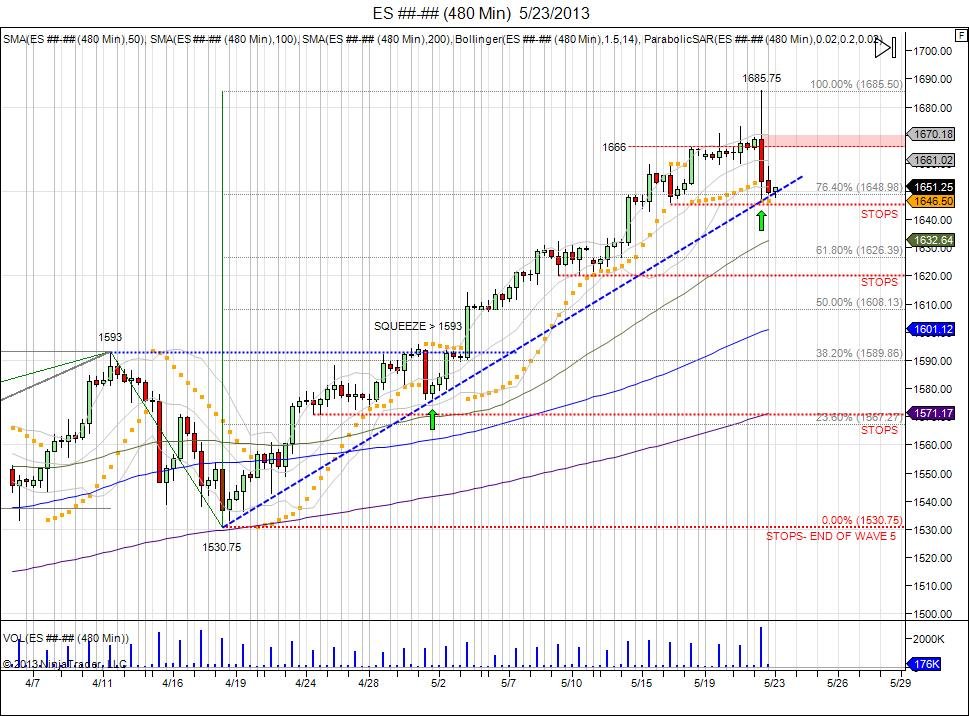
Since blowing through 1593, the chase trade by buyers and short squeeze pushed the market to complete its 62.25 range (1593-1530.75) up to 1656.  This did not stop with the SP500 pushing through this, 1666, and into the top level of 1685.50 to extend the range 100%.  As shorts capitulated through 1673 into 1685, bulls used the bid to take profits into.  This led to a 3% decline down to 1632.75, shaking out the first 1646 level of sell stops.  The move was fast after the bear capitulation as sellers had to now chase.  With market falling into 1630s, bears chasing lows have been grinded out as market has used these bears to run stops above 1655 and into testing the 1670 level being where the SP failed off the high. The move has given more patient bears there chance to get in, now its up to see if they are stronger then this bull.  The bull has support at 1654 and sell stops below 1644.  Sell side gains ground with break of 1644 to retarget the 1632.75 low to confirm move above 1655 was failure.  Buy side needs to hold 1655 to continue pressure to retest 1672.75 from today's failed high.

Below is an excerpt of the 5th wave description in "Wikipedia"

"Wave 5: Wave five is the final leg in the direction of the dominant trend. The news is almost universally positive and everyone is bullish. Unfortunately, this is when many average investors finally buy in, right before the top. Volume is often lower in wave five than in wave three, and many momentum indicators start to show divergences (prices reach a new high but the indicators do not reach a new peak). At the end of a major bull market, bears may very well be ridiculed" (Source: Wikipedia - Elliot Wave Principle)

Ofcourse, this looks exactly like text book, wave 5 everyone is bullish, average investors forced to chase above 1593, and volume thus far has been lower then the 3rd wave. The 5th wave momentum continues until the pivot low of 1530.75 is taken out to confirm move above 1593 was a failure.

Same chart above, zoomed into last wave 1530.75-1685.75 (click chart to enlarge):

ES________480_Min___5_28_2013a.jpg

Continue reading
5089 Hits

SP500 Maxes 100% Fib and Reverses

ES________480_Min___5_23_2013.jpg

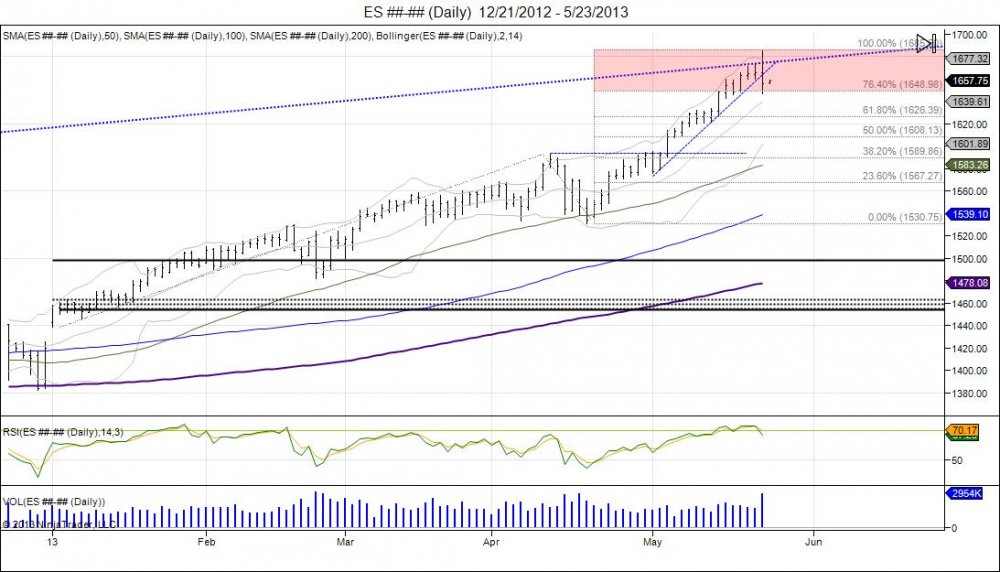
As soon as the SP500 hit its 100% Fib extension level of 1685.50, sell programs kicked in as the SP500 printed highs of 1685.75.  The move occurred after a squeeze through previous highs of 1673, seeing shorts capitulate which gave way to the 1685 print.  Smart longs sold into this bid to take profits. With longs taking profits, shorts already being stopped, the market fell down to retest its open. After trying to retest the highs and failing to find buyers at 1681, the market fell off to take out its session lows to reverse the intraday trend as more longs locked in profits and short sellers sat on the sidelines looking at the market drift lower.  With shorts out the market, this created a chase to the downside into 164650 to retest the pivot low of 1646 made last Thursday prior to Friday's move into 1665.75. A 40 point rejection off the top level of 1685 and a press to test the downside resistance range at 1656 to see if that old resistance acts as new support for a retest of the mid level at 1666-1670.  This has raised the stakes for bears as the range to defend has widened.  Failure to hold 1646 sees more shorts left on the sidelines and a wider range (40) to defend the high.  Market remains in its 5th wave that began on the breach of the old 1593 highs with a pivot low of 1530.75 occurring during the "4th" corrective wave.  As market moved past 1593, buy side chased and shorts squeezed from the 1593-1530 giving way into 1656.  Sell stops have built along this wave 1530-1685 below 1646, 1620, 1607, 1570.75, and ultimately the 1529.50 low from Cyprus.  Wave 5 ends on a breach of that pivot low that began the wave at 1530.75.  With that taking place, a confirmation will then be made that the move above 1593 was a failure and an "abc" corrective pattern can be seen should the market be able to bounce after breaking 1530 to retest the 1600 level and see if it can get back above. 

ES________Daily___12_21_2012___5_23_2013.jpg

See: "SP500 Wave 5 How High Will It Go"


Continue reading
3656 Hits

Volatility Index 13 Level


Tags:
VIX
Continue reading
3224 Hits

Bonds, Stocks, and the YEN


ZB________Daily___3_13_2012___4_28_2013.jpg

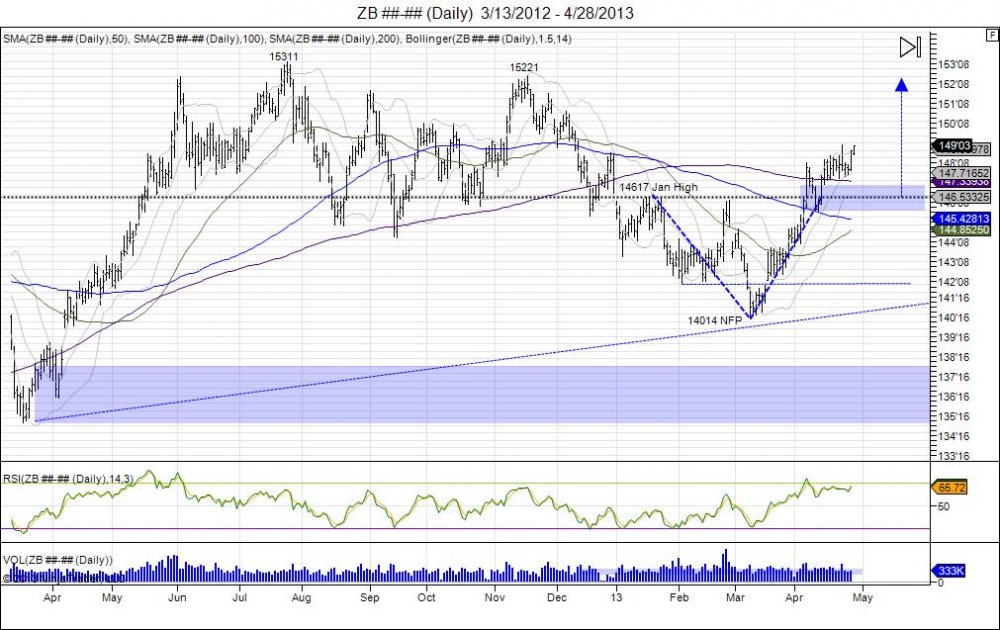
The 30 year bond has consolidated above 14617 in an effort to hold above the year highs after seeing a massive short squeeze that reversed the market from the year lows of 14014. Squeeze was fueled by shorts as the market broke below the February lows on the March NFP release to put in these lows, the market saw a recovery the following Friday going into the "Cyprus bailout".  Cyprus news led to gap above 14200 turning level into a failed breakdown as market continued to force shorts to cover until the year high was taken out. The move caught many off guard and in turn cleared out shorts in the market. By holding above 14617 the market now tries to build a base of support to attract buyers that neglected bonds for stocks earlier in the year.  The market sees major resistance against 14923. Taking the range of 14617-14014, gives way to push toward 15221 high from November.  Just as the Yen tries to target its November gap.   


  6J________Daily___8_28_2012___4_28_2013.jpg


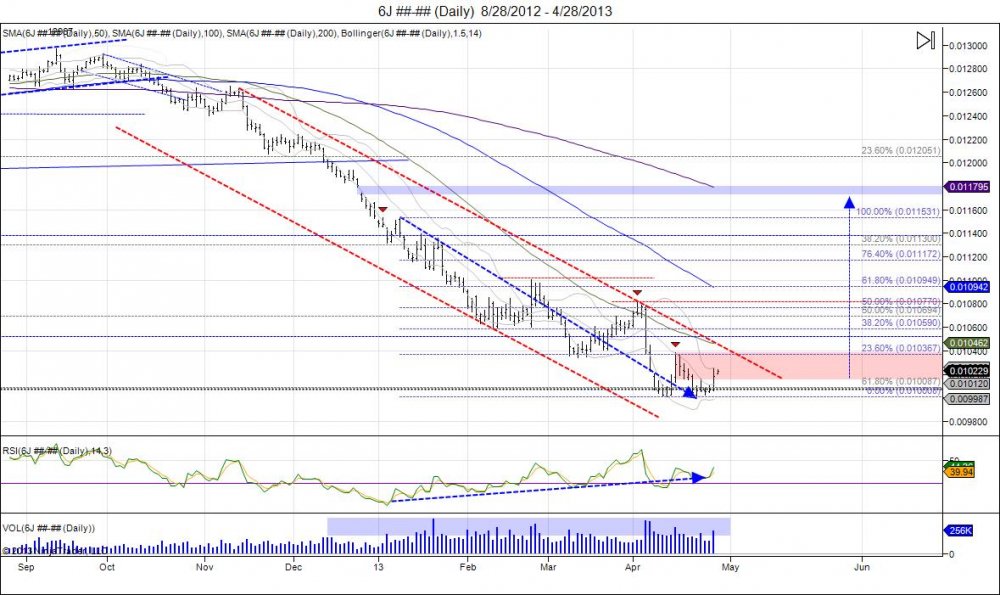
Yen and SP500 show almost exact contrast comparison.  As Yen tries to double bottom in April, SP500 is trying to double top.  The Yen made lows of 10008 and 10013 before squeezing through 10158 last week.  This level has turned into a new area of support should the double bottom be good. Holding above 10150 gives room to force shorts to cover to give room to take out April 15th's 10383 high with next major level of stops above 10809 from April 2nd highs. Above 10809 confirms double bottom against 100 to give way for a massive short squeeze to target the year highs at 11531 and give room to fill last November's gap at 11790. During the past 4 years the Yen has had a tendency to bottom during the Spring months. 


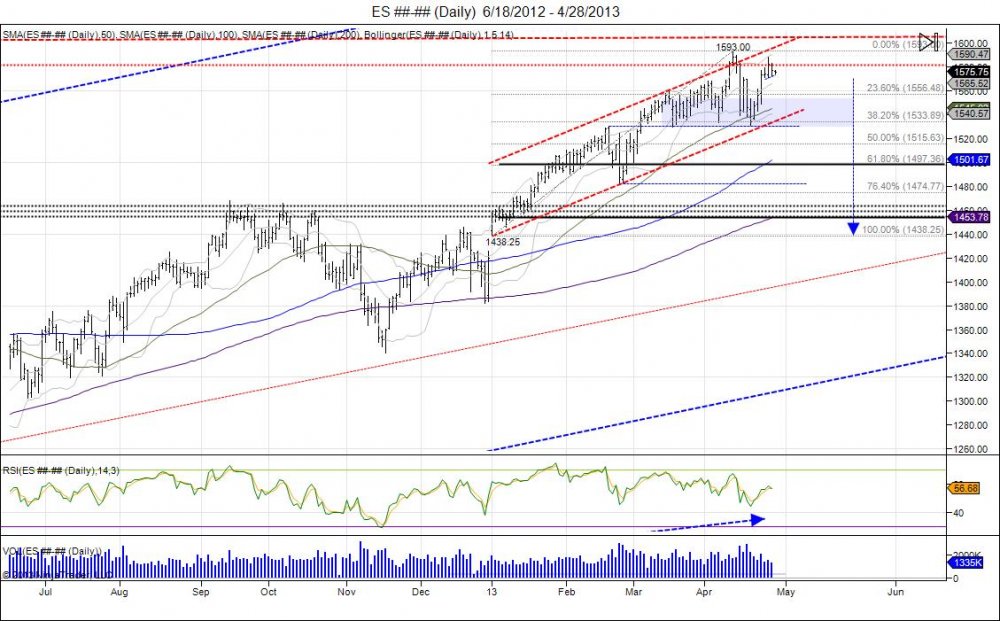
ES________Daily___6_18_2012___4_28_2013.jpg

In contrast the SP500 has a small double top as market most recent reversed from 153075 to retest 1593 by making a high of 158825.  As the market hits it's head against this resistance it has managed to hold above 1570 to create a very tight trading range. Move past 1588 is needed to retarget 1593 for stops.  Break of 1570 gives way to test support at 1555 based from the 153075 pivot low.  Taking out this low would confirm the double top to give way to cross the "line in the sand" from the Cyprus lows of 152950 which have held like a rock.  This is line in the sand, just as 108 is the line in the sand in the Yen and 14617 was in bonds.  In contrast to the Yen with the gap at 11790, the SP500 has a gap down to 142575. 

Continue reading
3388 Hits