Chicagostock Trading

Chicagostock Trading

SP500's Trouble with 2665 and Thursday's Vol Windows Defined

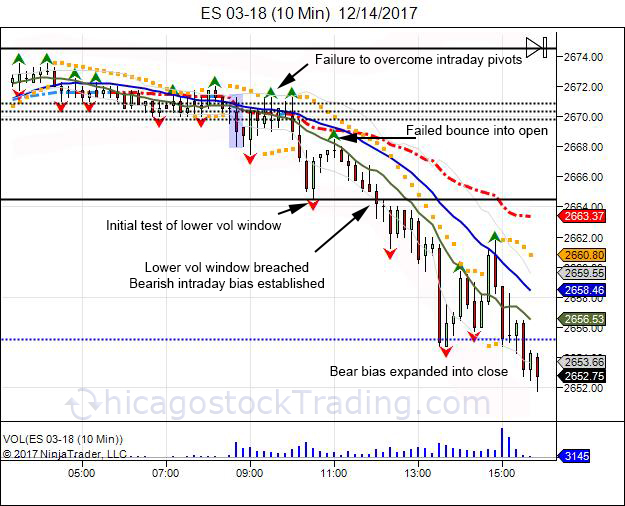
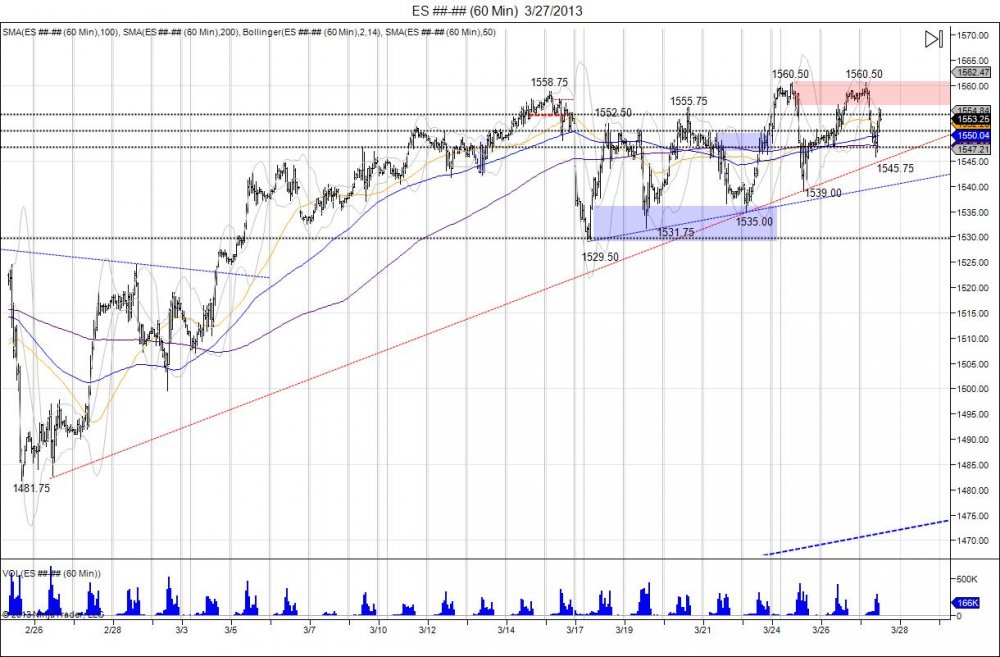
On Thursday, the day after the FOMC statement, we review the intraday action in regards to Chicagostock's Volatility windows and pivots.  The highlighted blue box, is the cash market open, NYSE 930 AM.  After the open, the cash market had trouble overcoming the intraday pivots, seeing the range act as resistance.  This led the market to fall into the lower Vol window which was met with a defensive bounce.  The defensive bounce gave way for a retest of the open, giving sellers an area to defend and buyers major resistance to overcome.  For buyers that picked up the initial test of the lower Vol window, this provided a bounce to take some profits into.  Second or third attempt at the lower Vol window, increases the odds of seeing the level failing. After failing to overcome the opening range, the market drifted back toward the lower Vol window which was taken out. In order to establish a bearish intraday bias, a 5 minute hold below the lower Vol window needs to be seen.  Sometimes the market can establish a bias, and bounce back to the open to again force sellers to defend their intraday trend.  In this case, the second test of the lower Vol window saw the level taken out, establishing a bearish intraday bias.  Since there was already an early bounce off the lower Vol window, there was not another one and sellers expanded the market lower, forcing longs to liquidate into the close. 


Continue reading
2481 Hits

Is This the Top?

Last week, we highlighted the inverted head/shoulder technical pattern that was created after the market made new lows for the month in November and caught new shorts on the hook.  This inverted head/shoulder pattern, gave room to expand the market above the neckline of 258950 up to 262350.  The target was met on November 28th, with the market hitting a high of 2627.  


Continue reading
2701 Hits

How Does the Ali Baba Top Differ from 2011's Bin Laden Top?

 05_22_jpg.jpg


The recent reversal in the SP500 has reminded us of a similar time the charts and reversal felt and looked the same.  The above chart is from 2011.  As seen the market made an early high of 1335 in February, correcting down to 1241 before rallying back to new highs.  New highs were made on what was called the "Bin Laden" high. On the news of his capture, the SP printed the highs for the year at 1373.50 and turned lower to retest the previous 1335 lows made in February.  This retest was followed by a "U" shaped reversal that recovered back to where the market failed at 1348 on the 1st of June.  This reversal failed to stabilize and push through the highs, leading into what developed the right shoulder for the 2011 head/shoulder top and crash down to 1080 that was fueled by the debt downgrade.  QE 2 ended in July 2011, just as QE 3 is expected to end 10/29/14. 


Continue reading
3671 Hits

The Ebola Swan- SP500/Yen Market Review


Futures, foreign currency and options trading contains substantial risk and is not for every investor. An investor could potentially lose all or more than the initial investment. Risk capital is money that can be lost without jeopardizing ones financial security or lifestyle. Only risk capital should be used for trading and only those with sufficient risk capital should consider trading. Past performance is not necessarily indicative of future results. Video content hosted by third party.

Continue reading
2854 Hits

Why Stocks are Lagging

05_22_jpg.jpg


As the NFP rate creeped toward the Fed's 6.5% target, the bond market acted ahead and as it closed 2013 on the lows, it started 2014 on the lows, only to fail in moving lower and squeeze higher during the month of January. This upside reversal caught shorts by surprise as it squeezed the market from 12723 to 13503 to stop against major resistance from October of 2013.  The reversal into this resistance squeezed out the short side, however for the next 3 months the bond market stabilized sideways to consolidate the reversal and in turn develop a base or in technical terms an inverted head/shoulder pattern from February to April. With April's low retesting March lows and holding, this saw a push back to breach the 3 month highs and confirm the inverted h/s pattern. The coiled pattern once again left shorts selling the market trapped and with the breakout above the 3 month high, this gave fuel to expand this inverted h/s target and squeeze out October 2013 highs. This was done in May, confirming the lows of 2014 as a failed breakdown and a reversal in trend. So far since the October highs being taken out, this has led the bond market to further squeeze another 4 handles as late buyers now come in after the confirmation and chase the market up.  Going forward, major resistance is being tested from June of 2013 in the bond market with new buyers chasing prices above last October's highs. A move through 14028 squeezes this resistance level and retraces the bond market 50% from its 2012 high to its 2014 low. A break below 13606 reverses short term upside momentum to shake out longs chasing the market and give way to test downside support at old resistance 134, followed by 129 as major support off the year lows.


05_22_jpg.jpg


The Yen also started the year on the lows and reversed higher during the first month of 2014. This caught the market off guard again, squeezing out the short side with the move from 9486-9926.  Since this January upside squeeze, the Yen, as the bond market, went into a sideways consolidation period as it turned lower, however held above the January lows to keep shorts trapped. The consolidation and coiling led to an inverted head/shoulder pattern just as the bond market, with a squeeze in May to break above the neckline of 9870 and reach its 200day moving average for the first time since November of 2013. In contrast to the bond market, the Yen has had much more difficulty in expanding this range and seeing new buyers chase the market at these levels. For now investors are favoring the hedge of stocks into the bond market. Eventually this should rotate from bonds into yen and gold. Short term, the Yen remains in an uptrend with a target of 10150 to expand its 3 month range. Failure to hold the May low gives way to retest the April lows.

Continue reading
2671 Hits

Pulling the 6.5% NFP Target

Since the December 2012 FOMC statement adding the 6.5% unemployment target to the fed funds rate:

1-8-12b_1.jpg

Bonds, Gold, and the Yen (BGY), all front ran the FRB NFP target, moving down heavily for the year 2013, while the SP500 moved up 33%.


In 2014, just as the NFP target reached 6.7% to near the 6.5% target, it was pulled.

Year to date for 2014:

Bonds, Gold, and the Yen, working against a major downward trend last year falling an average of 20.3%, all started the year of 2014 on the lows and grinded higher. This reversal for 2014 is counter to the 2013 trend, however is the way of the market completing its front run into 6.5% target.  The SP on other hand, coming off a +33% move in 2013, has held flat for 2014, threading on the highs, fighting to hold its trend versus what bonds/gold/yen are doing.  The SP is also needing to take a lot of juicing at these levels as the FRB chair came out on the 31st of March to reassure investors of continued support, WHILE THE MARKET WAS AT ALL TIME HIGHS! Seems to be the last leg of longs are being lured into the market and we did see since March 31st the market ran 20 handles higher into 189250 only to fall 90 lower.


1-8-12b_1.jpg

Thus far both of the last 2 NFP reports turned out to be the peak highs of the year and provided great trading opportunities. Join us for next NFP report by subscribing today.

Continue reading
872 Hits

SP500 & Yen

1-8-12b_1.jpg

As seen above, the SP500 has enjoyed higher lows and higher highs ever since its biggest correction of the year.  This correction attempt started in May, dropping the SP from 168575-155325, 7.9. Since then, we have been in this trend where higher lows have been made as pullbacks become shallower with buyers chasing the market up, and higher highs as shorts have been squeezed with the market taking out the previous highs.  Anytime someone is forced to chase a market, it never ends well. The latest squeeze came as the market pivoted off 1640 and ran in the face of a government shutdown and the constant debt ceiling debate.  With the September highs taken out, highs of 175450 were made this week on the NFP number release, pushing the market above its rising wedge, and testing fib extensions of 1740-1749.  Wednesday attempted to see a pullback only to see the market saved as it held 1736 which has the market back to pressing the highs of the week.  This is consolidation taking place as the market attempts to take a breather, yet continues the pressure against shorts and forces buyers to pay up.  Push through the weekly high sees the next major resistance levels coming in at 1776 as a 100% fib extension, along with 1783 as a 50% fib extension based off the year low to the September high and October low.  Falling below 1736 as a healthy market should, would give way to retest old resistance at 1710 and attempt to build new support. Without this happening, it forces buyers to continue to pay up, which gives way for them to chase these highs and next fib levels to be tested.  The trend of higher lows and higher highs since the May correction has not only seen buyers desperate to buy every dip, but also brought major pain to short sellers in attempt to clear them out of the market before the carpet is pulled from underneath.  The second half of the year remains in a "bullish bias" and any pullbacks down to 1620 would give buyers a major area to support this bias and keep the momentum. The question is if there will be any buyers left after the market has forced them in with this rising wedge.  It will take a period of 7 closes below 1620 to reverse the bull bias and give way to target the June lows for the rug pull and move to fill the gap that began this year down to 1420s.


1-8-12b_1.jpg


As the SP500 hit a top in May and pulled back, the Japanese Yen in contrast hit a low and squeezed 10 handles off the low.  This was followed by a pullback to retest the lows, and ever since then, as equities have gone higher, the Yen has traded sideways and compressed as the 200day moving average on the daily chart has caught up.  Since the Yen's original move was from 126 - 96, it is in a bear trend and this sideways action is consolidation of the trend and an attempt to reverse or see continuation of the trend.  Currently, the Yen is retesting the October highs of 10357 that rejected the test of the August high.  As this spring is compressed, a move above the October high gives way to reclaim 104 and force shorts to cover, giving way for a retest of the June highs at 10663.  Reclaiming these highs gives confirmation of a reversal in this bear trend and sees room up to 118 to fill the gap created in November of 2012, just as the SP500 has it's gap of 1420 from December of 2012.  Recall the Yen attempted to bottom out at 10340 in March, only to see the Bank of Japan come out with new stimulus that derailed the reversal attempt and slammed the market into new lows down to 9640 printed in May.  The squeeze in June led to the BOJ announcement levels which was rejected. This is a major level as a recovery above this is a recovery in the Japanese Yen. Bottom line, for the week, need to see buyers sustain current bid to see new buyers step in next week and close above 104 to squeeze shorts. Failure to hold above 104 and break of 100 sees a retest of the May lows.

Continue reading
3022 Hits

Yen and Dow Seasonal Since 2007

YEN6J________Weekly___Week_42_2007___Week_18_2013b.jpg


DOWYM________Weekly___Week_40_2004___Week_18_2013b.jpg

Continue reading
2861 Hits

Japanese May Flowers = Equity May Showers

6J________Daily___9_21_2012___5_2_2013.jpg

Yen is trying to round out a bottom. After retesting lows and not breaking, the Yen is back to retesting where it failed from April 15th with highs of 10383. This has led to a pause in the market as it consolidates builds support to continue the pressure against this level.  Support is seen down to 10150 ever since the market squeezed the level and turned on the short squeeze. Squeezing above 10383 confirms double bottom and gives room to target 10883 from where the market failed early April as the Bank of Japan came out with stimulus, derailing the March bottom attempt. By coming back to this level the yen will have rounded out a bottom from 108-100-108, leaving shorts who sold the BOJ stimulus wrong. This will turn the level into support as the market will also retrace 50% of the year highs 11531-10008. Recovery above 108 will attract buyers to press the gas against shorts to target year highs of 11531 and fill gap up to 118 from November. 

During the past 4 years the Yen has had a tendency to bottom during the Spring months. 


Equities were squeezed to new highs on the last day of trading in April as equity shorts threw in the towel.  This led the Emini SP500 to take out the previous high of 1593 and put in new highs of 159550. Nasdaq completed the squeeze of taking out last year's highs of 287175.  To start May, equities reversed sharply off the highs to close below Tuesday's lows.  These lows now act as major resistance and what buyers need to overcome to retest highs. On the ES daily chart, the breakdown setup an outside bar bearish reversal, by opening above previous day making a higher high and closing below previous day's lows. The breakdown was fast and sharp as shorts had already thrown in the towel the day before, so they were left behind, having to come back and offer the market down as they chased back in. This gives way for the SP500 to test support down to the mid 1550s of where the market broke out after putting in a 153075 low in April as sellers failed to break the Cyprus 152950 low.  Shorts have already been cleaned after failing this breakdown and ralling to take out the highs and squeezing them out.  Coming into this range of support allows buyers opportunity to defend and continue the upside momentum.  Failure to hold and breach of 153075 confirms a double top with room to target the year lows.  Once the SP500 takes out the year lows, prices above 1440 will not be visited for a long time. A Yen short squeeze will put pressure to make this break take place.

On Wall Street, the old saying is the markets like to climb the wall of worry, and they have surely done so this year moving higher in the face of all negativity along with two attempted breakdowns in February and April. These are what we call "cracks". We like to say the market climbs higher on glass stairs. Reason being is ever since the 08 crash and 09 bottom at 665.75, the market has been VERY fragile and on life support through the Fed.  As we have seen, the glass stairs have been broken several times since the ride from the 09 lows and each started with cracks first before falling through violently, flash crash and debt downgrade in 2011.  The recent February and April corrections were the first cracks in this latest climb of glass stairs.


The Ultimate Short Squeeze 665-1441 & Accurately Predicting Every Correction Using Technical Analysis


ES________Daily___6_14_2012___5_2_2013.jpg

Continue reading
1224 Hits

Bonds, Stocks, and the YEN


ZB________Daily___3_13_2012___4_28_2013.jpg

The 30 year bond has consolidated above 14617 in an effort to hold above the year highs after seeing a massive short squeeze that reversed the market from the year lows of 14014. Squeeze was fueled by shorts as the market broke below the February lows on the March NFP release to put in these lows, the market saw a recovery the following Friday going into the "Cyprus bailout".  Cyprus news led to gap above 14200 turning level into a failed breakdown as market continued to force shorts to cover until the year high was taken out. The move caught many off guard and in turn cleared out shorts in the market. By holding above 14617 the market now tries to build a base of support to attract buyers that neglected bonds for stocks earlier in the year.  The market sees major resistance against 14923. Taking the range of 14617-14014, gives way to push toward 15221 high from November.  Just as the Yen tries to target its November gap.   


  6J________Daily___8_28_2012___4_28_2013.jpg


Yen and SP500 show almost exact contrast comparison.  As Yen tries to double bottom in April, SP500 is trying to double top.  The Yen made lows of 10008 and 10013 before squeezing through 10158 last week.  This level has turned into a new area of support should the double bottom be good. Holding above 10150 gives room to force shorts to cover to give room to take out April 15th's 10383 high with next major level of stops above 10809 from April 2nd highs. Above 10809 confirms double bottom against 100 to give way for a massive short squeeze to target the year highs at 11531 and give room to fill last November's gap at 11790. During the past 4 years the Yen has had a tendency to bottom during the Spring months. 


ES________Daily___6_18_2012___4_28_2013.jpg

In contrast the SP500 has a small double top as market most recent reversed from 153075 to retest 1593 by making a high of 158825.  As the market hits it's head against this resistance it has managed to hold above 1570 to create a very tight trading range. Move past 1588 is needed to retarget 1593 for stops.  Break of 1570 gives way to test support at 1555 based from the 153075 pivot low.  Taking out this low would confirm the double top to give way to cross the "line in the sand" from the Cyprus lows of 152950 which have held like a rock.  This is line in the sand, just as 108 is the line in the sand in the Yen and 14617 was in bonds.  In contrast to the Yen with the gap at 11790, the SP500 has a gap down to 142575. 

Continue reading
3389 Hits

April Showers Bring Yen Flowers?

6J________Monthly___11_1997___4_2013B.jpg


6J________Weekly___Week_48_2006___Week_17_2013a.jpg

The Yen's failure to take out 13264 in 2012 and build of a right shoulder at 12967 that led to the neckline of 11879 to be broken, has now surpassed it's head/shoulder target of 10494 as the market broke below the May 08 lows during the "flash crash".  The break below this has seen the Yen's breakdown extend into a 61.8% retracement of the 2007-2011 move from .008123-.013264.  This has cretaed a period of consolidation as the market now fights to hold this .0100 level.  As we see on the weekly chart, RSI extremely oversold and volume extremely higher.


6J________Daily___1_18_2012___4_23_2013a.jpg

Looking at the daily chart, since the beginning of the year with the Yen breaking down, the RSI conversely has moved higher. All this on extremely high volume. This divergence gives way for the idea a bottom may be taking place and a massive short squeeze can be coming. So we will look at the numbers. First we remain in a major downward channel since the right shoulder was made up at .012967. As the Yen failed to hold onto March's lows at .010340, this led to a drop into the 100 level with lows of .010008. The market bounced off this level right into retesting the March lows which have turned into resistance.  This has led to another retest of the .010008 lows as the market fell into .010013 this week. Pressure is being placed to retest these lows and see if the market can flush below to attract new sellers and shake out new buyers of these levels.  Major resistance is now within the .010150 up to the .010383 April high that failed at the March lows.  Squeeze through this is needed to spark the short suqeeze and give way to test upside retracement levels based on the year high of .011522 with a 50% retracement coming in at .010765 level.  Should a short squeeze trigger into the 50% level, at this point a move through the year highs would give way to fill the gap from last year at .011804 from December 24th.  Failure to hold onto the .0100 level gives way to pressure against .009867 from April of 2009 with next major support coming in at .009231. Since that low of .009867 in April of 2009, every major low has been made in April or within a month apart. The question will be if the .0100 level is held before a squeeze or a flush followed by a reversal. 


Tags:
Continue reading
4362 Hits

SP500, Bonds, Yen, Euro Chart Updates

 SP500

ES________60_Min___3_27_2013b.jpg

Since the gap down two Sunday's ago on the Cyprus news and bouncing off the old highs from February at 1530, the market has gone into a major tug of war whipping short sellers who have tried to come in following the news.  The "plunge protection team" has managed to keep the momentum alive with higher lows.  Just 1 week after that gap down, the squeeze managed to print new highs on the year at 1560.50. Following this new high,  another pullback was seen to retest the prior low of 1535 only to see another higher low develop at 1539.  On Tuesday this led to a recovery that retested and pressed against resistance based off the Sunday high.  This has led to the market climbing back Tuesday night and retesting the 1560.50 level with the market tapping it again, however failing to breach.  Thus far this has led into another pullback, retesting the previous lows of 1539 with lows of 1545.75.  Higher low again as the range tightens and the market builds buy stops above the highs going into the holiday weekend. Sell stops also building below this trend of higher lows and they will be targeted eventually, question will be if momentum can stay alive into the holiday weekend as the range is now 154575-156050.  Resistance met against 1558 with stops above 1560.50.  Support  1548-1539. Bonds as shown below have continued to hold their bid following the Cyprus gap above 14200 and this has led to tap the March highs of 14429.  The squeeze eventually completes on a move past the February high of 14611 to confirm the break below 14200 as a failure.

Continue reading
3465 Hits

SP500 Double Top Caution

 ES________120_Min___3_25_2013.jpg


Last Sunday's breakdown to 1529.50 on the Cyprus news saw the market bounce off the old February highs of 1530 with lows of 1529.50.  This led to a roller coaster ride for the week as the market climbed back to 1552.50, fell down to 1531.75, squeezed back to 1555.75, fell back to 1535.00, and most recently completed the pattern of higher lows and higher highs by getting up to 1560.50.  This was a calculated attempt to defend those lows and make higher highs to squeeze out small sellers.  The latest high was done this Sunday night (one week after the gap down from 1544-1529.50), stopping out small shorts as the previous year high of 1558.75 was taken out.  The market has thus far rejected this new high and fallen down to where the it opened on Friday.  There is major risk now that this higher high turns into a failed breakout and a double top should buyers failed to defend the most recent pivot low of 1535.00.  Minor support off these lows are seen at 1539, however buyers should find it much harder to hold this trend and the lows of 1535 after new highs were set at 1560.50 which give much more pressure to take out these rising lows and squeeze out buyers.  This would confirm the new highs as a failure a double top with a breach of 1529.50. As discussed in the previous video, the market has been working on creating a head above 1530 for a head/shoulder topping pattern which confirms on a move below 1481.75.  


Continue reading
2531 Hits

Yen Gets Down to Tgt Zone

 6J________Weekly___Week_49_2009___Week_42_2012.jpg


6J________Weekly___Week_8_2010___Week_6_2013.jpg


The Japanese Yen has come a long way since putting in it's right shoulder of 12967 in September of 2012 and breaking its neckline of 11879 in December.  This this breach of the neckline, the market has been in a downside chase in a hurry to complete its h/s target of 10494. Target is used by taking range 13264-11879=1385 and subtracting this from 11879 to give 10494.  Lows of 10633 were made this week as the Yen has retraced back to the flash crash levels of 2010.  The opening in May was 10650 which has provided some support at this time with lows of 10532 as seen on the weekly chart. An attempt to bottom out is being made here however major stops remain below this 10532 low from May of 2010 so any buying at these levels is aggressive and most likely short covering.  First level of support comes within 10730-10760 as a range aggressive buyers can defend with small stops below these most recent lows of 10630. First level of upside resistance met within 10960-11075, followed by 11090-11396.


Continue reading
2602 Hits

Broken Wings Bonds/Yen

 ZB________Weekly___Week_36_2008___Week_33_2012.jpg

As seen in the weekly chart above, the 30 year bond has fallen back beneath its long term resistance from the January 09 to the September 11 highs.  The market attempted to hold above however overbought conditions with the new high in July at 15311, the bond did it's best to squeeze as many sellers as possible. Since this high, the market has rolled back beneath its resistance trendline, failing to hold prices above 14900.  The move has brought the market back down to where it broke out May of this year, just as the SP500 clipped the May highs of 1411.75. Stabalization can be seen here, however rallies up to 14900 offer sellers an area to defend with stops above 15311 to look for these recent lows to be retargeted, followed by a test of the year lows at 13505.


6J________Weekly___Week_25_2009___Week_33_2012.jpg

Since the Japanese Yen completed its downside target of 11900 in March of this year, the market grinded back higher, squeezing late sellers, leading to a retest of the year highs and late last year highs.  Over the past several months as the Yen rallied up to 12881, the market stalled and has begun to roll over.  Aggressive sellers have already taken advantage of this move by fading the highs and covering most positions. However looking at the weekly picture, this retest of last years highs appears to be a potential right shoulder of a larger head/shoulder formation.  There is a double bottom at 12416 where a breach of can confirm this right shoulder and see sellers attempt to drive the market down to retest the neckline of 11900 that the market bounced from earlier this year. At that time it was not ready to take out its support of 119-117, thus the short squeeze into retesting the highs. This is the target on the downside with a break below targeting 11375 which retraces the market back to where it broke out during the flash crash of 2010.


Continue reading
3556 Hits

How We Played the Yen

 6J_09_12__60_Min___6_20_2012.jpg


Following last Friday's squeeze into the sellzone in the Japanese Yen, the market opened lower this week, keeping buyers from that squeeze locked in allowing for the market to run lower and test downside support.  Today the market fell into retesting its monthly lows of .012546 with a low of .012558, giving oppurtunity to take some money off the table on the short side, and allow the market to now work this support.  If this downside is any good, it should be ready to break this monthly low in the coming days and turn lower to retest the .0124 level of where the market broke out late April. Thereafter comes the .011879 low from March, and ultimately the flash crash highs at  .011375. Reversing to take out last week's highs of .012737 gives room to retest the .012881 June 1 high.

Continue reading
2804 Hits

Japanese Yen Sell Zone

 6J________Weekly___Week_6_2010___Week_24_2012.jpg

Since the Japaense Yen broke its neckline of .012582 late February, the market completed its downside target by falling into its support range of .011931-.011697 from April of 2011. Since this completion of its downside target and test of support, the market has grinded higher, squeezing out sellers and retracing back through its broken neckline.  Most recently the market spiked to .012881, hitting the top of its rising channel from the lows put in March 2012.  Since this spike high the market fell back into its neckline of .012582 which has acted as support.  Going forward, retracements into this spike high offers sellers a level to defend with stops above this high. Objective is to fall back below the neckline of .012582 and retest the March lows only this time to fall through and into the next major support which is .011375 from the flash crash highs of 2010.  Moving through .012881 gives room into next major resistnace being .013030 and a move through .013160 is needed to regain the bull.


Tags:
Continue reading
4389 Hits

Japanese Yen Back to its Neckline

 6J________Weekly___Week_37_2007___Week_19_2012.jpg

Continue reading
1243 Hits

30Year Bond / Japanese Yen hold hands into completing first downside move.

ZB________Daily___5_23_2011___3_15_2012.jpg

click chart to maximize

more...

Continue reading
2775 Hits

Japanese Yen "Free Fallin"

 6J________Weekly___Week_12_2008___Week_8_2012.jpg


more...

Continue reading
3233 Hits