Chicagostock Trading

Chicagostock Trading

SP500 January 2018 Mirrors January 2016


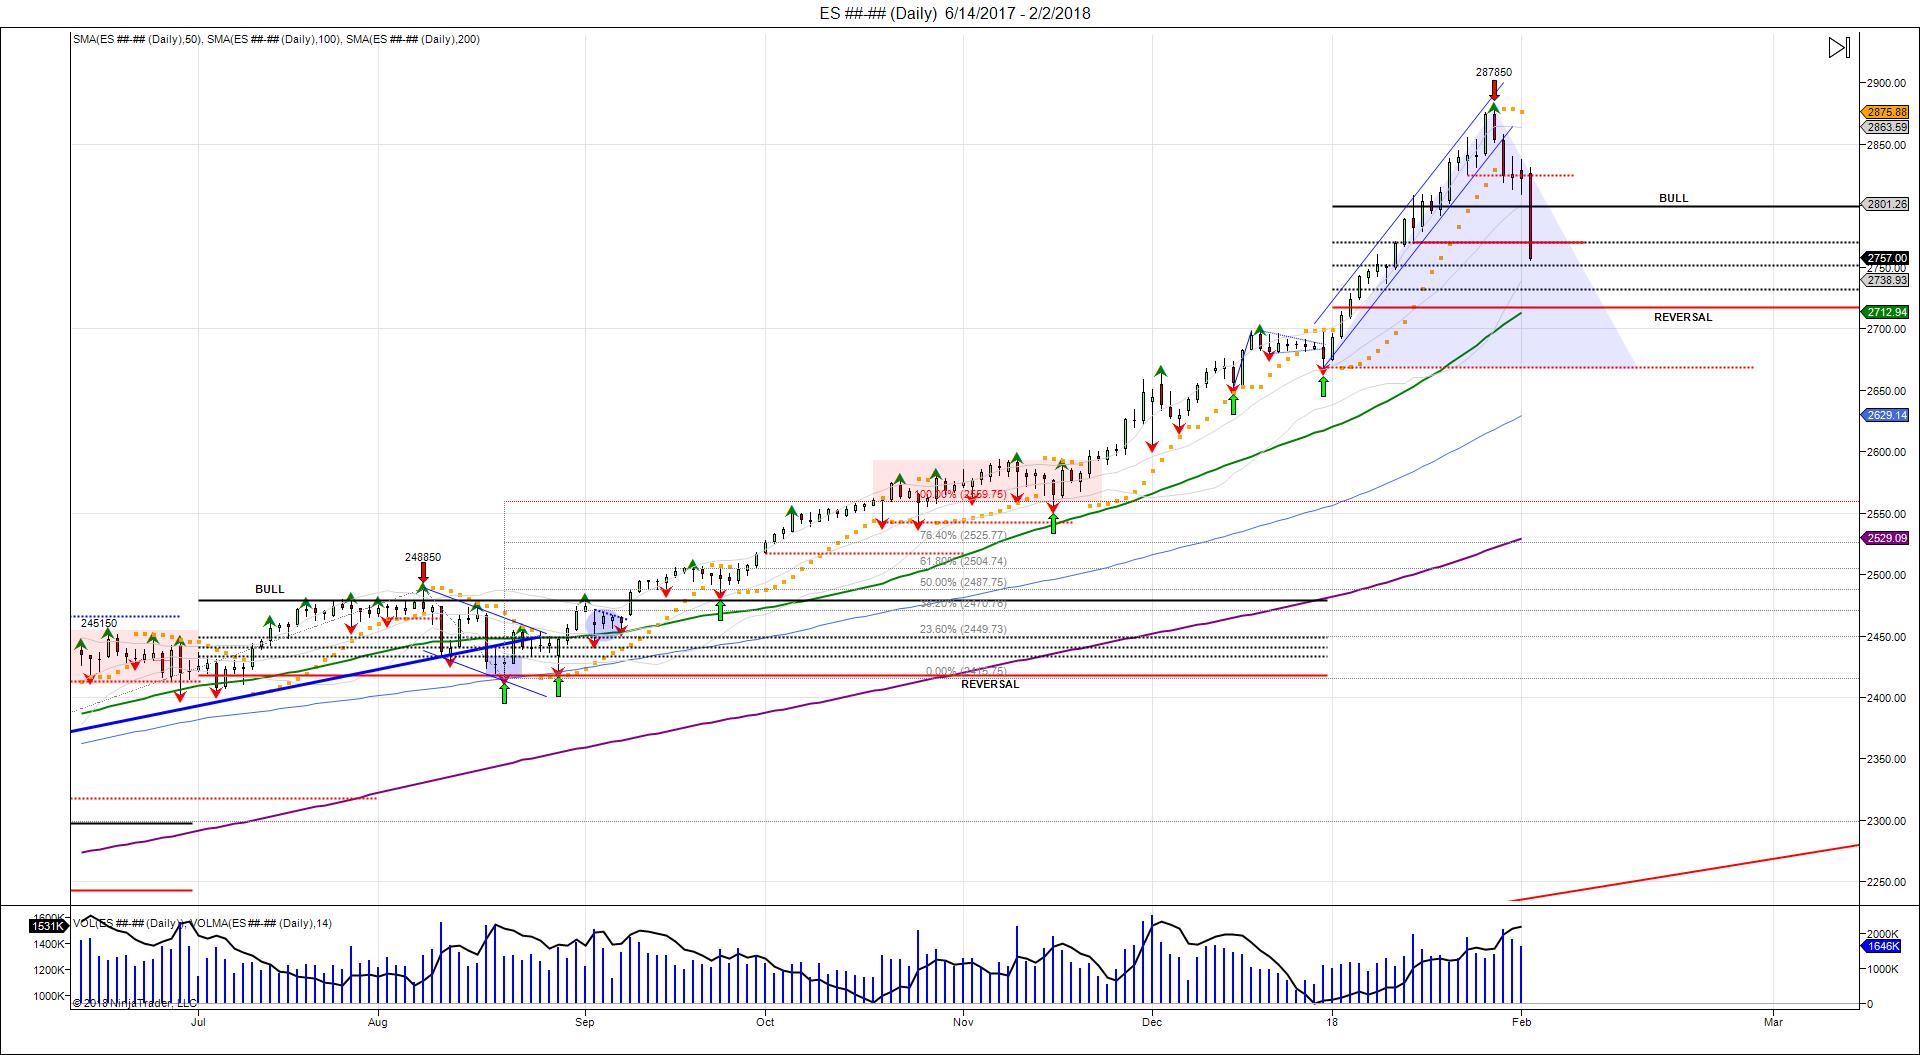
The SP500 started this year, zooming through last year's high and charging up to 2800.  This 2800 level is the 6 month volatility window in which 5 daily closes above established a bullish 6 month bias, forcing buyers to buy the breakout. The bias was established on January 24th, when the market completed its Cup/Handle target created on January 17th, after recovering its prior high of 280850 based off the January 16th low of 276925.  The market expanded this Cup/Handle up to 2846, seeing 2 days of consolidation, before expanding higher on Friday January 26th.  The breakout over the prior ATH of 2855 lured in new buyers, in which were caught when the market fell back under fell back under the January 24th low of 282550.  Over the last 2 days, buyers have fought to defend this level, seeing the market fall back to its Cup/Handle breakout of 2810 in which buyers defended, however were unable to overcome 2840.  Today the cash market opened lower, leaving longs trapped above and forcing sellers to chase lower, giving way to fall back under 2810 and target sell stops below the January 16th low of 276925 that began the move up.  By falling under 2800, buyers who bought the breakout above are now on the hook as the market falls back to test its 6 month pivot of 2751.  Buyers will be forced to defend this level, to prevent further damage, however as the Midcaps are showing, a move below the 6 month reversal window of 2717 and 5 daily closes below, will reverse the 6 month bullish bias into a reversal bias, giving way to expand the range of 211 (2667-2878), down toward 2456, which retraces the market back to test its breakout from September.  Rallies back to 2800-2810 now offers new resistance as supply is caught above, for buyers to overcome and sellers to defend.  Buyers will need to squeeze shorts through the February high of 2837 in order to get another shot at the high.  Failure to overcome 2800-2810, leaves longs vulnerable to see a shakeout under the 6 month volatility window of 2717.

Continue reading
3894 Hits

The Turkey Squeeze - T/A Galore: 2 Inverted Head/Shoulders and a Cup/Handle


 Last week, the market took out the early November low of 256225, falling into 255550, before quickly bouncing back to 257150.  This break of the monthly low turned into a failed breakdown and a head fake as the market retested 2562 into the end of day, creating a right shoulder for an inverted head/shoulder pattern.  Shorts below 2562 were left trapped, giving opportunity to expand the range up to 257150.  


Continue reading
3413 Hits

2016 Top 5 Trends

In no particular order, here were the top 5 major market changing trends of 2016 identified by Chicagostock:

1- DOW JONES CUP/HANDLE TARGET 20K
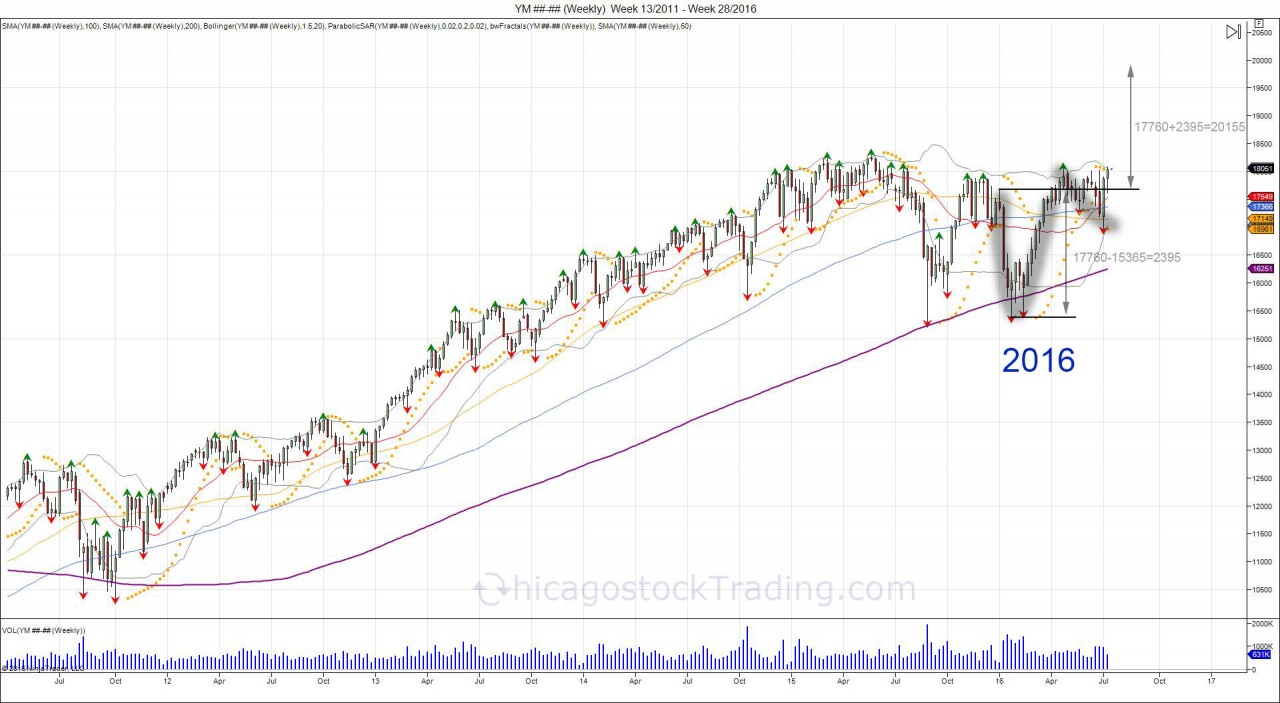
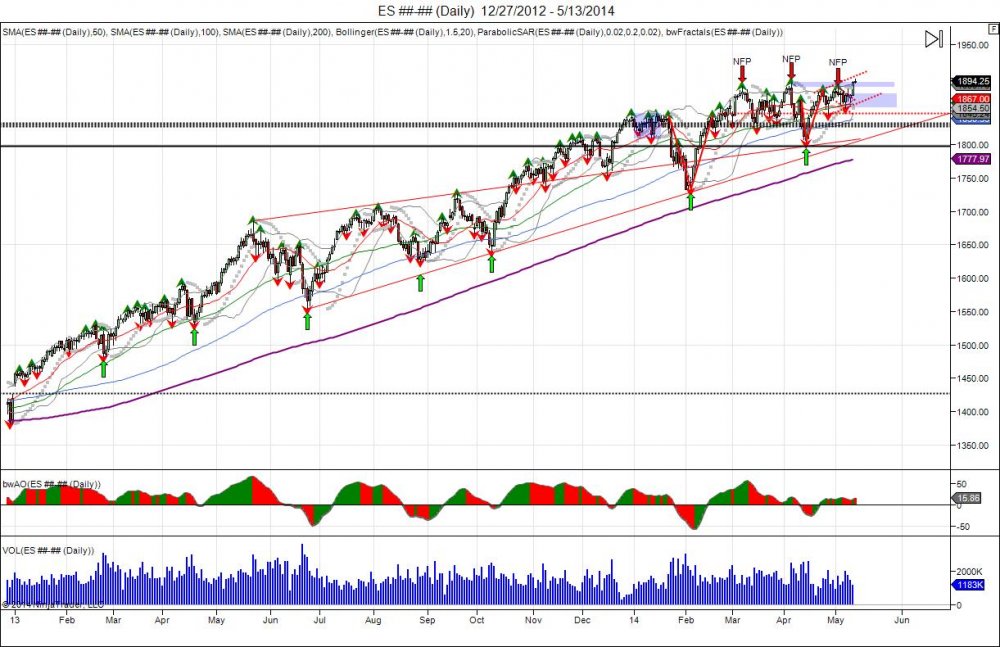
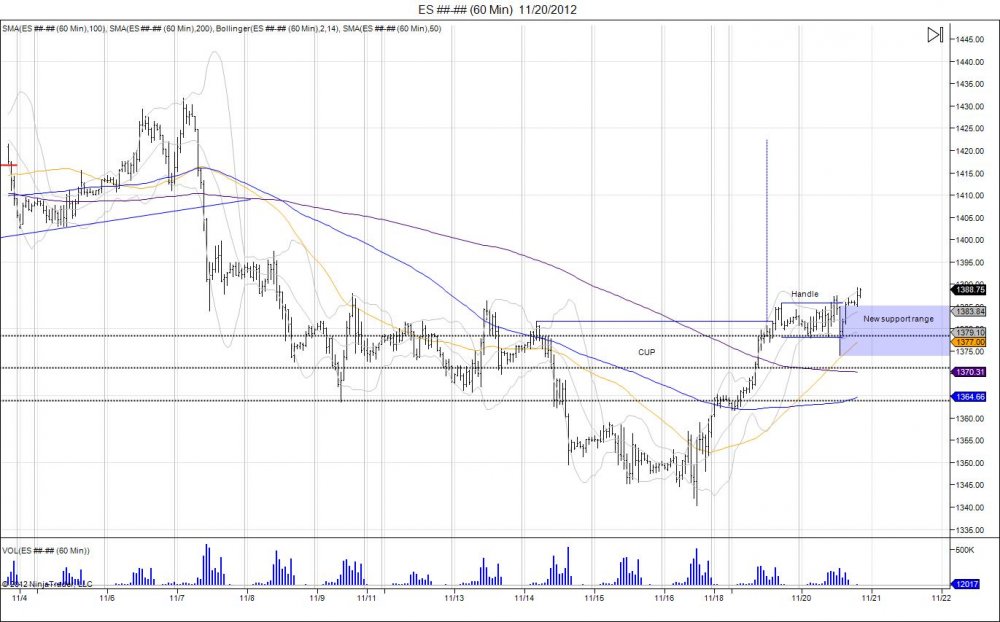
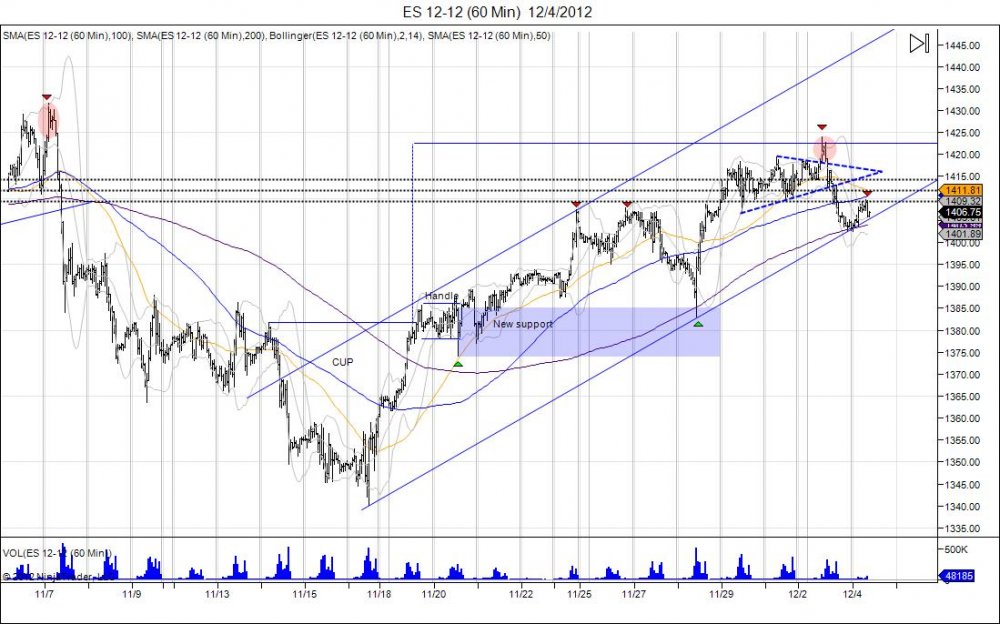
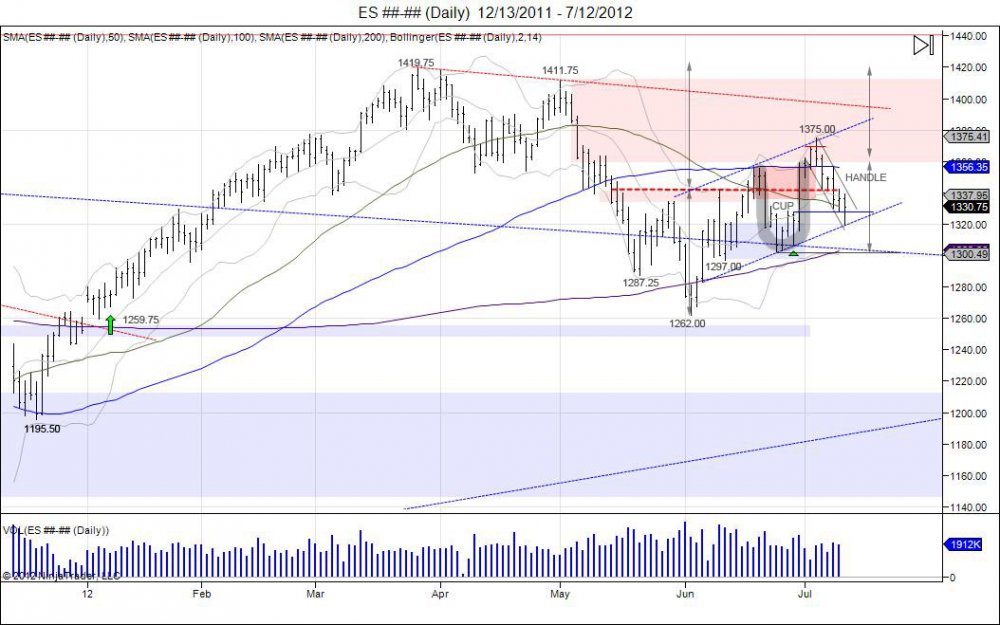
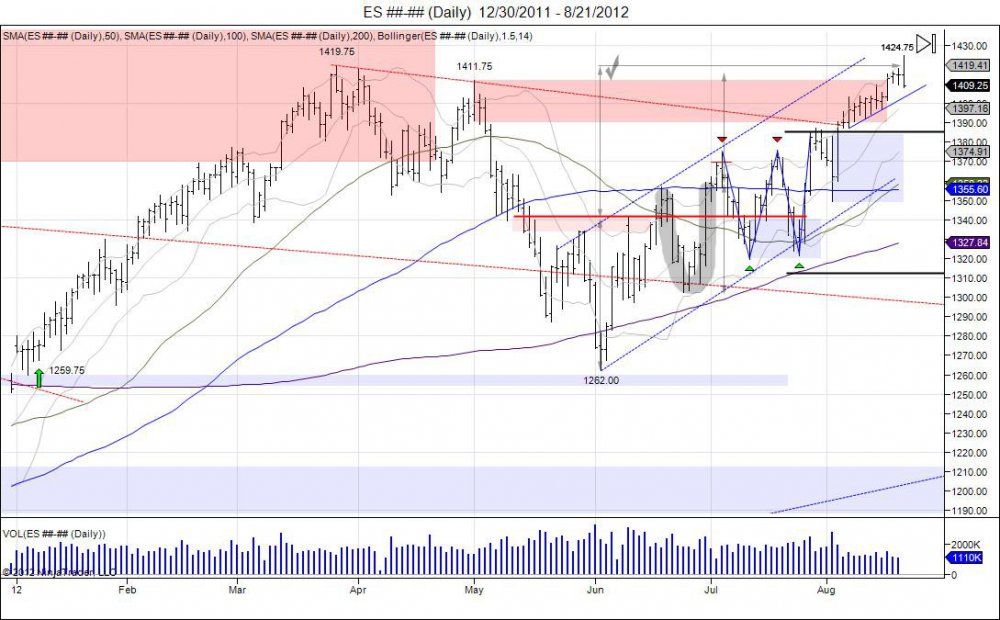
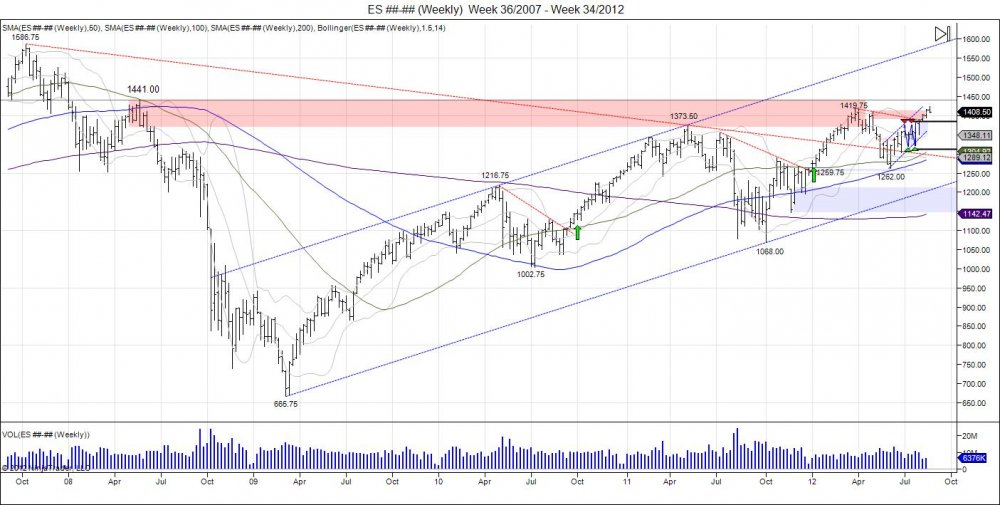
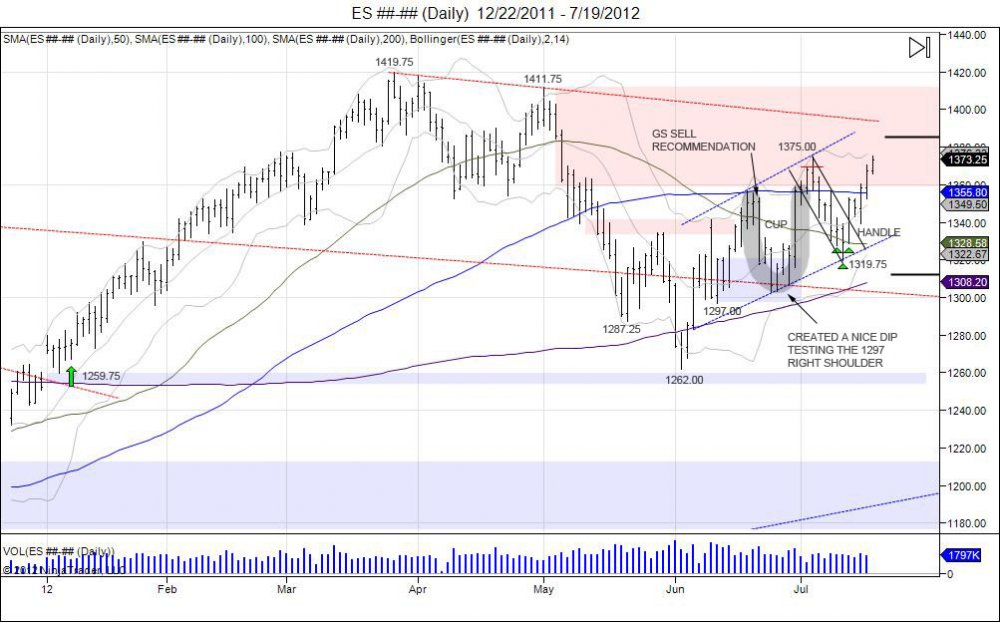
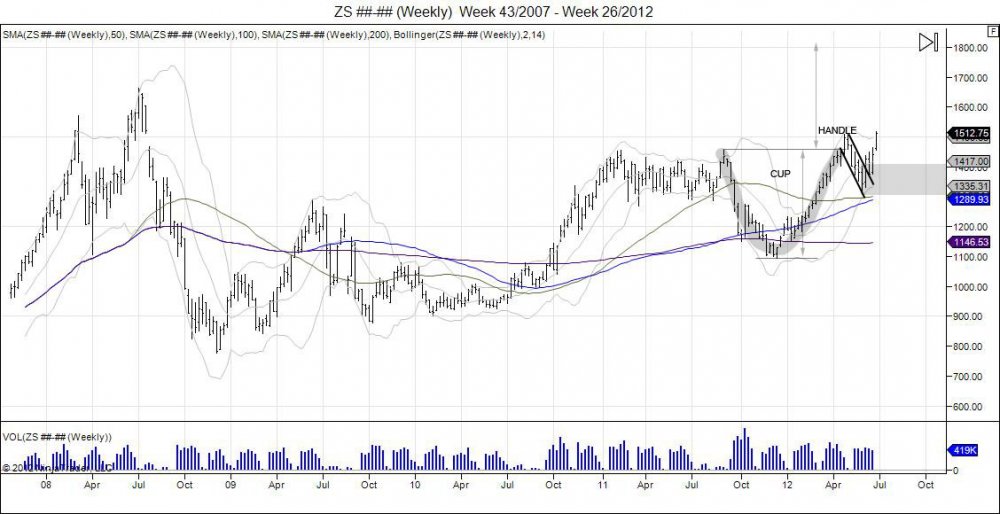
The stock market started 2016 weak, however recovered the highs of the year by summer, making a U turn. Those that were caught short, bearish, and wrong, were now forced to reverse position, thus creating the cup/handle formation, giving way to expand the U turn up to 20k.
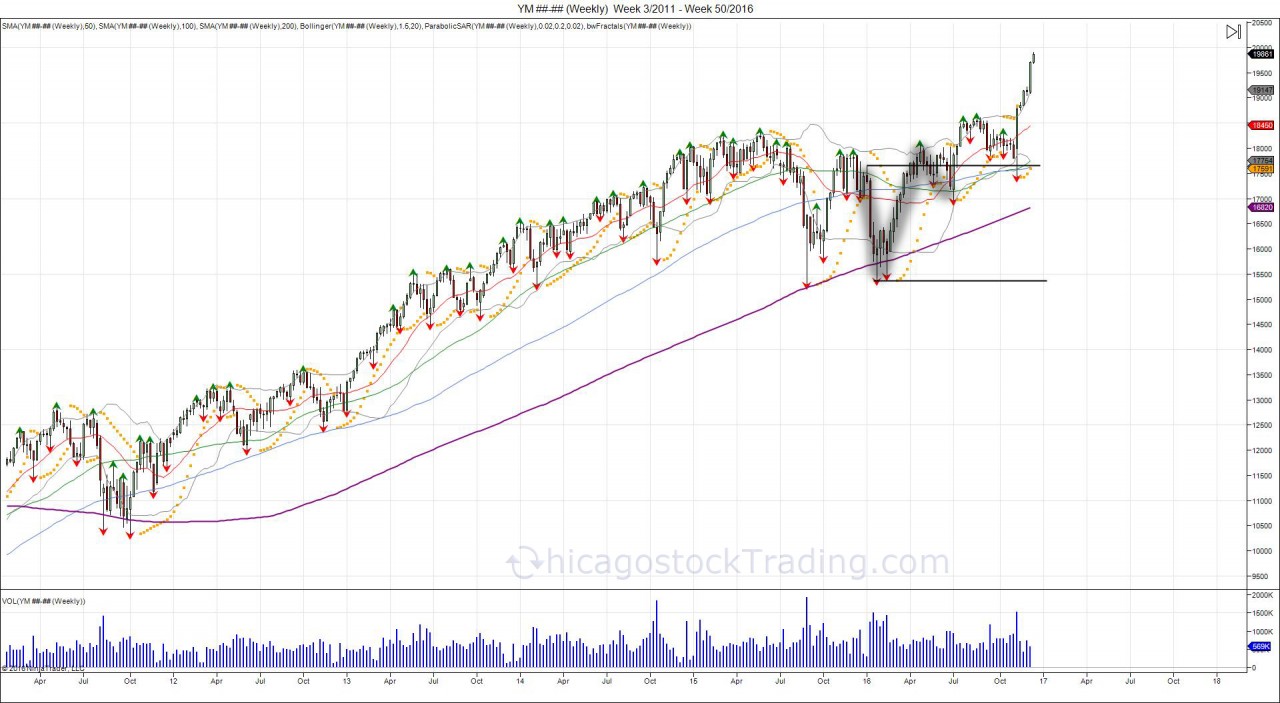
Continue reading
3461 Hits

SP500's ride from 1800 to 2040 with Chicagostock

HOW DID THIS:


GET TO THIS?:

Continue reading
4187 Hits

Summer Capitulation or Summer Bummer

1-8-12b_1.jpg


Notice long term 2013 trend from the breakout gap and go above 1440 to start the year see a setup of higher lows strongly defended.  Early 2014 low held right against this trendline to put in another higher low and see new highs made. Latest higher low comes in at the April lows of 1803.  Uptrend line caught up to the market forcing buyers to defend even as market has gone into sideways distribution. The sideways consolidation has been a fight to hold the uptrend. Latest bounce coming from the April low and break out above recent 3 month range is looking for capitulation of shorts and new longs to be forced above new highs. The April low is now a major pivot level as a breach below breaks reveres the uptrend of higher lows.

Continue reading
3043 Hits

How the 30 Year Front Ran QE2-QE3-Taper

1-8-12b_1.jpg


As seen in the above chart, every move regarding QE was front run by the bond market, with the exception of the 1st QE in 2008 that pumped bonds from 112 to 141. When QE2 was announced the market moved lower, from 135s to 116s. September 2011 "operation twist" was announced, with the market having front ran the news 30 points higher to 147.  This eventually led to a period of consolidation as the market dropped to 136 before running up to new highs of 152 just in time for the announcement of QE3.  Another pullback was seen, down to 140 as the news was sold.  With talks and rumors of tapering QE in 2013, this accelerated the downfall into lows of 128, below its 200day weekly moving average.  In September 2013 the Fed surprised the market by not tapering QE.  This led bonds to unwind and squeeze shorts, reversing from 128-133, back to retesting major resistance at the 200day moving average.  The reversal and squeeze of shorts gives new buyers an area to defend down using the lows below 128 as the exit.  Objective would be to retrace 50% back to 13900. If the bond market did get oversold as it got ahead of itself expecting no tapering, then the retracement seems reasonable, maybe even to front run another meeting of no taper or even increase of purchases.


1-8-12b_1.jpg


As seen in chart above the 30 year recovered its highs of 13316 from August 27th, rounding out a bottom.  This reversal back through this high was done by the surprise of no taper and shorts being squeezed. Over the past 2 weeks the market traded sideways in attempt to consolidate the reversal and build a base for new buyers to step in.  The longer the market holds above 133 the more of a base it builds and shorts it lures to force a squeeze.  New buyers have to step in to build this base for a breakout to expand the 133-128 range.  This expansion of 128-133 that shorts were squeezed from, gives room for new buyers to target 138-138, also a 50% retracement of the bond market from the May 2013 break down. First downside support seen at 13130 based off 12812 lows. Failure to hold lows shows a failure by buyers to step in with next major support at 12630, 12100.

Continue reading
2839 Hits

SP500 Wave 5 How High Will It Go

ES________480_Min___5_15_2013.jpg

Click to enlarge

The latest breakout above the previous high of 1593 is extending to be the 5th wave of the 2013 breakout above 1440.  As seen in the charts, the market has had 5 waves this year.  The first wave starting from the year lows of 1438.25 to the February high of 1530 rising 6.4%. The corrective wave off these highs retraced 52.6% to 1481.75 before stabilizing.  The breakout above the previous high of 1530 began the third wave up as the market rose 7.5% into 1593 in April before correcting.  The corrective wave off these highs retraced 56% to 1530.75 before once again stabilizing.  The latest squeeze through 1593 has become the new wave up, being the 5th wave of the bullish trend.  The 5th wave is usually the strongest out of the 1,3 ,5 buy waves as it attempts the final squeeze and extension of the trend, luring in the late buyers.  This happens as the market never pulled back to retest the April lows allowing for buyers to defend 1550s, and forcing a chase above 1600.  The chase thus far has been strong, with the market extending 76.4% above 1593 at 1648.75, and up 7.7% from the 1530.75 low, already a larger % move then the 1st and 3rd buy waves. Major resistance is being met at these levels. The range of 1593-1530.75 (62.25) completes at 1655.25 to be a +8.1% (1593+62.25). Next level comes in at 1666 to mark 1k points off the lows and 8.8% move from 1530.75, followed by 1685.50 as the 100% fib extension and 10.1% off the 1530.75 low.  As this latest wave pushes higher, bulls are most present and bears are ridiculed. Major upside targets are being thrown out, pumping the market.  As per the Elliot wave, once the 5th wave completes by seeing a correction off the highs, an a,b,c corrective pattern can be attempted. This can turn into a consolidation to build a base or a head/shoulder pattern as A is the wave off the high, B the wave to retest the high, and C the wave that fails the retest and falls to take out previous low from A which is needed to confirm change in trend.

Wave 1: 1438.25-1530.00 +91.75 6.4%

Wave 2: 1530.00-1481.75 -48.25 3.1%

Wave 3: 1481.75-1593.00 +111.25 7.5%

Wave 4: 1593.00-1530.75 -62.25 3.9%

Wave 5: 1530.75- *1685.75* +155 10.1%

Wave 5 ends when market turns back to take out the pivot low of 153075 that began the chase through 1593.

Sell stops are loaded up on the downside as the market built bases into the upside squeezes. These come in below 1620, 1607, 157075, 152950.

Continue reading
5519 Hits

SP500 1385-1423 Cup/Handle Completed


ES________60_Min___11_20_2012.jpgES_12_12__60_Min___12_4_2012.jpg

Continue reading
3314 Hits

Bullish SP500 Patterns Hold Up, Target of New Year Highs Completes


ES________Daily___12_30_2011___8_21_2012.jpg

Today the SP500 completed its target of 1422 by the bullish patterns created during the months of May - June.  The year lows of 1259.75 held in June with lows of 1262.00 as the market double bottomed to keep the gap from last year downt o 1252.50 open, keeping the bullish momentum alive.  The market consolidated against these lows and created an inverted head/shoulder pattern with a 1342 neckline, targeting 1422.  An attempt to breakout was seen early July before the market went into another consolidation phase, creating a cup/handle pattern and retesting the 1320-1297 right shoulder.  This created another double bottom against 1420 in July and the market rallied into its upside resistance of 1385.  During the month of August the market squeezed above 1385 and held above to keep shorts trapped which led to a slow chipping away at the May highs of 1411.75.  Which this hold above 1385, shorts were forced to squeeze out, leading to this high of 1411.75 being taken out and finally giving room to take out the year high of 1419.75 and complete the target of 1422 from the 1342-1262 inverted head/shoulder.  Today as the market completed this, instant profit taking was seen as the market reversed down to 1408.  At this point a shakeout can be seen to test downside support down to 1383 with major stops below 1349. Breaking below this low derails the upside momentum to see further downside.  Going forward, as the market looks for downside support and longs who have riden this over the past few months take profits, the late comers and shorts can give the fuel for the extra 20 points to complete the final squeeze of 1441 being the May 08 highs. This completes the short squeeze from the 665.75 lows put in 2009. A squeeze of 1441 can then give room to look for a correction in the market, however will need to see if the market can stabalize or fails following the move.

ES________Weekly___Week_36_2007___Week_34_2012.jpg


Continue reading
3648 Hits

SP500 Retraces 100%

 ES7_19.jpg


Following the 1319.75 lows made on July 12th as the market retraced lower to test its breakout point on the 29th of June, the Emini SP500 has held this level of support to break out of its handle formation off the highs of 1375. This breakout has led to a 100% retracement back to 1375 as the market has squeezed out this high.  As noted in our market update on June 26th, we believed the pullback offered buyers opportunity to defend the market as the rounded bottom in the CUP was forming, followed by our post on July 12th as the handle was being formed identifying the 1328 level as support.  With the market now at 1375, this rewards those brave buyers by giving opportunity to take money off the table as 2 of the 3 targets are complete, 1348 and 1375.  Going forward, buyers can now run positions with their stop at their entry levels at the 1328 level and let the market attempt to complete its upside target of 1422.  This move past 1375 confirms the cup/handle formation, however the next major resistance comes in at 1390 which retraces the market to where it failed at 1411.75 in May.  Rather than buying at these levels, by stepping in and buying the breakdowns seen over the past few weeks, this has rewarded runners to do the heavy lifting through these major resistance levels. Sellers will be defending 1390 at all costs as this is the last level of defense where if fails, the highs of 1411.75 will be taken out, giving room to complete the upside target of 1422 and attempt to extend into 1441 being the May 2008 highs that saw the reversal into 665.75.  Failure to push through 1390 and a move below 1319.75 derails momentum. 


Continue reading
2907 Hits

Will Bullish SP500 Patterns Hold Up? All Point To Year Highs

 es7_12.jpg


This year started out with a gap above last year's close of 1352.50, leading the market into highs of 1419.75 on March of 2012, which was met with the last level of resistance before the 1441 May 2008 highs which is the reversal that led into 665.75.  The SP500 retraced to test its year lows of 1259.75, only to hold and put in a double bottom at 1262.00 on June 4th.  Since this low failed to take out the year lows, the market bounced early June to squeeze shorts and make a 1342 high.  The market backed off this high and retested the short squeeze by pulling into lows of 1297.00 and holding to create a right shoulder of an inverted head and shoulders pattern as the market was testing its head of 1262.  With the test of the lows holding and the market turning, more shorts were caught as the market rallied through 1342 for another squeeze in attempt to break above its 1342 neckline, only to hit highs of 1357 and stutter.  The market met resistance at its 100day moving average along with the levels from where it broke down May 11th.  Following this failure to hold above the neckline the market was sold along with news from Reuters that “Goldman Sachs recommends shorting US stocks” with a 1285 target.  This news led to weak hands selling dropping the market down to 1317 off its highs of 1353 that day. This retested of the right shoulder lows of 1297 as the market hit 1302.50 on Monday, June 25th.  The following day the market tested this low with a 1303.25 low, and held to reverse and squeeze shorts running into resistance at 1330.  The market backed off this resistance level and retested Tuesday’s reversal by finding support at the open 1306.75 and once again putting in a reversal on this Thursday.  This action created a rounded bottom as the market failed to break below 1297, causing a run higher on Friday to squeeze out shorts due to the failure to break lower, retracing the market into 1375.  This action created a U turn as the market came back above 1357 which was where it broke down and rounded out to come right back into this level. Also known as a CUP.


Since the reversal seen into 1375, the market has gone into consolidation in attempt to build a handle for the cup as downside support is tested.  This handle has retraced the market down to where it reversed at 1328 from June 28th.  This is much steeper then the bulls would like and has the market pressing against this old resistance, acting as new support being the level where the market reversed higher into 1375.  On Thursday, July 12th the market shook below this level into lows of 1319.75 which hit the bottom of its rising channel from the 1283-1302.50 lows as seen above.  The market bounced off this channel and closed above 1328.  Going forward this level remains support with small stops below 1319 followed by larger stops below the CUP lows of 1302.50. A break below this low voids out the cup/handle and puts pressure to test the June lows within 1282-1262.  A close above 1342 is needed to close above these most recent highs and attempt to break out of this handle pattern to retest the premature breakout of 1357-1375.   A break above this confirms the cup/handle pattern with a target of the year highs.  Following this the next major resistance comes in at 1390 off the failed 1411 high in May. This cup/handle formation is also within the larger inverted head/shoulder formation with the left shoulder lows of 1287.25, head of 1262.00, and right shoulder of 1297.00 with a neckline of 1342.00, also targeting the year highs at 1422.  To void out this head/shoulder formation the head of 1262 must be taken out which gives room to take out the year lows of 1259.75 and fill the gap from last year at 1252.50.  So long as this gap is open, the bull is alive as a double bottom has formed by an inverted head/shoulder against the year lows which keeps pressure against sellers as the market attempts to squeeze shorts higher.  The ultimate objective above the year high is squeezing the May 2008 high of 1441 being the high the market reversed from that led into the crash down to 665.75 as seen in the weekly chart. 


Continue reading
6504 Hits

Soybeans Target New Record Highs

 ZS________Weekly___Week_43_2007___Week_26_2012.jpg


Since Soybeans put in highs of 1456 in September of 2011, the market fell down to 1094.25 within a few months in December of 2011.  Since these lows, the market has rounded out a bottom and come back right to where it broke down at 1456.  The market breached this high in April of 2012, rallying up to 1509.00. Since this was a complete U turn and new 3 year high, the market went into consolidation off these highs in attempt to look for support.  This in turn created a "handle" for the "cup" formation that was formed from 1456-1094.25-1509.  This handle pulled down into lows of 1317.50 in June 2012 and pivoted off this low to break out of its downward channel within this handle. Since this breakout the market has ran through the 1509.00 high, making new highs of 1517.75.  This cup/handle formation has a target of 1817.75, which breaches the July 2008 high of 1663.00.  This target is derived by taking the range 1456-1094.25=361.75, adding to 1456=1817.75.  Pullbacks down into 1400 should be supported with stops below 1317.50.

Continue reading
2730 Hits

Positive NFP # and +19 overnight daytrade

ES________5_Min___2_3_2012.jpg


Non Farm payroll numbers released this morning showing an increase of 243k jobs and unemployment rate of 8.3%.  This let the market to rip through 1330 into highs of 1336.75. Rewarding overnight buyers:

more...

Continue reading
1615 Hits