Chicagostock Trading

Chicagostock Trading

Copper VS SP500 UPDATE / Equity Tops

1-8-12b_1.jpg


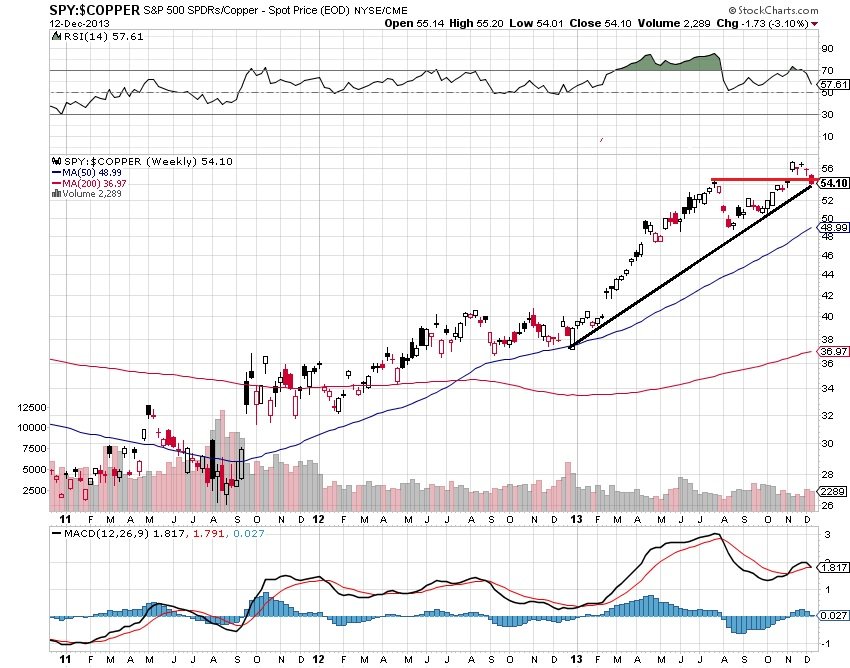
The spread between copper and the SP500 is now down to 5410 after hitting highs of 5679 in November.  This high marked a 25+% move higher in the SP500 and a 13-% move down in copper for the year of 2013.  Copper, known to be bell weather of economy as it shows industrial demand, tends to be a leader for the equity markets.  The fact that it was down this year as the SP500 diverged higher shows the move in equities was fueled only by QE as opposed to underlying macro.  Going forward, a breach of the August low in this spread confirms a failed break out with reversal attempt to cover/buy copper and sell the SP500.


 1-8-12b_1.jpg

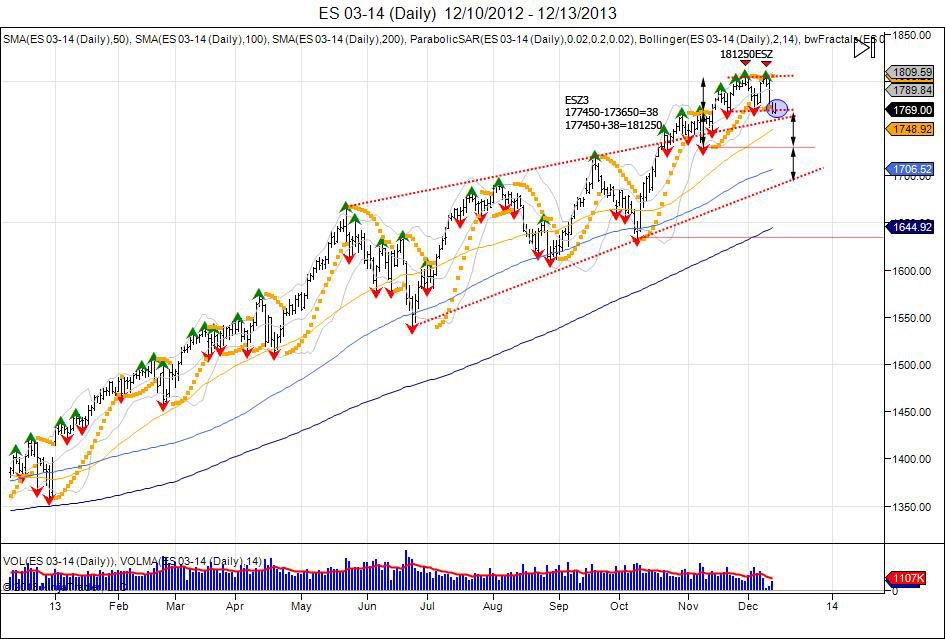
After breaking through the daily pennant created after the May correction that was followed by higher lows and higher highs, the SP500 traded in a tight range of 173650-177450.  This range of (38) was expanded higher as market broke above and turned 177450 into support, completing its target of 181250 to the tee with highs of 181250.  This was followed by a pullback to retest the 177450 level that held at 177775, followed by another retest of highs.  The retest was seen on the December release of the November NFP # that fueled the market to retest highs.  This retest fell short at 181150, seeing a rejection to take out the 177775 low, confirming a short term double top.  Market is now ont he edge fighting to hold above 1760 as this 1774 level becomes new resistance with the double top trapping longs and putting pressure lower.  Continued weakness below 1774 gives way to target the bottom of  old range at 173650 for stops.  Failure to hold 17360 can see the 1774--1736 range expanded down to 1698, into the bottom of the daily pennant and a test of the 100 day moving average which has not ben touched since October.


Continue reading
913 Hits

Oil and Transports TRADING TOGETHER?

CL________Weekly___Week_4_2011___Week_39_2012.jpg

IYT__Weekly___Week_4_2011___Week_39_2012.jpg

Here is a question... Shouldn't falling oil prices be a positive for the transportation sector?  Looking at the weekly crude oil chart above along with the weekly transportation index fund chart, what do we notice? Both oil and the transports traded exactly the same the past 2 weeks as highlighted in blue.  Crude oil made a high of 100.42, failing to break out and seeing a quick reversal the following week to take out the lows made the prior week.  The transportation index made a high of 9349 and also saw a quick reversal the next week to take out the lows made the prior week. In theory, a weaker oil market should be supportive to the transportation index and the weakness in this sector should not have been as strong. Only we are now living in a QE world and these assets are trading as risk on and risk off.  The weakness and similarities should be noted, as this may be giving a bigger picture of what is going on in the economy, and why the Fed continued with quantitative easing. Going forward, the range from the week these markets made these highs is new resistance needed to breach to move higher.


Continue reading
2350 Hits

Troubled Transports

 IYT__Daily___6_1_2011___9_24_2012.jpg

The Dow Jones Transportation Average Index Fund (IYT) has now cracked 2 month lows and on the verge of testing the year lows set early June at 86.09.  As the equity markets grinded higher in August to complete the Emini SP target of 1420, many investors along with other "personalities" looked to the transports for confirmation of the equity strength. Unfortunately for these 'buyers', the confirmation in transports never came.  The transportation index fund made a high of 93.42 in August just as the Emini SP500 made new highs for the year.  As equities digested this new high and consolidated down to 1395 where a base was built, the transports corrected sharply off their August highs and fell into the summer lows.  This index turned to chase equities as the SP500 base of 1395 was supported to see a squeeze into the 1441 level, the transportation index began to play catch up.  As 1468 highs were made in the SP, the transport fund took out its August highs by 7 cents.  This attempt to breakout failed to hold these prices and breakout of this pennant that has coiled all year.  Once again with the small correction taking place in equities down to 1443.50, IYT fell sharply to take out the pivot low of 88.17 made in September just before it chased the SP higher.  With the break below 88.17, this confirms weakness in this index and the double top made in August-September as the pennant has now been broken to the downside.  Those that were looking for transports for confirmation, not only missed the move up in equities, but should be completely puzzled now of the weakness taking place here.  Going forward, IYT is looking weak. The pennant created all year has seen a break to the downside following the double top at the 9340 level. Rallies up to 90 offer oppurtunity to defend this breakdown and sell with stops above 9350.  This range will need to be taken out for buyers to regain control over this sector. Downside support levels = 83.00, 82.60, 80.84, 80.00.


Continue reading
2941 Hits