Chicagostock Trading

Chicagostock Trading

Return to "normal"

NQ Monthly 2023 07 9 57 42 AM

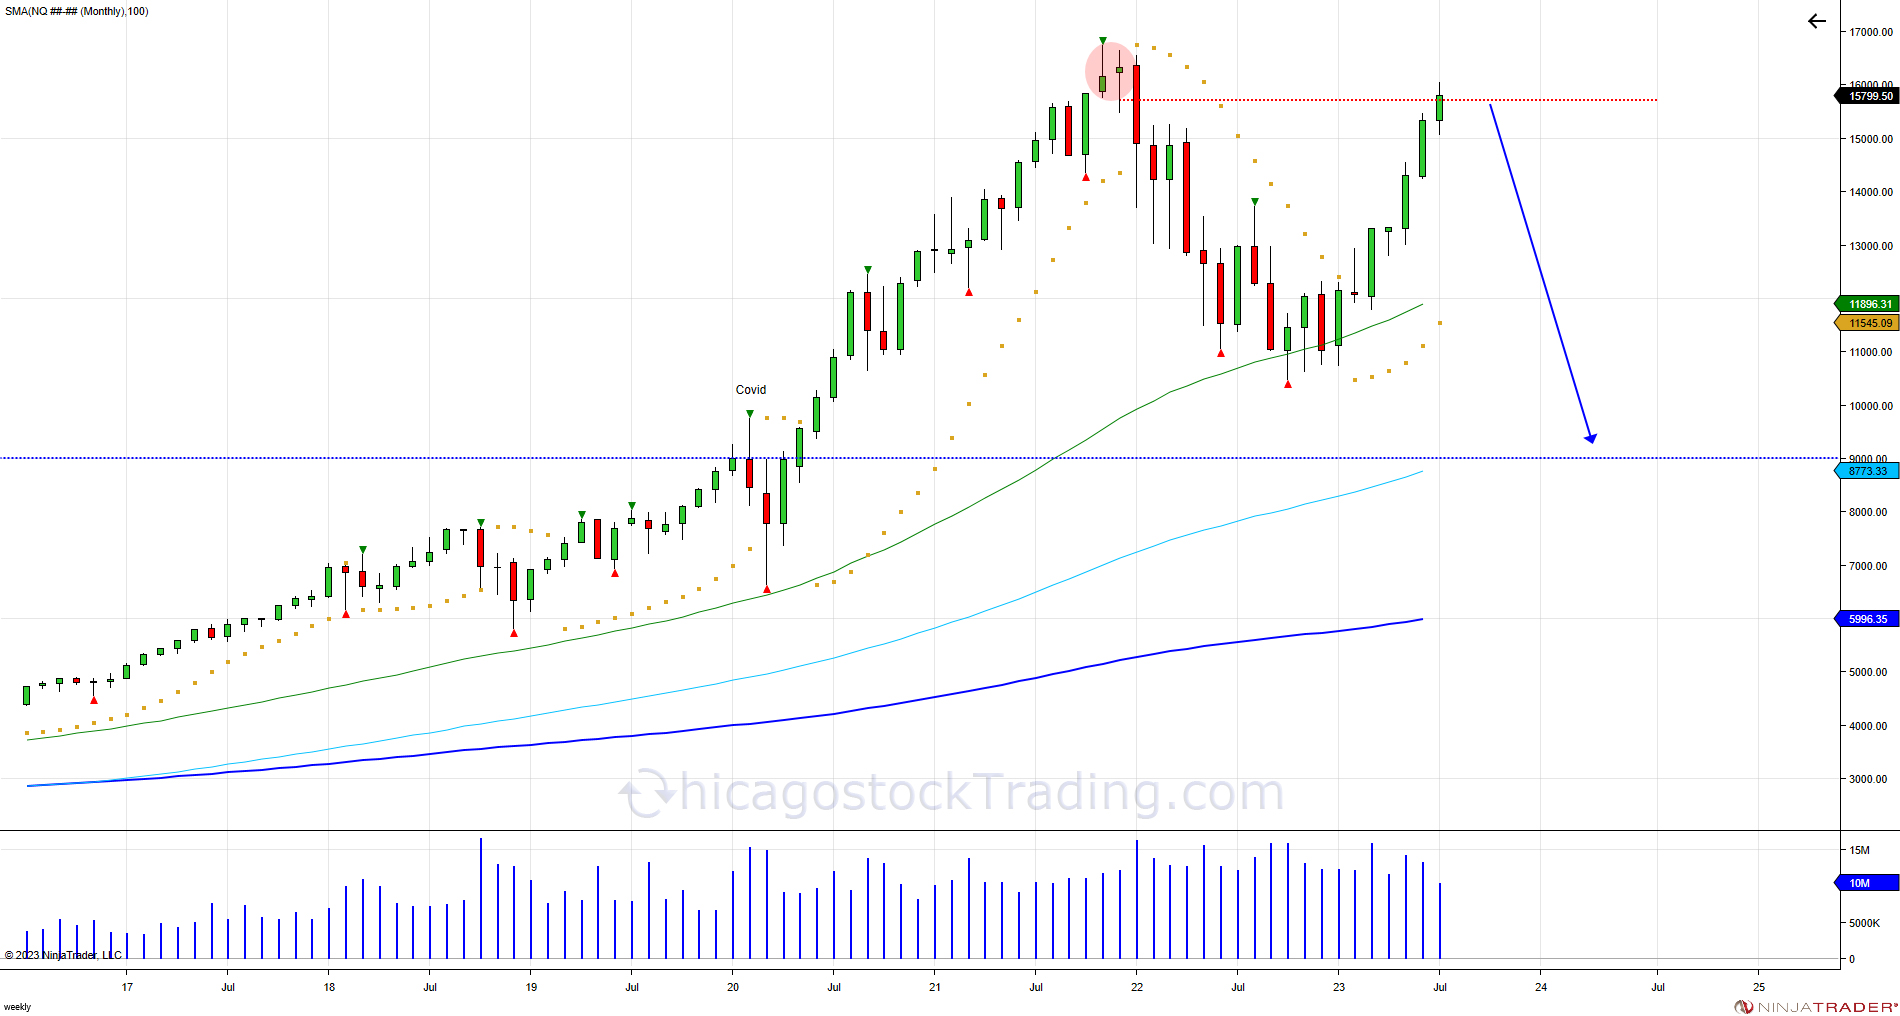
After the Nasdaq put an all-time high in November of 2021 at 16767, the market dropped 37% in the year 2022 to a low of 10484. The Fed has continued its hike program, which has raised rates to a 22-year high while signaling further hikes would be data-dependent. Investors are assuming they are done hiking interest rates. “There is belief that the Fed is probably done,” said Timothy Graf, head of EMEA macro strategy at State Street Bank & Trust Co. “Markets are also seeing a US economy that’s held up far better than the consensus outlook. They are pricing that we have achieved a landing that everyone thought would be impossible to achieve.” Meanwhile, earnings continue to beat analyst estimates. On top of that, GDP rose in Q2 at 2.4% above estimates of 1.8% and higher than the previous period of 2%, showing an expansion of the US economy.


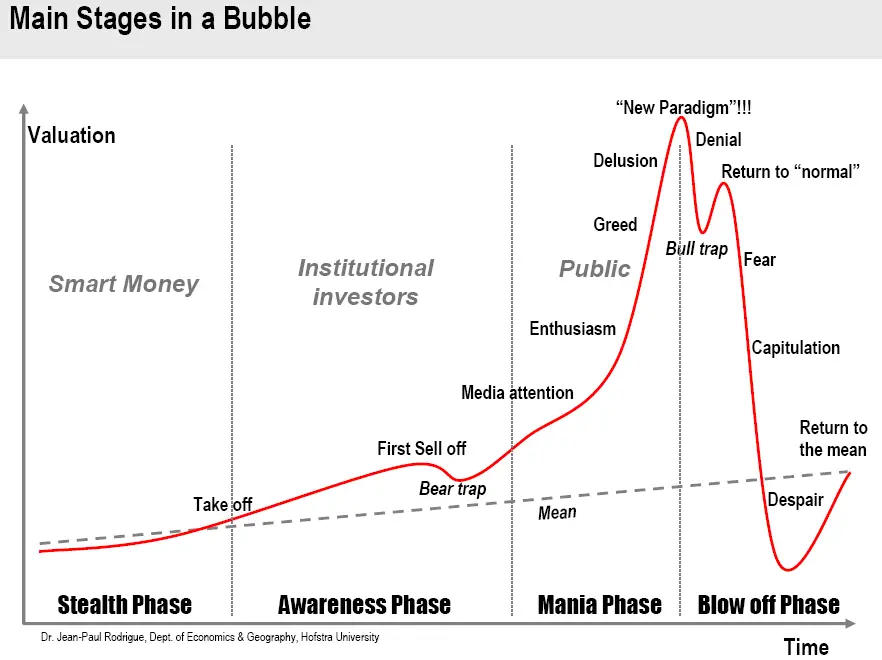
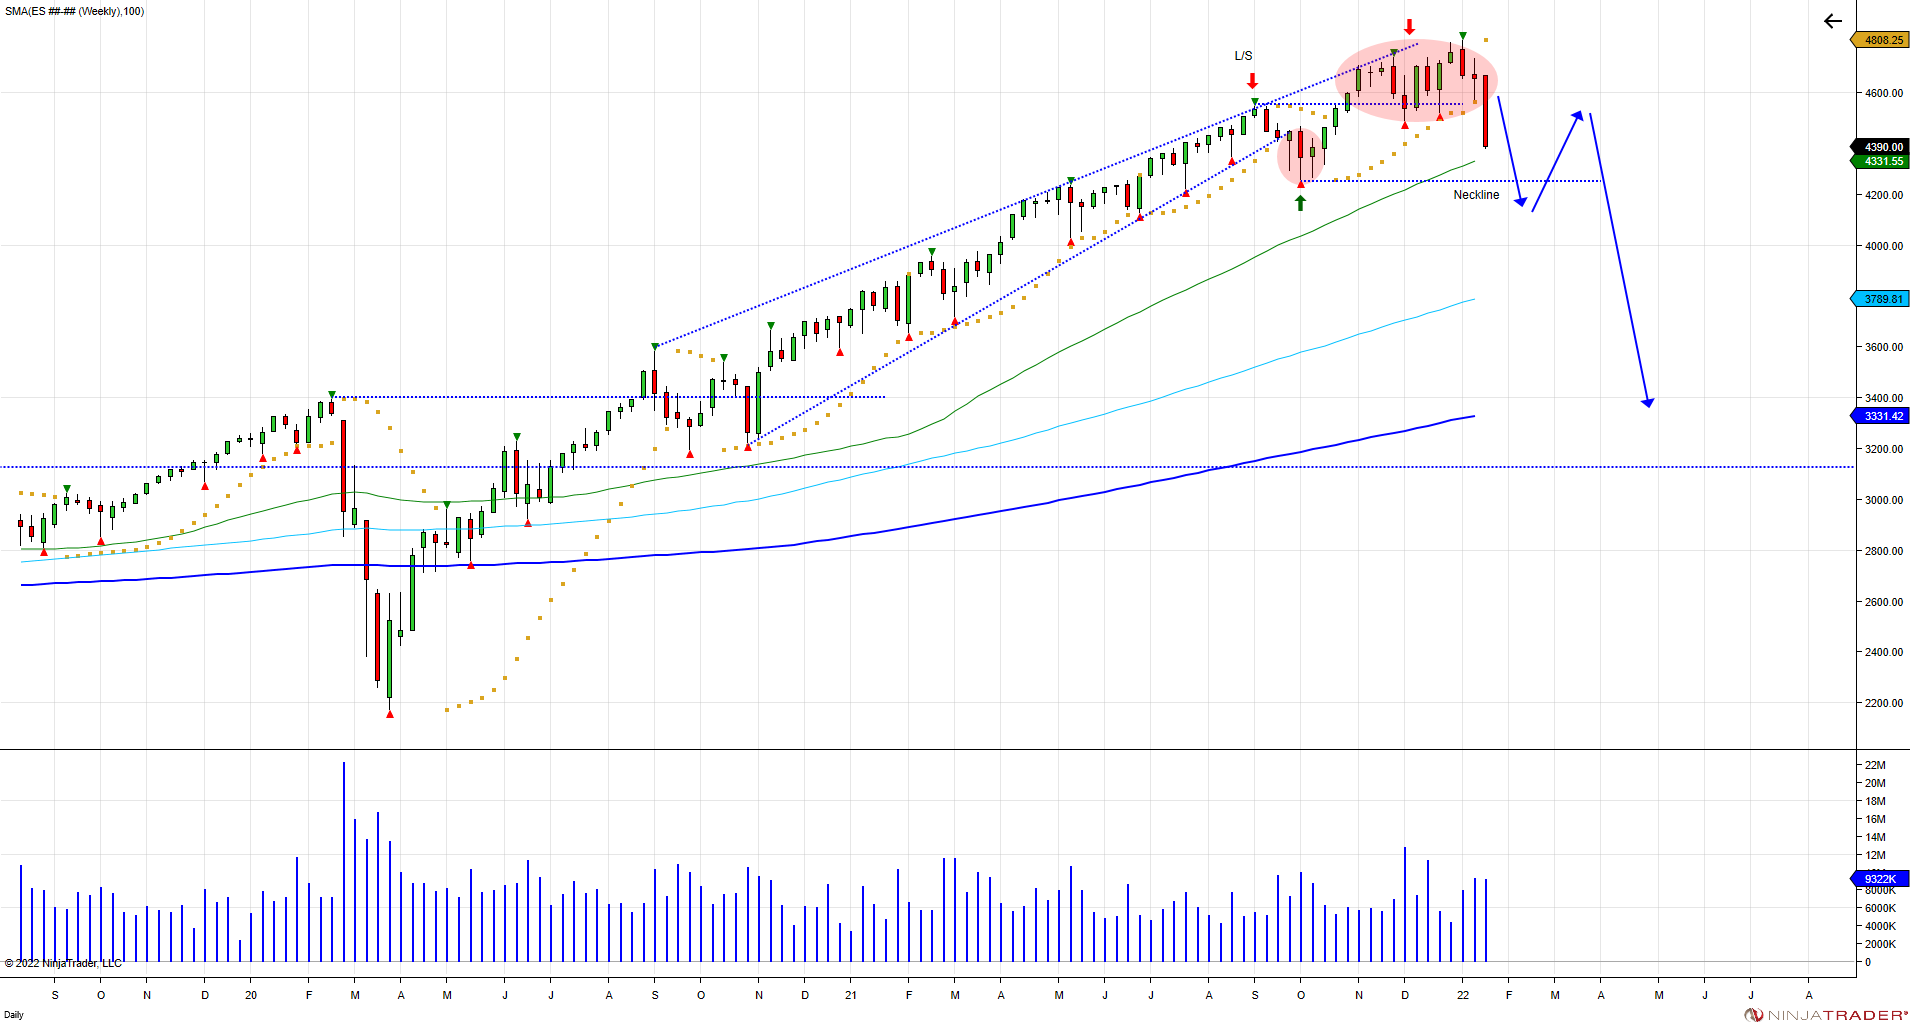
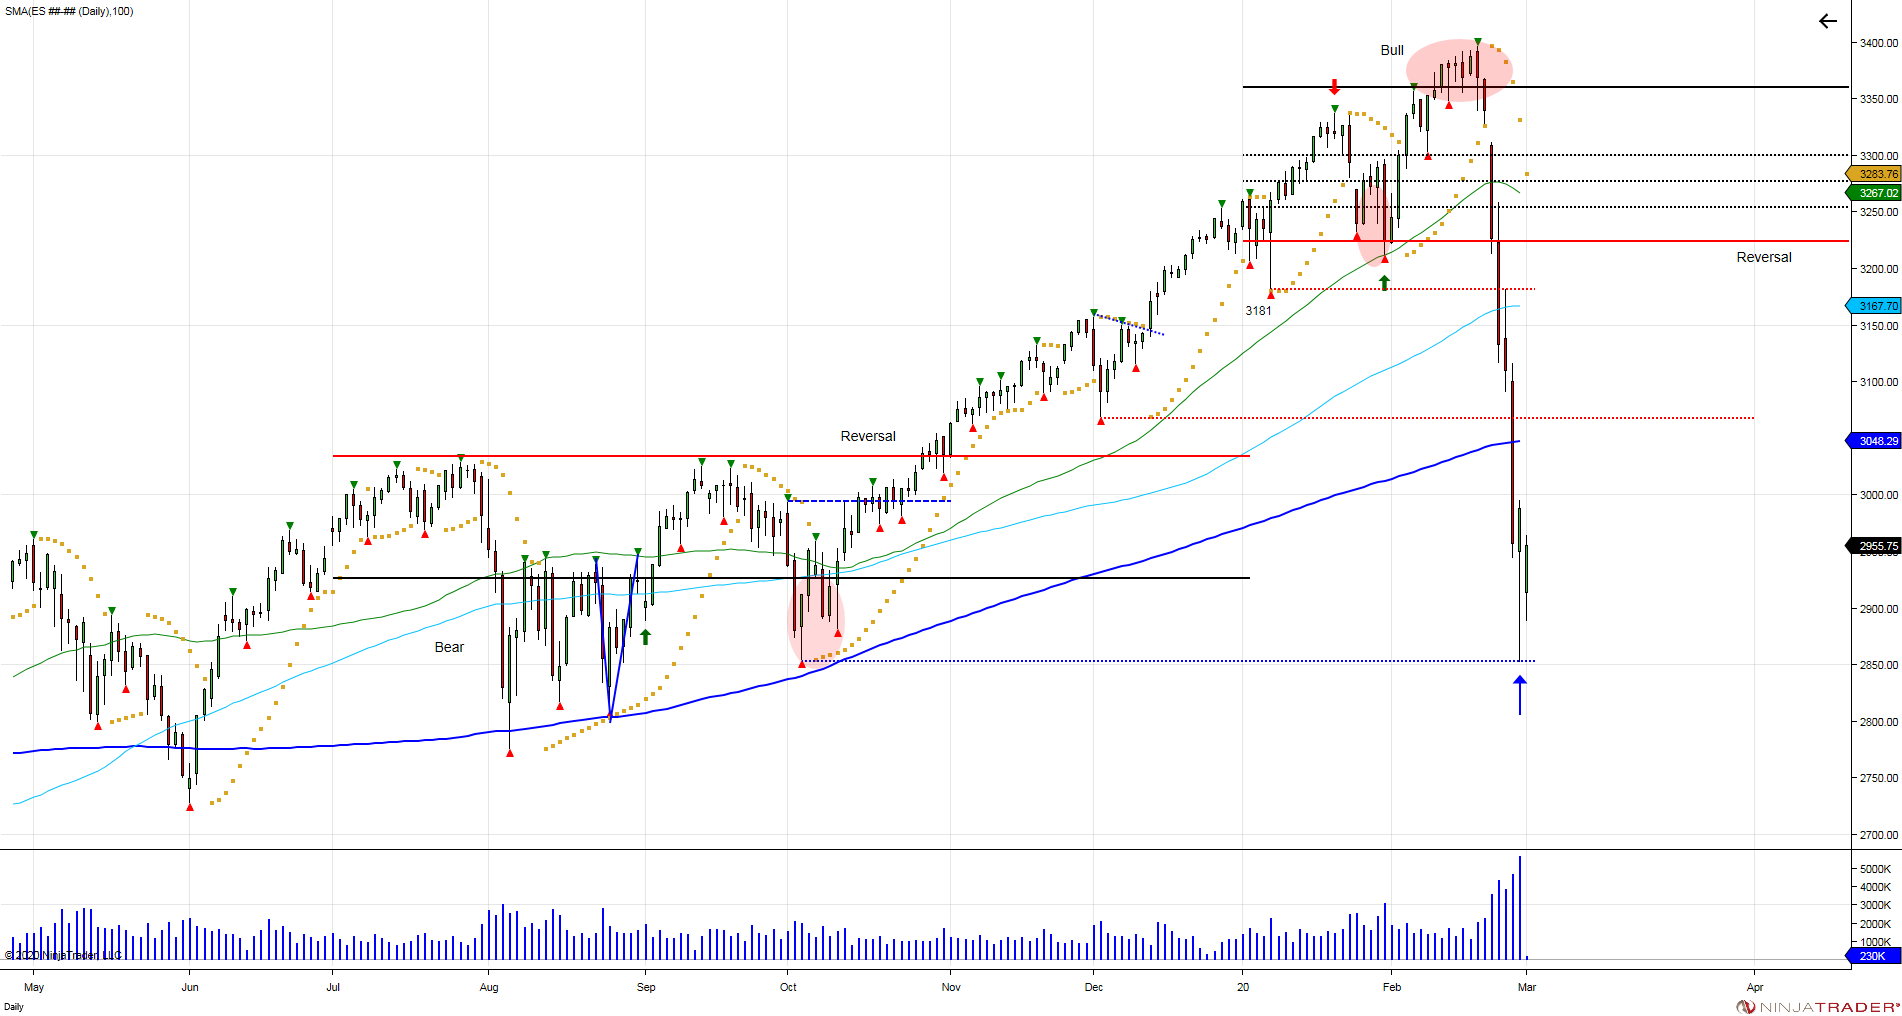
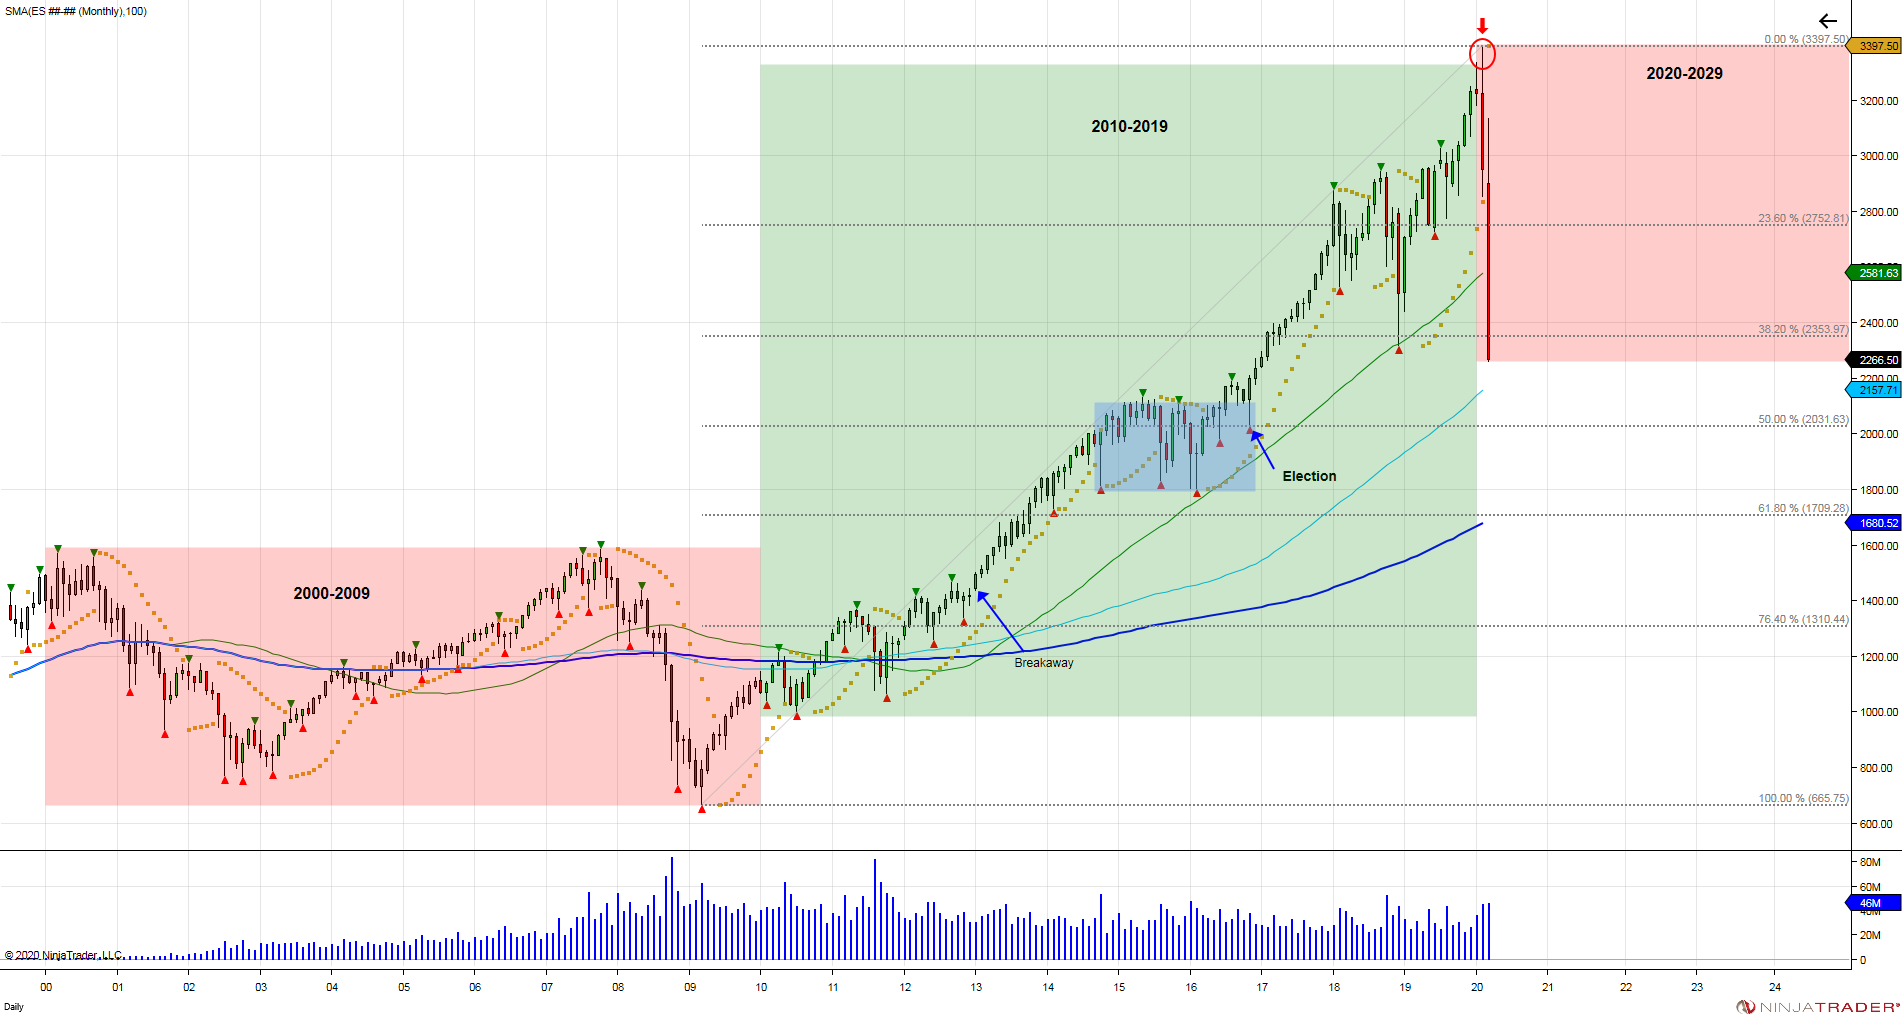
This strong data comes as the market retests the failure from November of 2021 where it trapped buyers to bring up the question, have we returned to "normal"? If you take a look at the chart on the main stages of a bubble, the Nasdaq is tracking it back to the return to normal phase. The retest of the November 2021 failure is key resistance for buyers to overcome, as well as sellers to defend, hedge, or lighten up on positions. We are at a point of testing supply and looking for demand as demand will have to keep up to continue the rally in any attempt at taking out the 2021 high.  Failure to push through and a failure at these levels can give way for another wave down that would be more fierce than what we saw last year, giving opportunity to retrace back down to retest the March 2020 high from where the market took off after the Covid breakdown. 


Image


Tags:
Continue reading
1383 Hits

A Look At Today's Intraday Reversal

ES 09 22 10 Minute 2022 07 14 6 26 42 PM


The market was sold in the overnight, setting up the cash market to open with a gap down.  Cash market opened down, forcing sellers to chase weakness and breaking the lower Volatility window at 3731.  By doing so, this set a bearish intraday bias, luring in "late sellers".  When sellers were unable to expand below the lower vol window and the market recovered back above window, these late sellers were caught in a trap and used to fuel a run through the opening high and reversal window, reversing the bear bias.  When a bias is reversed, in this case a bear one, it tells us the sellers were wrong and shorts on the day are then forced to cover their shorts and buy pullbacks.  Pullbacks into the open, and the lower vol window become support as shorts are covering. In this case buyers defended the open, which kept sellers from buying back lower, giving way for another run and expansion back to the intraday pivot as sellers were forced to cover at higher prices. 


Traps move markets, volatility windows are helpful to identify momentum on the day, but also when a trap is being set. When a majority of the selling is done in the overnight, the lower vol window becomes key to luring in late sellers.  If they are unable to continue expanding lower, they get caught in a trap and used to move the market in the opposite direction.


Sign up here for a 2 week free trial to receive daily ES reports, volatility windows and pivots: https://www.paypal.com/cgi-bin/webscr?cmd=_s-xclick&hosted_button_id=T9TWRWFGUB8NJ


Access to our chat room, screenshare, and live trading 1 week free trial here: https://www.paypal.com/cgi-bin/webscr?cmd=_s-xclick&hosted_button_id=59K8NHY2S5B6N

Tags:
Continue reading
1907 Hits

What to look for next after a stumbling start to the year

ES Daily 2022 01 23 4 14 52 PM

The SP500 gained 1156 points in 2021, or 31%. The market attempted to correct in October with a low of 4260, only to see sellers fail to take control as buyers defended the 6-month reversal window to maintain the bullish 6-month bias. This led to a squeeze in October above the September high of 4549 to force shorts to cover, before spending the next 2 months consolidating above and luring in buyers above. The market ended in 2021 by flirting with 4800. To start the new year, the market broke through 4800 on the 2nd day of trading, only to fail in holding the breakout above, which led to a move below the Jan 3rd low of 4747. The break led to a quick move down to 4572 before bouncing back to retest the failure above 4747. Buyers failed to recover the bull trap above 4747, putting in a lower high at 4739 which left trouble for longs as the market went after 4572 again. The break of 4572 gave way for a break of the December trendline from the rising lows, which is giving way for a retest of where the market broke out originally in October as the 200SMA is being tested for the first time since June of 2020. Buyers are under pressure to perform and to defend the October low, as that is where the pressure is against the next big sell stops to shakeout longs. Short term test of 4365 is the next support in the market that can provide an opportunity to bounce, however, rallies up to 4550 becomes new overhead resistance for sellers to defend and buyers to overcome.


ES Weekly 2022 04 4 33 16 PM

As seen in the weekly chart above, the attempted correction in October lured sellers that were unable to expand lower, which became trapped as buyers stepped up and used them to fuel the next leg up. The market spent 12 weeks above the September 2021 high, luring buyers above, only to now fall back below, which has caught buyers trapped above. Going forward the pain in the market is for the October lows to fail. Until then the pressure is on buyers to defend pullbacks to prevent losing the October low as taking out the level will shakeout longs and confirm the breakout above the September high as a failure. Break of the October low reverses the move and not only will shakeout longs but lforce sellers to chase below, which can then provide an opportunity to bounce back to retest the failure above 4550 in an opportunity for buyers to overcome and sellers to defend the failed breakout above.  Failure to recover the failed breakout is what puts in a right shoulder to create a larger head/shoulder pattern. Buyers have a long way to go to get another shot at the ATHs again by recovering the market above 4740. The market moved up 121% from the March low in 2020. After making the V bottom in September of 2020, the market never looked back and rallied throughout 2021 into the 4800 level, forcing longs to chase. Ultimately, the market has the opportunity to retrace back down to 3450-3150 to retest the breakout from 2020. This equates to a 35% decline from 4808 into 3150, which is a 61% fib retracement of March 2020 to the January 2022 high. How long will it take to retest these levels is the X factor. Retests always take place, it's just a matter of time. 

The negative start in 2022 is the market attempting to price in rate hikes as the Federal Reserve has come out to say they are looking to hike 4 times this year.  The velocity of how the market is moving is based off traders being caught on the wrong side.  

Tags:
Continue reading
2410 Hits

Is History Repeating?


The year 2020 started with a continuation of the rally that began the year before in January of 2019. The 2nd half of 2019 shorts were caught and used to fuel the market into new highs. To start the new year, the market continued on its gains, managing to hold above its 6-month volatility window for exactly 6 days which was the time needed to establish a bullish 6-month bias, and the rug was pulled from underneath, fueled by the fear and pandemic that came to the forefront. As noted on February 20th, 2020, “if one is a contrarian, this is what you’d want to get everyone on the bid to sell into.”


What happened:

ES Daily 2020 03 01 8 11 21 PM


The move was sparked by the news of the pandemic, but fueled by buyers being caught on the wrong side. 


Fast forward to this year…


ES Daily 2021 07 29 8 50 41 PM


The market began the year by continuing on last year’s rally. Overcoming the January 6 month Volatility Window at 3800, to establish a bullish 6-month bias, and expanding higher into the end of the first half. The 2nd half of the year, July, started with the market making a new high, before correcting down to 4224, which was followed with a bounce-back into a new high. For the 2nd half of the year, 5 daily closes above the Volatility Window of 4382 are needed to establish a bullish 6-month bias. The market managed to do this on Thursday, July 29th, 2021. Just as the bias was set, the market is falling back below the window. Is this setting a trap? The key to the bias is that not only it lures in buyers above the window, but forces buyers to now defend pullbacks to prevent the bias from being reversed. Again if one wants the market to go in the opposite direction, they want everyone caught off guard and on the wrong side, this is what makes the biggest moves as they're unexpected. We will see if history will repeat itself as they begin talking about locking down the country again. By setting the bull bias, pressure is on buyers to defend pullbacks to maintain it and prevent a reversal. A reversal takes place with 5 daily closes below the reversal window at 4302. Doing so, would reverse the 6-month bull bias, have longs caught on the wrong side which can be used to expand the market lower. So long as the reversal window holds, buyers have control and will need to overcome the upper Volatility Window at 4382 again in an attempt to continue expanding higher.

Continue reading
3458 Hits

Will it be different this time?

ES Daily 2021 01 28 9 46 54 PM

They say history repeats itself, and the recent action in the market may prove that to be true.  Though we will never see the exact same thing repeated, and as we know, past performance is not indicative of future results, what we do know is that human psychology is the same.  That psychology is what produces these patterns that is seen in the charts, whether its greed, or fear. 

Remember last year we came off a big rally from the prior year (2019).  January and February of 2020 continued onto the rally, luring in late buyers only to trap them as the market reversed its bull bias and used trapped longs to expand the market lower as they were forced into liquidating.  This can be seen here as we warned: http://www.chicagostocktrading.com/blog/sp500-6-month-volatility-window-update.html and http://www.chicagostocktrading.com/blog/sp500-6-month-vol-window-catches-late-buyers-again.html

After correcting in the first half of 2020, the market bounced back into the 2nd half of the year.  The start of the second half of the year started with the market breaking higher, establishing a bullish 6 month bias that held 3300 and expanded higher into the end of the year.  The resolution of the election was followed with vaccine news on the 9th of November, which triggered a squeeze through 3600. Since this news, buyers were forced to chase as the market grinded higher into the close of 2020 with little pullback to allow buyers an opportunity to defend the election breakout.  

This year, started with a continuation of last year's rally.  The market began the year with the first trading day dipping down to 3652 before turning higher to consolidate at the highs as the 2 week opening range in January was defined.  The 2 week opening range is what creates the 6 month volatility windows.  After completing the opening range, the rally continued with the market breaking through its upper vol window, holding above for half of the opening range (5days), which establishes a bullish bias.  By establishing a bullish bias, buyers, or one can say late buyers are lured in, and are now forced to defend pullbacks to prevent a reversal from taking place.  The market could not wait a day longer as just as it held above the upper vol window for 5 days to establish a bullish bias, the next day on January 27th the market fell below the window of 3806, leaving longs on the hook above and falling down into the reversal window of 3708.  The test of the reversal window forced buyers to step up to prevent a reversal, seeing a defensive bounce into retesting the upper vol window at 3800 on the 28th of January.  Buyers must overcome this window to recover trapped buyers above to allow opportunity in expanding the market higher.  However, failure to do so, leaves buyers caught above.  As we test the reversal window, 5 daily closes below are needed to reverse the 6 month bull bias, which would mean buyers on the year are caught on the wrong side, and can potentially be used to fuel and expand the market lower.  Should this take place, key support is seen down to 3380 to retest the election low of 3319 that was never tested.  This would allow buyers an opportunity to defend the breakout and into a healthy correction. 


Below is the chart from the first half of 2020.  notice the similar ramp in November-December leading up to the new year.  The new year beginning with a break of the upper vol window that lured in buyers, only to trap buyers and use them to expand the market lower.  Just as shorts were trapped in August of 2019 that were used to fuel the market higher as they failed to expand lower. 


ES Daily 2020 06 11 9 48 46 PM


As individual stock names that are highly shorted are being targeted for squeezes, this is the same thing that happens on the daily, weekly, and monthly basis in the stock market.  The way the market moves is by catching positions on the wrong side, and when they can't retain control and expand the market in their direction, as market moves away from them, they're forced to cover positions, which adds fuel in the opposite direction.  If your a day trader, you see this everyday with the way algos trigger stops, lure in shorts/longs and move the opposite way.  Just as it does so in the bigger picture as shown above.  

Currently, it is buyers that have been forced into the market this month that are on the hook. Buyers must defend pullbacks to maintain control.  One can make excuses for why or how the market moves, however at the end of the day, it's about supply/demand.  If there is more supply caught above then demand, you have overhead resistance and weight on the market where that supply is forced to liquidate, moving the market in the opposite direction.  As always, time will tell and the X factor is the velocity of a move.  


ES Weekly 2021 05 9 55 28 PM

Tags:
Continue reading
3421 Hits

The Reset and Squeeze of 2020

ES Daily 2020 12 30 12 19 10 PM


Before politicians or anyone began to talk about "The Great Reset", we titled our article from March 22, 2020 just that.  It was based on the fact that the upside chase since the 2016 election had created a trap in February that was popped by the coronavirus pandemic and fueled lower with longs being forced to liquidate.  The move, dropped the market right into a low of 2174 on March 23rd, resetting all of the gains from the 2016 election and retesting the breakout which provided longs a key level to defend to prevent further losses. 

Things were looking grim.  Coincidentally just when the market reset all of its gains from the 2016 election, the market found its bottom, as bearish sentiment reached a peak and the Fed initiated more programs to support the market.  Technically the 2170 level provided a bounce, however the support from the Fed provided the opportunity to bounce back, and using shorts as fuel to squeeze the market back higher.  On March 23rd they lifted the cap on their asset purchases from $700 billion to unlimited.  They also announced a $300 billion credit program.  

The probe below the prior week lows of 2260 failed to expand, luring in shorts below into a low of 2174 before recovering 2260 to trap shorts and setup a shrot term failed breakdown.  This failed expansion lower forced shorts to cover as sellers lifted and the market bounced back to 2600.  

This was a defensive bounce and short squeeze which led up to the Fed announcing a $2.3 trillion dollar lending program in the beginning of April that held the market maintain its bounce and work its way higher.

By the end of the 1st half the market had retraced all of its losses back to retesting where the bottom fell out at 3225 which was the 6 month reversal window after the bull trap was set earlier in February.  

The 2nd half of the year provided new 6 month volatility windows with the first 2 weeks of July being the opening range that set the tone for July-December.  July saw the market press against 3235 only to see buyers step up in July to break above the 6 month volatility window at 3250 which was set by July's opening range.  By holding above this window, a bullish 6 month bias was established, which saw the market squeeze into new ATHs, recovering the February high, to 3587 on September 2nd, before retracing to retest the vol window at 3250.  Retest of the vol window was defended to keep buyers in control, which was followed by another test in October that also held up.  So long as the market is above this window, buyers that bought the market above are in control and have opportunity to expand the market higher.  With the election of 2020 being out of the way, the market continued higher.  Positive news on COVID vaccine on November 9th  started a new wave higher, forcing longs to chase into new highs as the market created a bullish channel that is being expanded into the end of the year, following through on the bullish 6 month bias that was set in the 2nd half of the year.  

Chase creates risk, as we saw in early 2018 and 2020.  Going forward, as we close out the year of 2020, the new year brings us new opportunities and windows.  The first 2 weeks of January is considered the opening range which can set the tone for the 1st half of the year.  The opening range will also establish 6 month volatility windows above and below the market.  The windows provide the market an area to trade within, or overcome to establish a bias (bullish or bearish) to trend, or become traps if buyers/sellers fail to expand.  In order to establish a bias, 5 daily closes above a window are needed.  Once a bias is established the other side turns into a reversal window.  We like to use these windows to look for trends. We also like looking at the windows to create potential traps, as we saw in early 2020.  Most of the gains came in the months prior November and December, so the break above the upper vol window in February lured in late buyers that failed to expand, thus creating the trap which saw the reversal window at 3235 fail to hold, which forced longs to liquidate, accelerating the downside.  

With the 2nd half of 2020 closing on the highs of the year, the start of the new year will show us if the market can expand on these gains or attempt to correct in search for support lower.  Shorts have been grinded out since the March lows, but also recently since the vaccine news which has also lured longs forced to chase above the September high. Going forward, the low from the vaccine news in November at 3500 is key as losing this would put pressure on retesting the November election and low of 3243.  


dx1230

Keep an eye on the dollar index. As stocks bottomed on March 23rd, the US Dollar also topped that day, with a high of 10396.  

We wish everyone a healthy, safe, and prosperous new year.


LIMITED TIME: Get 50% off your first month of Futures Pro Monthly. Includes access to live trading room/screen share, nightly reports, and the 6 month volatility windows for January - June of 2021. Use coupon code "newyeardiscount"


Continue reading
1771 Hits

The Great Reset of 2020

ES Monthly 2020 03 2 50 35 PM


Since the financial crisis in 2009, the Federal Reserve worked overtime to prime the market with quantitative easing and low interest rates.  The punch bowl was spiked until the music suddenly stopped in February.  Now that the music is off, people are waking up to the fact that the emperor has no cloths.  After a series of hiking rates last year, the Fed cut rates back to zero, and now doing daily $1 trillion dollar repo operations in an attempt to support the market's.  So far it’s not working, and it will not. 

You see when the market bottomed in March of 2009 at 666 and after measures taken to stimulate the economy, the Fed never took their foot off the gas.  This is told by looking at the open gaps that have been left behind. Every attempt to correct, was followed with a higher open that never looked back.  This not only left short sellers on the hook, but forced buyers to chase the market higher.  For bulls, this was no problem, every dip was bought and the overall direction of the market was higher.  The problem with this is that rather than letting the market digest its gains and consolidate before seeking its next move, the upside squeeze was forced and continued through the Fed’s easy money policy.

Needless to say, the actions of the Fed did help the market recover from the financial crisis, providing liquidity in getting the market back on its feet.  The market recovered from its 666 to a high of 1468 in 2012.  In December of 2012 the Fed attached a 6.5% unemployment target to raise interest rates.  The gold market was "spooked", losing 1500 and beginning its correction lower.  The stock market took off in January of 2015.  The market opened higher in January and never looked back. This led to a rally into 2000 in 2014.  The NFP target of 6.5% for the Fed to begin raising rates was reached.  Did the Fed begin raising rates? No.  They pulled it and said the target was outdated.  During the period of 2014 up into the election of 2016 the market attempted to digest its gains and correct, however every pullback into 1800 was met with central banks throwing stimulus at the market.  Why? In 2014 the ECB imposed negative interest rates. In October of 2014 the Bank of Japan surprised the markets with $700 billion in stimulus.  In December of 2015 the BOJ repeated this action, surprising the markets with more stimuli. Why did we need all this aggressive action by the central banks when the markets had not only recovered into all-time highs and jobs numbers were improving? 

The action by the central banks during 2014 into the 2016 election, did not allow the market opportunity to correct in search for support.  In other words, there was no price discovery in the “market”.  If there was no price discovery, was it even a market?  By not doing so, this did not give buyers a chance to get in at lower prices.  Who cares right? If the market continued higher, no matter where you bought the market you were making money over the long run.  Well this created the bubble that were seeing pop today.  The election of Trump in 2016 was followed by aggressive policies that gave businesses opportunity to thrive.  Manufacturing jobs which were dubbed as gone were beginning to return, cutting regulations, and pro market policies led the market to expand away from 2000 into highs of 2878 in January of 2018 after Trump’s first year in office. 

What the central banks did during 2014-2016 by holding the market and not allowing for a correction, gave way for the bubble to be created as the market expanded away after the election.  The market attempted to correct in 2018 after peaking at 2878 in January, falling to a low of 2316 in December.  Volatility returned and buyers that chased the market in 2018 were either shaken out, or took pain as they saw the market go against them. Worried traders and investors began to get bearish.  This turned into a massive trap as the markets put in a V bottom in January of 2019 to set a bullish 6 month bias, expanding the market higher into new highs of 2969 in June of 2019.  Squeezing short sellers and to the surprise of longs, seeing the market recover into new highs.  Once again in the second half of 2019 the market attempted to correct, in August the market established a bearish bias that lured in short sellers, failing to see expansion in October.  As the market attempted to correct, what did the Fed do? Did they allow the market to discover price? Allow it to function normally? Whether it was to correct or not? No.  The Fed announced plans to expand the balance sheet and insisted it was not QE. On November 1st I asked a question, was a short capitulation coming? I asked this because short sellers from August and October were caught on the wrong side with the market reversing its bear bias late October and those short sellers were fuel to expand the market higher. The market never looked back.  Short sellers were forced to cover, expanding the market up to a high of 3245 in December. 


So after the market attempted to correct in 2018, longs were given a scare, but were saved in 2019.  If they saw stocks go against them, they were given a second chance to get out.  You know the saying, bulls make money, bears make money, and hogs get slaughtered? Well 2019 was a gift from the Fed to bulls to take their profits.  What do you think happened? Did bulls say ok now it’s time to get defensive and take profits? Absolutely not.  Bulls got greedy.

 In an article from CNBC on January 19, it said:

“Investors with $1 million or more in brokerage account are significantly more bullish than they were a quarter ago”

In the article, it states hedge fund billionaire David Tepper saying “I love riding a horse that’s running.” Later in the article he is quoted saying “the market will get to a level that I will slow down that horse and eventually get off.”

Source: https://www.cnbc.com/2020/01/18/why-wealthy-investors-are-increasingly-bullish-on-economy-to-start-2020.html

You think the market slowed down to give him an opportunity to get off? Anyone riding that horse got violently thrown off in March.

After shorts fueled the rally in 2019, the market was setup on the highs to start the year of 2020.  I shared our volatility windows we use to indicate bull and bear levels and 3361 was the upper window.  The market needed to hold above it for 6 days to establish a bullish 6 month bias and doing so would not only lure in late buyers, but force them to defend pullbacks.  As I stated in the article, volatility windows can be used to trap late buyers and sellers.  Once the bull bias was established, buyers got lured in and they were forced to defend pullbacks.  On February 24th, the market fell into its reversal window at 3225 which was key level for buyers to defend to sustain the bull bias.  By losing this level the following day, the market trapped buyers on the year and this has accelerated the move on the downside because shorts were sidelined and the boat was tilted leaning on the long side.  When everyone is caught on the opposite side of the market, this provides opportunity and fuel to expand the market into the opposite direction.  Not only did the market fall back under the November short squeeze at 3000, but it has fallen below the December 2018 low of 2316, reversing all the gains last year, just like that.  Now with short sellers out of the way and the market trapping buyers in January and February were back to retesting levels from 2018 when the market originally tried to correct.  Anyone still holding stocks is now forced with a dilemma.  Do they take the loss, or hold in hopes of the market coming back?   This is what getting married to stocks looks like.  They are now married to their positions, and their thesis is, it’s a long term investment.  That may be so, but who knows when the market will return back to the prices set earlier in the year. 

For the market to bounce, buyers need to be fearful. You cannot expect the market to put in a bottom if buyers that got caught at higher prices are still cocky in thinking averaging down will play out in the long run.  The long run may be much longer and what is the point of getting into an investment if one is not flexible in getting out and trying to get back in at lower prices? Its greed and it’s becoming attached to a position. Many don’t want to let go of their price average from accumulation over the years, thinking the market will never return back to those prices.  The market bottoms when you are afraid to buy stocks. 

So the market has lost all of its 2019 gains, and the Fed is throwing everything but the kitchen sink at the market.  Cutting rates drastically back to zero, new quantitative easing measures, and none of it is working.  The emperor has been revealed to be without cloths.  They primed the market higher without allowing true price discovery, so now we will be getting that price discovery.  The only thing left to fight deflation is to devalue the dollar.  This is the last tool in the tool box for the Fed, the nuclear option. 

See Ben Bernanke’s speech titled “Deflation: Making Sure “it” Doesn’t Happen Here.”  In these remarks, there were 5 major points Mr. Bernanke pointed out as tools the Fed could use to fight deflation. 

  1. Lower interest rates to zero
  2. Buy securities from banks to expand Feds balance sheet
  3. Increase money supply
  4. Buy our countries debt
  5. Devalue the US dollar

Source: https://www.federalreserve.gov/boarddocs/speeches/2002/20021121/default.htm

The market is now looking to do its repair work from the last 10 years it was not allowed to do so.  Below we will highlight the open gaps as key reference points to the downside.  First major level support test is seen down into 1900 which retests the 2016 low of 1802.  Failure to hold this sees next major level into 1200 to retest the October 2011 lows of 1068, followed by 830-730 to retest the March 2009 low of 666.  Obviously we do not want to see this happen, but retests are inevitable.  It’s just a matter of time. Falling down to retest the low from March of 2009 would mean we are in a very ugly place in regards to our surroundings, jobs, economy, etc.  All thanks to whom? The central banks, for not allowing the markets to function properly by retracing lower before moving higher, but forcing the market up on easy and cheap money.  Kicking the can down the road, well we are finally at the end of that road and there is nowhere else to kick that can too.  Any bounce back to 2800-3000 would be key resistance to retest the bull traps set this year.  The supply caught above in the market is overhead weight and resistance that will need to be recovered by new buyers to recover and reverse. 

Welcome to the new decade. 

Corona Virus popped the bubble, but who blew that bubble in the first place? Had we not pumped this market with cheap money, we may not have reached such upside levels, but the velocity on the downside would not be as great nor the pain it has created.

The sun will come up.  Each time the market was limit down last week, the sun was still up and the birds were still chirping. We’re going through a cleansing in the market and trying to return back to price discovery.  It may be painful, but it is our medicine now to get better later.  Every now and then this takes place, and those that play it smart benefit in the long run. Let the dust settle and you will find the opportunities you are looking for.

The loss of confidence in central banks may cause people to reconsider how they are structured.


The following charts highlight the major downside gaps left open. Gaps are created when the market opens above or below its prior low or high.  Fueled by easy and cheap money, the market did not fill these gaps during the time, forcing buyers to chase.  These are key reference points for the “market”.


11/04/2016 Open Gap 2086.50

ES 60 Minute 2017 01 11 8 49 08 PM


06/28/2016 Open Gap 2029

06/27/2016 Open Gap 1994.50

ES 60 Minute 2016 08 29 8 51 25 PM


02/12/2016 Open Gap 1860.75

ES 60 Minute 2016 05 03 8 52 43 PM


02/06/2014 Open Gap 1769.75

ES 60 Minute 2014 03 31 8 55 00 PM


10/09/2013 Open Gap 1656.50

ES 60 Minute 2014 02 10 1 58 48 PM


03/04/2013 Open Gap 1526

ES 60 Minute 2013 05 15 8 56 29 PM


12/31/2012 Open Gap 1425.75

11/16/2012 Open Gap 1360.50

ES 60 Minute 2013 02 06 8 57 07 PM


06/05/2012 Open Gap 1286.75

ES 60 Minute 2012 07 26 2 01 47 PM


12/19/2011 Open Gap 1201.00

11/25/2011 Open Gap 1162.75

ES 60 Minute 2012 02 08 2 02 27 PM


08/31/2010 Open Gap 1053

ES 60 Minute 2010 11 08 2 03 39 PM


07/14/2009 Open Gap 903.50

ES 60 Minute 2009 09 23 9 03 22 PM


03/09/2009 Open Gap 677.75

ES 60 Minute 2009 05 19 9 05 07 PM


Tags:
Continue reading
3902 Hits

SP500 6 Month Vol Window Catches Late Buyers Again

ES Daily 2020 03 10 6 51 35 PM


The SP500 established a 6 month bullish bias in February which lured in buyers that were used as fuel to expand the market lower.  We wrote an article late January on the 6 month volatility windows highlighting a failure to sustain a breakout over a volatility window had the opportunity to trap late buyers, similar to what took place in January of 2018.  

You can read more about it here: SP500 6 Month Volatility Window Update

What's taken place has been almost identical to what happened in January of 2018.  Both times the market was coming off a major rally and the upper vol windows were used to lure in late buyers that failed to hold the market, developing into a bull trap that was reversed.  Current action has been sparked by Coronavirus, but the fuel that's expanded the market lower is trapped buyers that failed to hold the year low. Dip buyers failed on February 20th when the market broke below its 3D pivot range, breaking its upward momentum.  The following day on Friday, February 21st, the market fell below its 6 month vol window of 3361, which left buyers above on the hook. Monday's trade on February 24th gapped lower, trapping buyers above as it fell into testing the 6 month reversal window of 3225.  Dip buyers coming out as heroes in attempt to buy the dip (which worked so well until it failed on 2/20) failed to stop the market from reversing.  Too many longs were caught at higher prices and not enough buying to sustain the drop.  Since the door opening at 3225, the market dropped into the October low of 2855 before a defensive bounce up to a high of 3137 in March.  By falling short of the January low of 3181, buyers on the year are still holding the bag above. By holding below the reversal window of 3225 for 6 days, the 6 month bullish bias has been reversed, creating overhead supply that is acting as resistance as rallies are being sold.  The velocity to the downside and failure to hold support levels shows a lack of demand from new buyers. This is what happens when buyers are forced to chase the market, when it does come down, there are not many left, which lead to failures. 

Futures went limit down in Sunday's trade, falling 5% to a low of 2819. Once again dip buying heroes tried to step up, only to see the cash market on Monday trigger another halt with the market falling 7% before opening to see a flush into 2715.  This is what trying to catch a falling knife looks like. Tuesday's trade clipped the recent low of 2715 down to 2695 before bouncing back to retest last month's 2853 low that was lost this week.  This will be a key level for buyers to overcome for a shot at last week's failure at 2970.  Failure to overcome 2850, leaves the market vulnerable to continue trading lower, in attempt to expand lower to retest the breakout from 2500, which provides key support for buyers to defend the December 2018 low of 2316. Buyers who did not chase the market earlier this year and double down, can take advantage of the opportunity of that retest.  Whether it holds is another scenario, but the first test of the level provides buyers opportunity to defend major support from the December 2018 low.  Going forward, any rally back to the reversal window of 3225 will be key resistance for sellers to defend and buyers to overcome.  With supply being caught above, this will make it tough for buyers to recover as new buyers will need to step up to attempt to recover trapped buyers from earlier in the year. 


ES Weekly 2020 11 6 53 07 PM


Looking at the weekly chart above, you can see the market broke above its resistance trend line from higher highs in November of 2019.  This was fueled by shorts that were caught in August that failed to expand lower.  The market reversed its bearish bias on November 1st, trapping shorts and using them as fuel to expand higher. As seen in the weekly chart, you can see the expansion, led the market to break above its resistance trend line, forcing shorts to capitulate, and setting up this year with a higher market that lured in the late buyers that are now caught with the market falling back below. Shorts squeezed end of last year, buyers lured in this year, the downside velocity has increased because longs have been caught on the wrong side and shorts have been sidelined, which is forcing short sellers to chase the market lower.  First major support met at 2500 to retest the December 2018 low, this will give buyers who did not chase this market opportunity to defend that retest.  Failure to hold the December low, sees next major support into 2200 to retest the election low of 2028 from November 2016.  This is how the market moves, when more buyers or sellers are caught on wrong side and are used as fuel to expand the market in the opposite direction.

The Fed cut rates last week, but it was not enough. Soon they will be down to 0%, but that will not be enough either.  According to Ben Bernanke, the Fed has one more tool in their tool box, which is devaluation of the US Dollar.  If you STILL don't believe this can happen, take a look at what the US Dollar has done this year.  We warned of a bearish pattern that was developing in the US Dollar Index monthly chart in December.  If you look at the pattern, the market topped out when President Trump took office.  It has spent the last 2 years coming back in attempt to retest that failed breakout above 100.  This is a major resistance level the dollar will have to overcome for another shot at the 2017 high.  Failure to overcome puts in the lower high and sets up a failed retest that can lead to lower prices.  Obviously no one wants to see the dollar devaluated, but if things get ugly and cutting rates no longer work, it is an option the Fed has and it's better to be prepared for it then not.  Gold is benefiting and already recovered where it failed in December of 2012 when the Fed hinted at higher rates. Here we are, 7 years later and instead of higher rates, they're back to cutting.

Will President Trump Devalue the US Dollar?

2018: The Year of the Bull Traps

January 2019 Bullish Cup/Handle 

November 2019 Bearish Bias Reversal

January 2020 Bullish Bias Trap


Continue reading
2463 Hits

SP500 6 Month Volatility Window Update


ES Daily 2020 01 20 10 56 14 AM


To start off the first half of 2020, the 2 week opening range in January saw the market make a high of 3263 before correcting down to 3181, once again seeing sellers fail to expand lower as the market reversed off this low to overcome 3263.  Taking that range of 3263-3181, gives room up to 3345, and as the 2 week opening range closed out last week, the market came close to this with a 3330 high.   With the 2 week opening range now completed, we have a new set of 6 month volatility windows and pivots for January – June 2020.  The 6 month volatility windows come in at 3196 x 3361.  In order to establish a bullish or bearish 6 month bias, the market needs to close above/below the vol windows for 6 trading days.  Only one bias can be created, once a bull or bear bias is created, the other side turns into a reversal, as seen in the 2nd half of 2019.  Sometimes volatility windows can also be used to trap late buyers and sellers.  Since we are coming off a reversal expansion since November from 3035 up to a recent high of 3335, the upper vol window of 3360 will be key as to what the reaction to the level will be.  Will the market stall and run out of fuel into testing this level, or will it be able to hold above for 6 trading days to establish a bullish bias and lure in buyers above.  Buyers will be forced to defend pullbacks in attempt to continue trending higher.  Failure to sustain the breakout over a vol window has the opportunity to trap late buyers above, similar to what took place in January of 2018 https://twitter.com/Chicagostock/status/959475640910209024.

Tags:
Continue reading
3390 Hits

US Dollar: Major Correction Coming?

DX12 28


When President Trump was inaugurated in office, the US Dollar topped out with a high of 103815 in January of 2017.  In March of 2017 we wrote, "Will President Trump Devalue the US Dollar", highlighting Trump's comments about the currency, as well as the Bernanke's comments of dollar devaluation as a tool to fight deflation.  One year later, February of 2018, the dollar made a low of 88150, falling 15% from its January 2017 high.  For the last 2 years since this low, the market has worked its way higher in attempt to retest the failure in January of 2017.  The retest is technically major resistance for sellers to defend and buyers to overcome.  Thus far, the dollar has put in a lower high and is slowly backing away. Going forward, the dollar will need to overcome 100 for another shot at the high.  Failure to overcome 100 leaves the market vulnerable to continue falling in attempt to retest the 2018 low which is considered the neckline for a large monthly head/shoulder topping pattern that has developed.  A head/shoulder topping pattern is created when the market takes out a prior high to make a new high (01/17), failing to expand on the new high and falling back to take out the prior low (05/16).  By taking out the prior low, the breakout into the new high is considered a failed breakout. The low made after the breach of the May 2016 low is considered the neckline at 88150 as the market has bounced off this low in attempt to retest the failed breakout.  Breach of the neckline will be key. As breaking the neckline can see sellers chase the market to force expansion of 15.665 range (103815-88150), down to 72485 (88150-15665). The precious metals markets (gold/silver), have already seen a recovery as they have broken away from their multi-year downtrend.  Gold squeezed back to retest the Dec 2012 low of 1520, and has taken a pause since then, consolidating the gains.  Any further weakness in the USD would provide opportunity for the precious metals to push past these resistance levels in attempt to retest their highs.  


Reference: Will President Trump Devalue the US Dollar 

Continue reading
2204 Hits

2018: The Year of the Bull Traps


The year of 2018 has been a year that has lured in buyers, only to trap these buyers as sellers took profits into the rallies.  In the beginning of the year, we saw the market stampede from 2700, through 2800 into a high of 2878.  The move over 2800 (the 6 month volatility window), lured in buyers as it established a bullish 6 month bias, that were forced to defend pullbacks.  These buyers turned into "bag holders" a term used for late buyers, as the market fell below 2800 to trap the longs.  Liquidation below the year low came fast.  Reversing the 6 month bull bias, and turning 2800 into resistance as buyers were trapped above, creating overhead supply.  For the rest of the 1st half of 2018, the market was walked higher, from 2529 up to retesting 2800 before going into the 2nd half of 2018.  In the 2nd half, July, new volatility windows were set.  Once again, the market broke through its upper vol window (2816), establishing a bullish 6 month bias and once again luring buyers.  This time around, buyers were able to convert 2800 into support, allowing a move to overcome the January 2878 high.  The breakout over this high lured in new buyers and stopped out shorts, pushing the market up to a high of 2947.  After failing to overcome this high in October, falling short at 2944.75, the bottom fell out, seeing the prior month low of 2865 (September) taken out.  Thus has once again led to a waterfall effect that forced buyers to defend the 6 month reversal window of 2737, based off the July low of 2698.  First test of this level saw buyers with their backs against the wall, forced to defend the level to prevent another reversal bias.  Bulls managed to squeeze the market back to retesting the 6 month vol window at 2816, however failed to overcome the level.  This once again has left buyers above the 6 month volatility window on the hook, showing more supply is trapped above, then demand.  The return to the reversal window at 2737 has saw buyers fail to hold, after using most of their ammo on the first test.  Buyers are out of ammunition.  How many more times can they double down?  This has led to the July low of 2698 to be taken out and as of now, the market has closed below its 6 month reversal window of 2737 for 2 days.  5 daily closes below reverses the 6 month bull bias, giving way to expand the market lower once again.  The correction in the market began in February.  However the market spent the next 7 months grinding out shorts and luring in new buyers.  With shorts being stopped out as new all time highs were made, new buyers are again on the hook with the failed hold of the September low at 2865.  


Buy the rumor, sell the news? 


As seen in the monthly chart above, the "Trump rally" started in November of 2016.  Seeing the market breakout from 2170 into a high of 2878 in January of 2018.  For those that follow our work, we pointed out how the Trump V bottom on election day projected 2300.  Obviously the market went much higher, however the buyers that came in to start January of 2018 were the late buyers that panicked in.  They were corrected down to a low of 2529 in February.  From this low, the market spent 7 months grinding out shorts as the market was walked up to take out the January high, luring in new buyers, only to fail in holding above and turning right back down to take out the July low.  This has created a "failed breakout" as new longs above 2800 are now on the hook.  Rallies up to the September low of 2865 provides new resistance for sellers to defend and buyers to overcome to recover the trap above.  Next major stops in the market are seen below the year low of 2529.  Below this low, opens the door to retrace the "Trump rally" from 2200 back down to that level.  Big move? Yes.  Impossible? No.  No guarantee this will take place, however doing so would retest where the market broke out and provide buyers an opportunity to defend the breakout.  In the long run, this would be considered a "healthy" correction.  Unless you think the market going up every month is healthy.  


If you want to see how the October 2018 correction started, check out this link: https://t.co/z3RZmSa8mq

2018 January Correction: http://www.chicagostocktrading.com/blog/sp500-january-2018-mirrors-january-2016-1.html

2016 Election V Bottom: https://twitter.com/Chicagostock/status/801150246906687489

2016 February V Bottom: https://twitter.com/Chicagostock/status/701882994844311553


Continue reading
47860 Hits

How the January & March corrections were repeated in October

Tags:
Continue reading
1566 Hits

SP500 Relives February 2nd, Will it Relive February 5th?

When Cohn resigned, the SP traded to a low of 2681 before turning up to close at 2723.  The following day, March 8th, the cash market opened above 2730, leaving shorts from Wednesday trapped as the market settled at 2744.  The following day on NFP Friday, the cash market opened at 2759.75, forcing shorts to cover as the market used trapped shorts to fuel a move through the prior high of 2789.  After taking out shorts above 2790, new buyers were lured in on the breakout, this breakout ran into testing major resistance from the February 1st gap of 2822.  By failing to overcome the level, the market showed more supply still trapped above, converting the level into resistance as the market fell back to 2745 to retest the NFP low of 2735.  Over the last 3 trading days, the market fought to hold 2745, however was unable to overcome 2768, leaving buyers from last week on the hook.  This also gave the opportunity to repeat the pattern seen on Jan 30 - Feb 1, creating an inverted cup/handle pattern.


Continue reading
2518 Hits

SP500 January 2018 Mirrors January 2016


The SP500 started this year, zooming through last year's high and charging up to 2800.  This 2800 level is the 6 month volatility window in which 5 daily closes above established a bullish 6 month bias, forcing buyers to buy the breakout. The bias was established on January 24th, when the market completed its Cup/Handle target created on January 17th, after recovering its prior high of 280850 based off the January 16th low of 276925.  The market expanded this Cup/Handle up to 2846, seeing 2 days of consolidation, before expanding higher on Friday January 26th.  The breakout over the prior ATH of 2855 lured in new buyers, in which were caught when the market fell back under fell back under the January 24th low of 282550.  Over the last 2 days, buyers have fought to defend this level, seeing the market fall back to its Cup/Handle breakout of 2810 in which buyers defended, however were unable to overcome 2840.  Today the cash market opened lower, leaving longs trapped above and forcing sellers to chase lower, giving way to fall back under 2810 and target sell stops below the January 16th low of 276925 that began the move up.  By falling under 2800, buyers who bought the breakout above are now on the hook as the market falls back to test its 6 month pivot of 2751.  Buyers will be forced to defend this level, to prevent further damage, however as the Midcaps are showing, a move below the 6 month reversal window of 2717 and 5 daily closes below, will reverse the 6 month bullish bias into a reversal bias, giving way to expand the range of 211 (2667-2878), down toward 2456, which retraces the market back to test its breakout from September.  Rallies back to 2800-2810 now offers new resistance as supply is caught above, for buyers to overcome and sellers to defend.  Buyers will need to squeeze shorts through the February high of 2837 in order to get another shot at the high.  Failure to overcome 2800-2810, leaves longs vulnerable to see a shakeout under the 6 month volatility window of 2717.

Continue reading
3898 Hits

Here Comes Santa Claus

Santa Claus came a week early to Wall Street with the SP500 breaking through 2665 on Friday.  As seen in the above chart, since the September low of 2485, the market expanded its rally into the November high of 2594 by 100% as it ran into 2665 earlier this month.  There was an initial break off the level that caused the market to fall into 2605 which was fueled by "fake news".  The market recovered off this low to make another run at 2665, before pulling into test 2620 as the November 29th low prior to seeing the break down to 2605.  This level held, trapping shorts below as buyers marched back to press against 2665.  The breakout seen this past Friday through 2665 has the market testing its 127.2% fib at 2694, with the 161.8% extension seen at 2732. Last week's 265175 low is now key for any downside shakeout/reversal.


Tags:
Continue reading
2805 Hits

SP500's Trouble with 2665 and Thursday's Vol Windows Defined

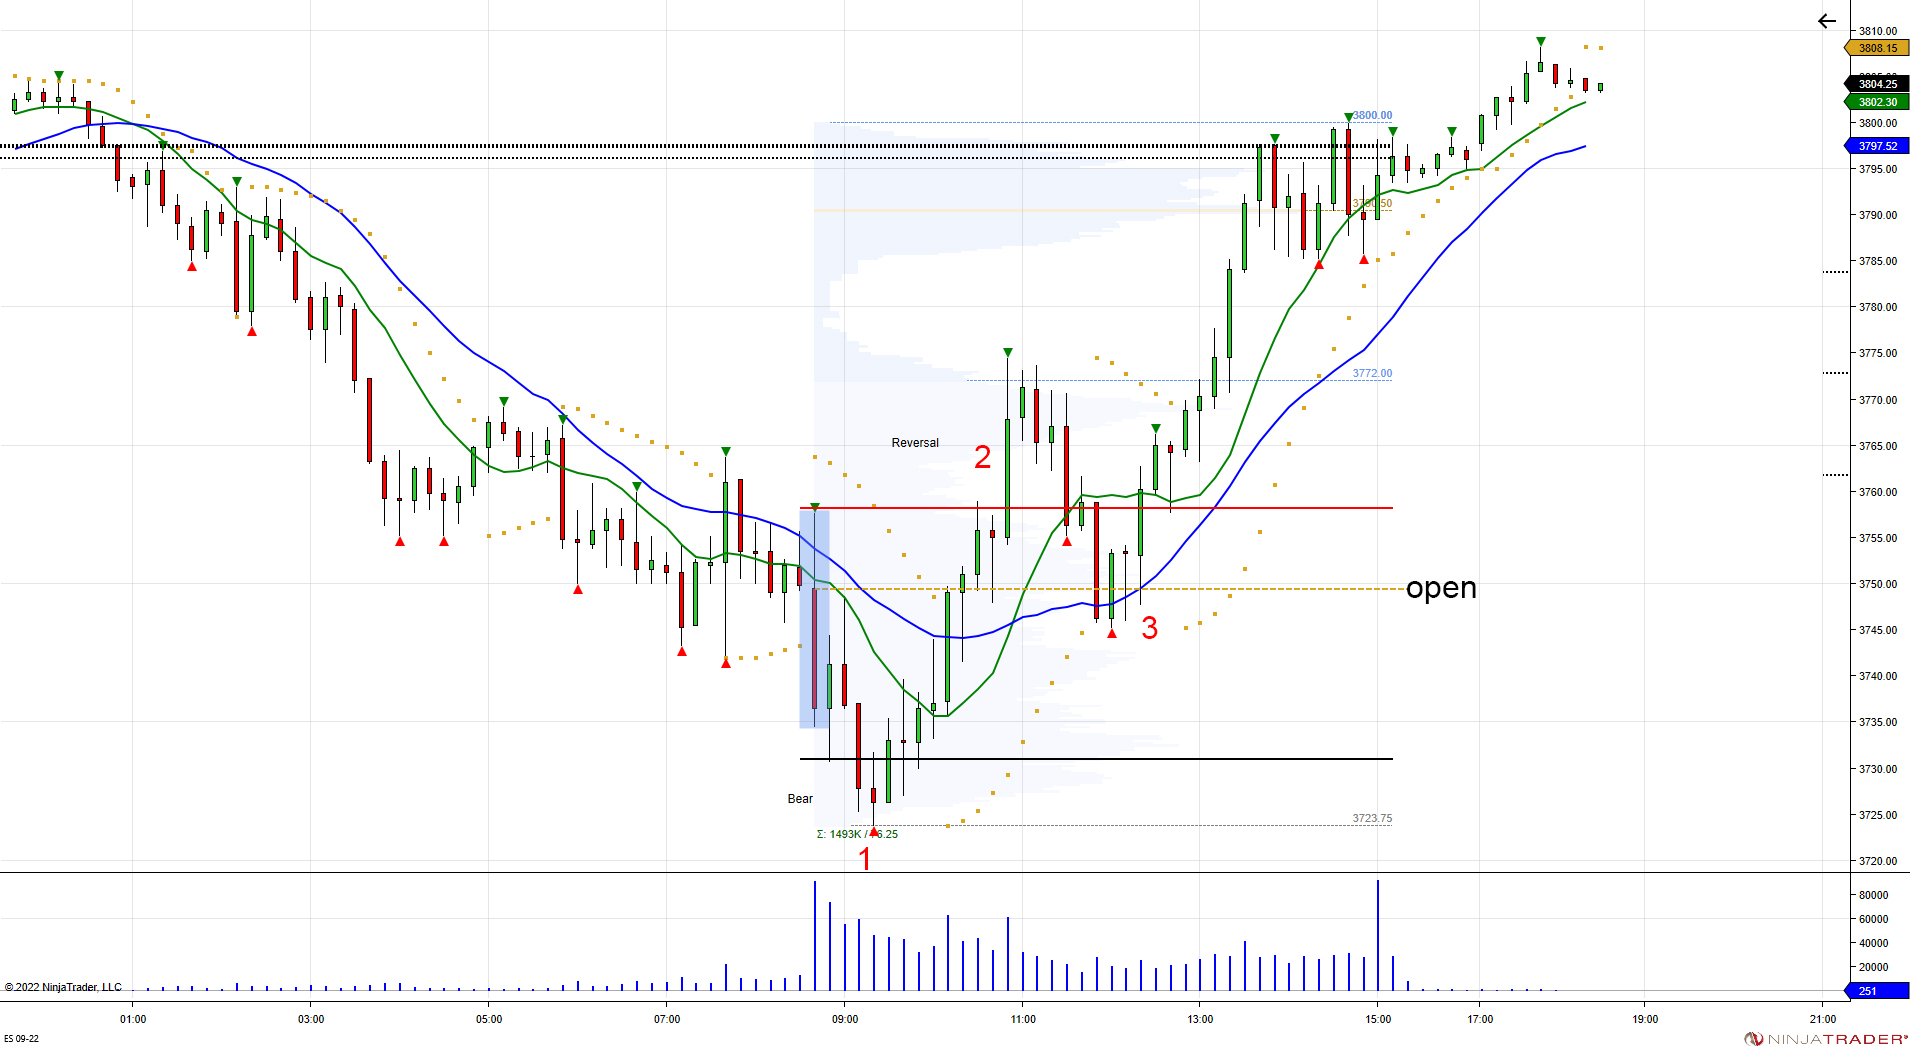
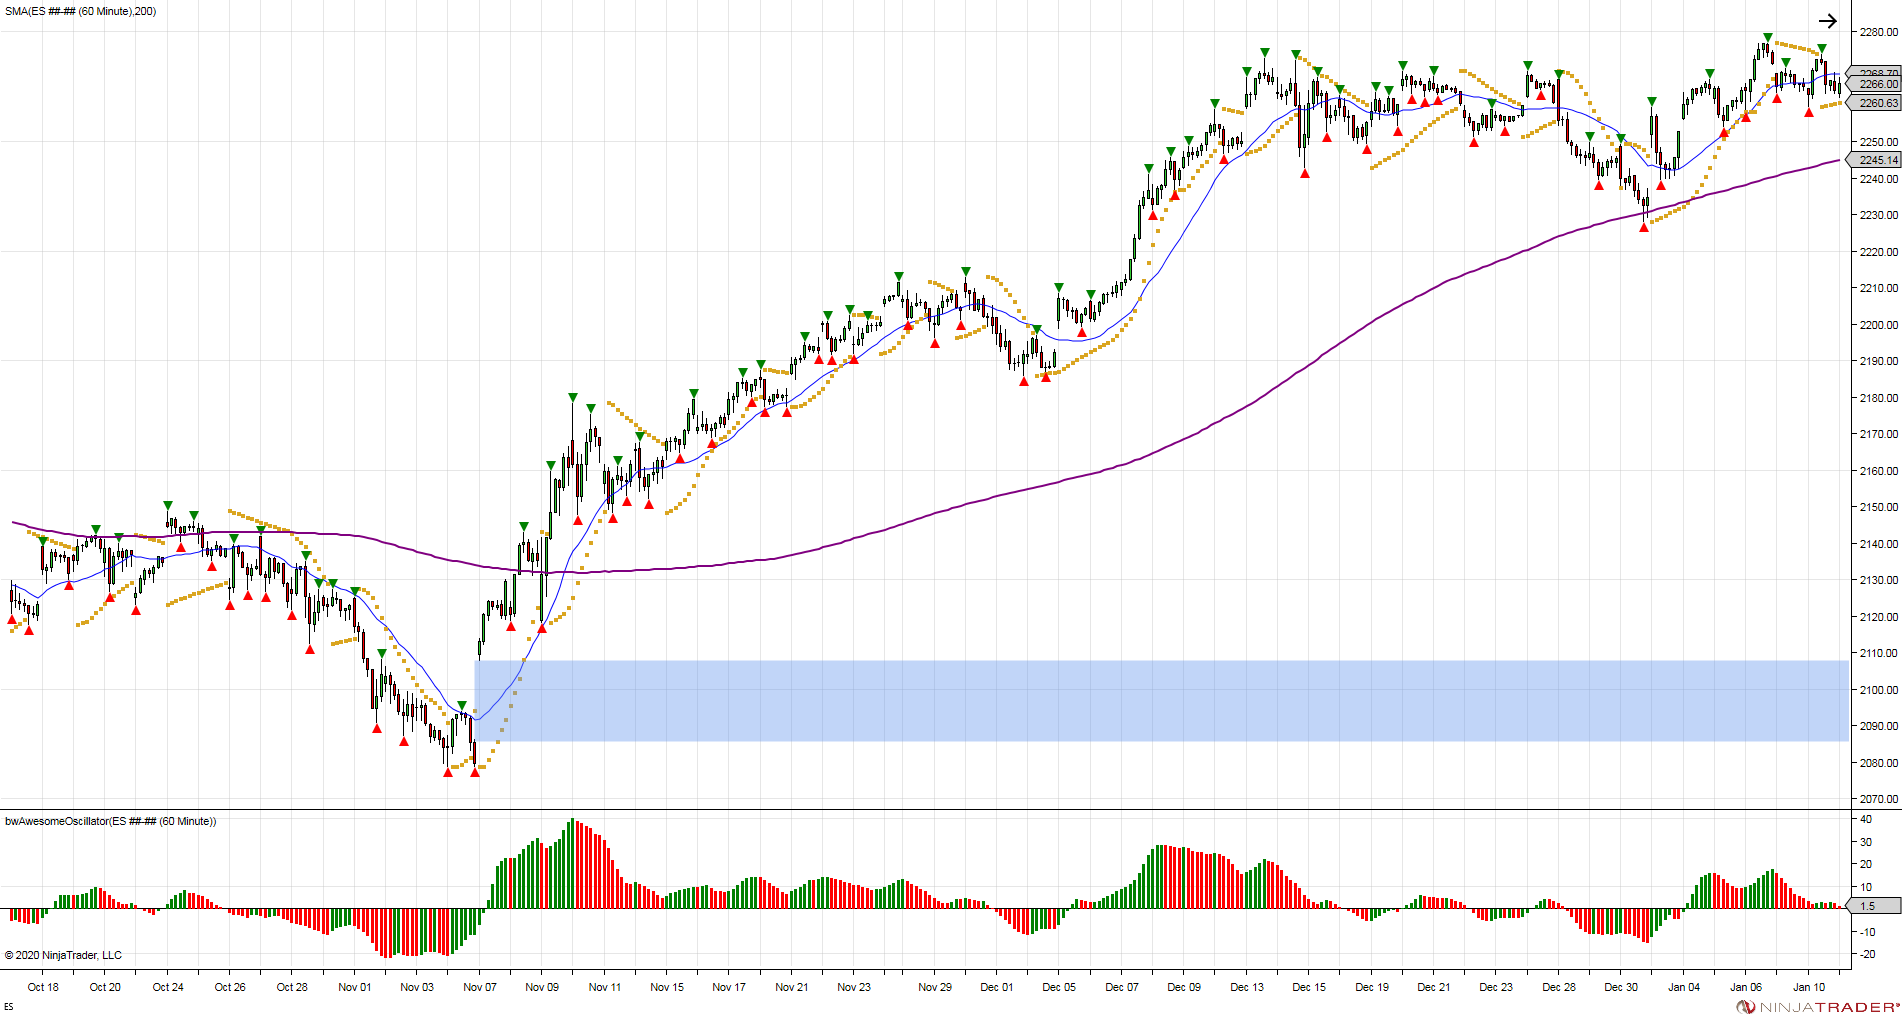
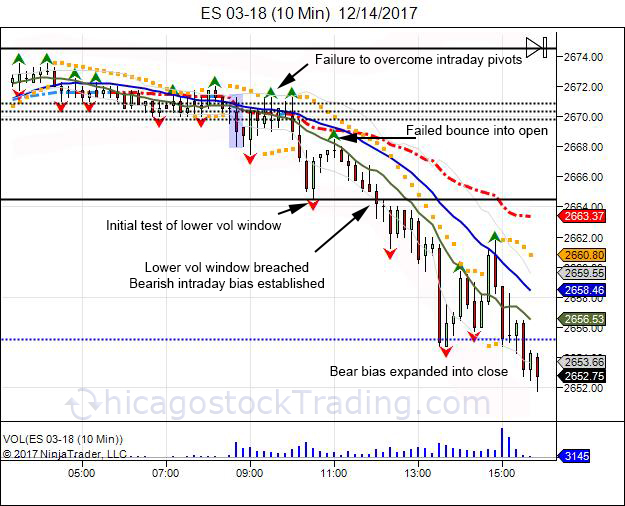
On Thursday, the day after the FOMC statement, we review the intraday action in regards to Chicagostock's Volatility windows and pivots.  The highlighted blue box, is the cash market open, NYSE 930 AM.  After the open, the cash market had trouble overcoming the intraday pivots, seeing the range act as resistance.  This led the market to fall into the lower Vol window which was met with a defensive bounce.  The defensive bounce gave way for a retest of the open, giving sellers an area to defend and buyers major resistance to overcome.  For buyers that picked up the initial test of the lower Vol window, this provided a bounce to take some profits into.  Second or third attempt at the lower Vol window, increases the odds of seeing the level failing. After failing to overcome the opening range, the market drifted back toward the lower Vol window which was taken out. In order to establish a bearish intraday bias, a 5 minute hold below the lower Vol window needs to be seen.  Sometimes the market can establish a bias, and bounce back to the open to again force sellers to defend their intraday trend.  In this case, the second test of the lower Vol window saw the level taken out, establishing a bearish intraday bias.  Since there was already an early bounce off the lower Vol window, there was not another one and sellers expanded the market lower, forcing longs to liquidate into the close. 
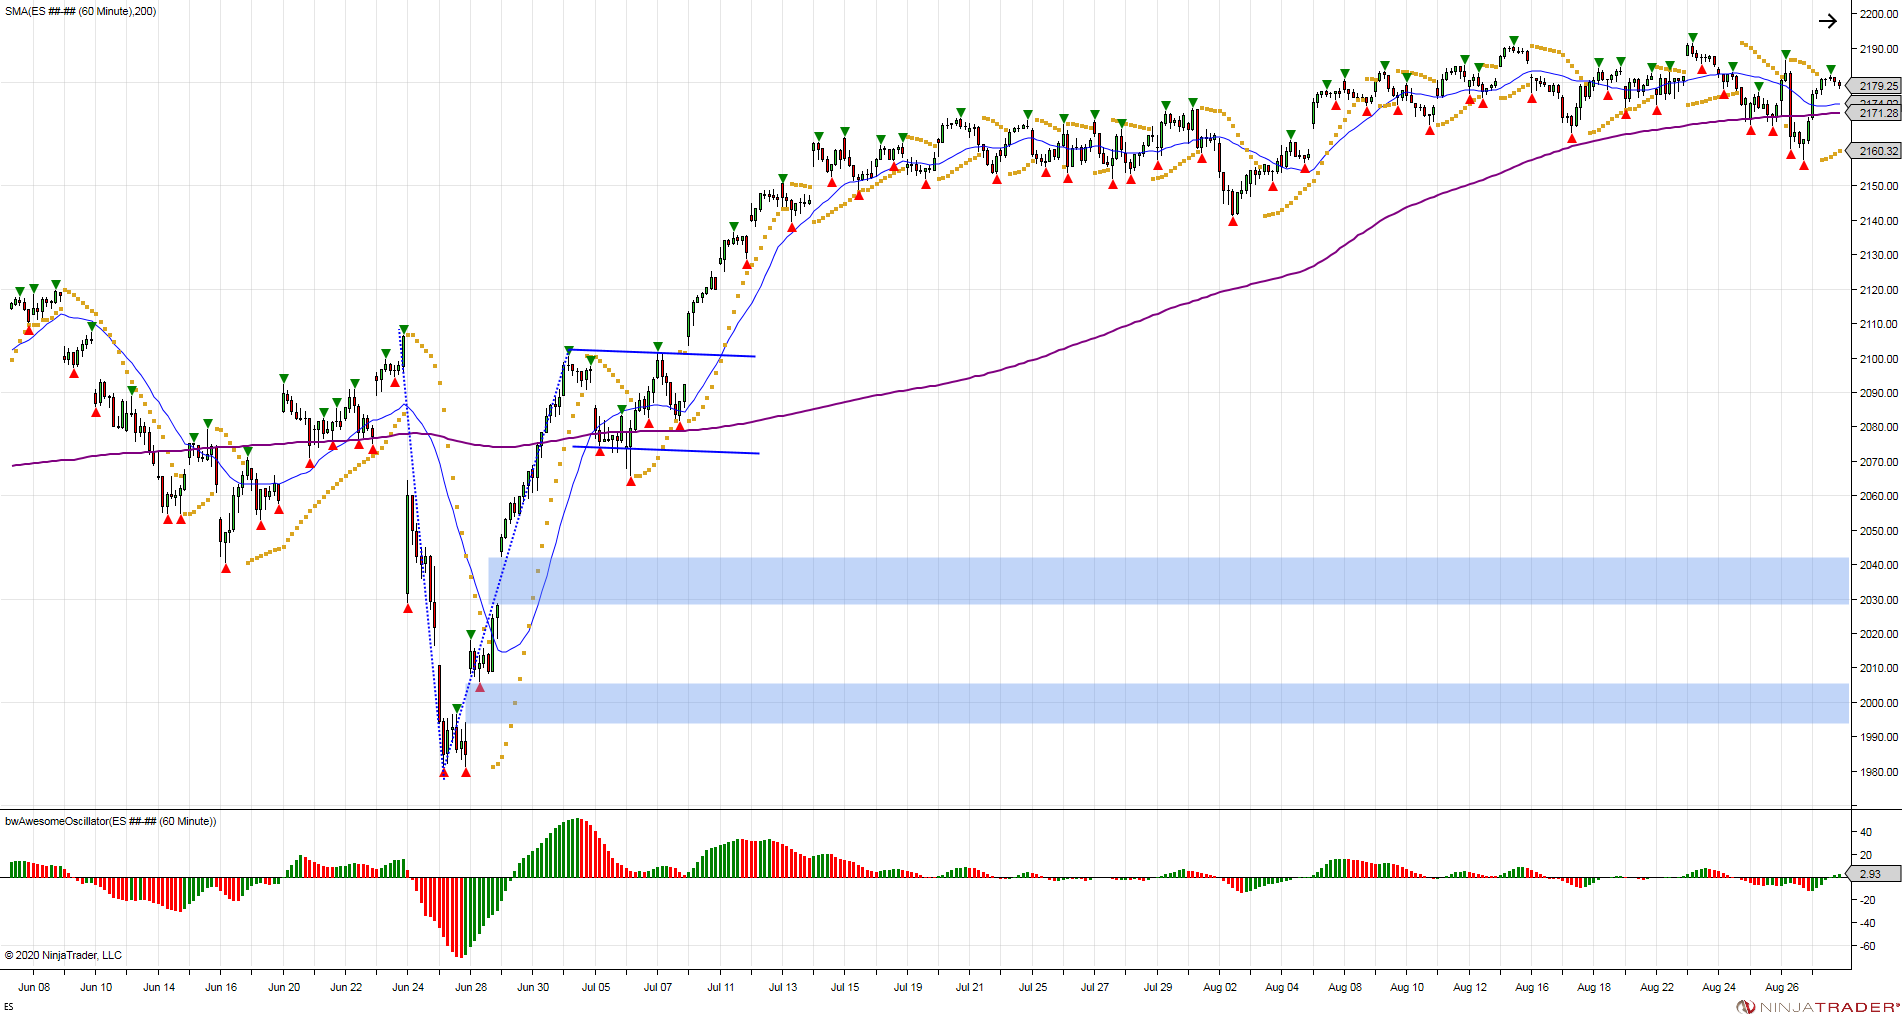
 

Continue reading
2475 Hits

2623 & 2665

Right before Thanksgiving, there was one technical pattern that was yet to be completed, the inverted head/shoulder projecting 2626 seen here. When the market made new month lows on November 15th and recovered, this created a bear trap with a minor inverted head/shoulder pattern that completed the next day at 2587. After squeezing off the low and completing the small inverted head/shoulder, two new patterns developed.  The pullback into retesting the November low gave buyers an opportunity to defend the low, in turn creating a right shoulder for a larger inverted head/shoulder pattern, targeting 2623.  Inside of this right shoulder, a minor cup/handle formed, projecting a breakout over the neckline of 258950 to test 2600.  After pushing through 2590, the market overcame its last high made on November 16th, aka the "neckline", giving way to expand the larger inverted h/s pattern from 2589 up to 2623. It took 5 trading days to get to this objective on November 28th.  After running into 2623 and completing the inverted head/shoulder technical pattern, this is where the market became sloppy.  Buyers were not done. Buyers rushed into the market on November 30th in anticipation of the tax bill passing the senate, pushing the market to make a high of 265850. The next day after this high, news came out alleging President Trump ordering Flynn to contact Russia as a candidate, not as the President elect. Nonetheless the market flushed down to a low of 2605, before recovering to settle the market at 2644 and await the tax vote into the weekend. Over the weekend the senate managed to pass the tax bill, which saw Sunday's futures gap 10 higher on the open at 2654.  The higher open lured in new buyers, run into the 2665 100% Fibonacci extension where the lid was met and resisted, dropping the market back to Friday's settle of 2644. 

Continue reading
2266 Hits

Is This the Top?

Last week, we highlighted the inverted head/shoulder technical pattern that was created after the market made new lows for the month in November and caught new shorts on the hook.  This inverted head/shoulder pattern, gave room to expand the market above the neckline of 258950 up to 262350.  The target was met on November 28th, with the market hitting a high of 2627.  


Continue reading
2698 Hits

The Turkey Squeeze - T/A Galore: 2 Inverted Head/Shoulders and a Cup/Handle


 Last week, the market took out the early November low of 256225, falling into 255550, before quickly bouncing back to 257150.  This break of the monthly low turned into a failed breakdown and a head fake as the market retested 2562 into the end of day, creating a right shoulder for an inverted head/shoulder pattern.  Shorts below 2562 were left trapped, giving opportunity to expand the range up to 257150.  


Continue reading
3417 Hits

US Dollar Down 10%, Now What?


Since our last report on March 17th titled "Will President Trump Devalue the US Dollar?", the US dollar is down over 9%, falling from 100 down to a recent low of 90.79.  This does not mean a dollar devaluation has occurred, or will, however as we pointed out, there are risks out there that needed to be factored in, and the market is doing just that.  

Tags:
Continue reading
2219 Hits