
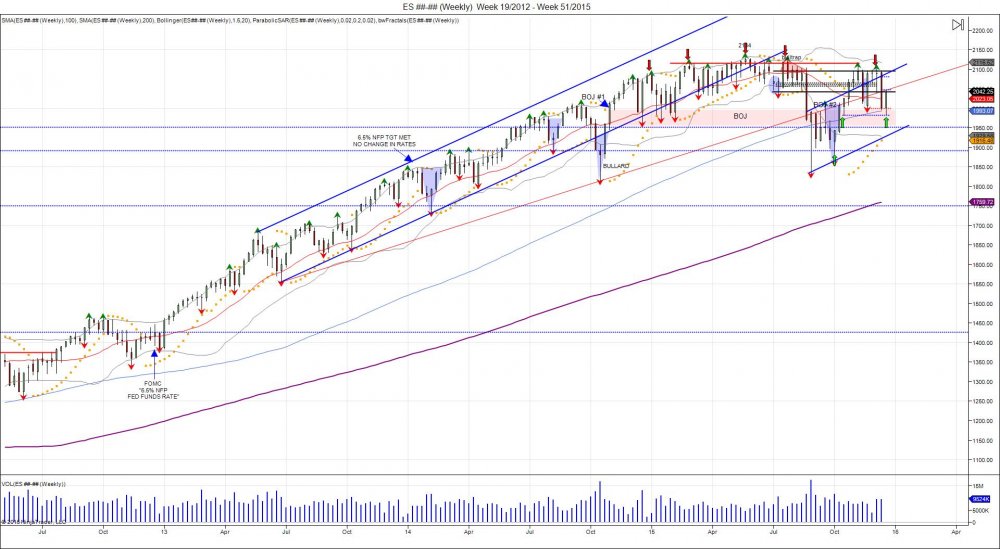
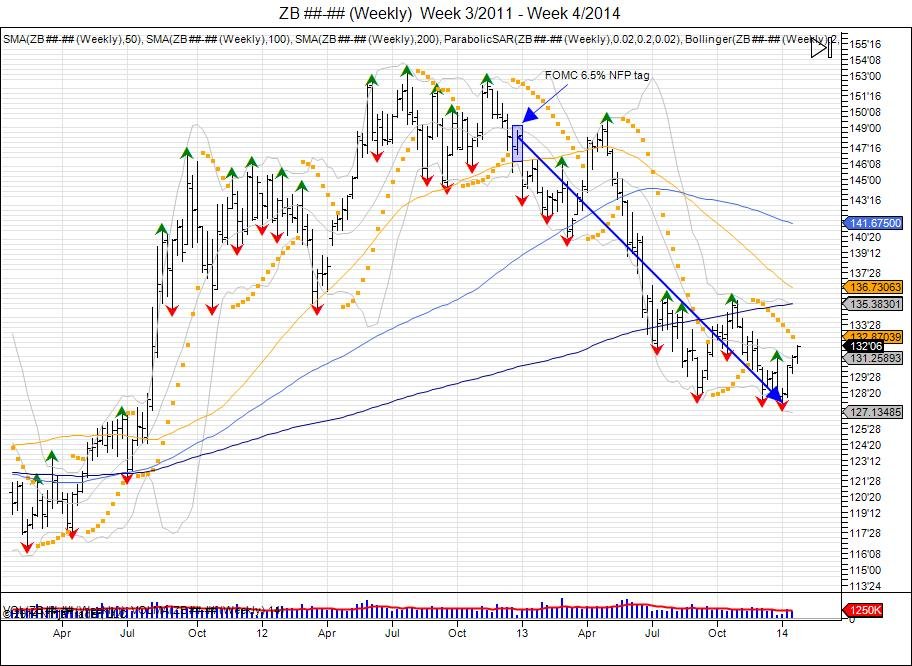
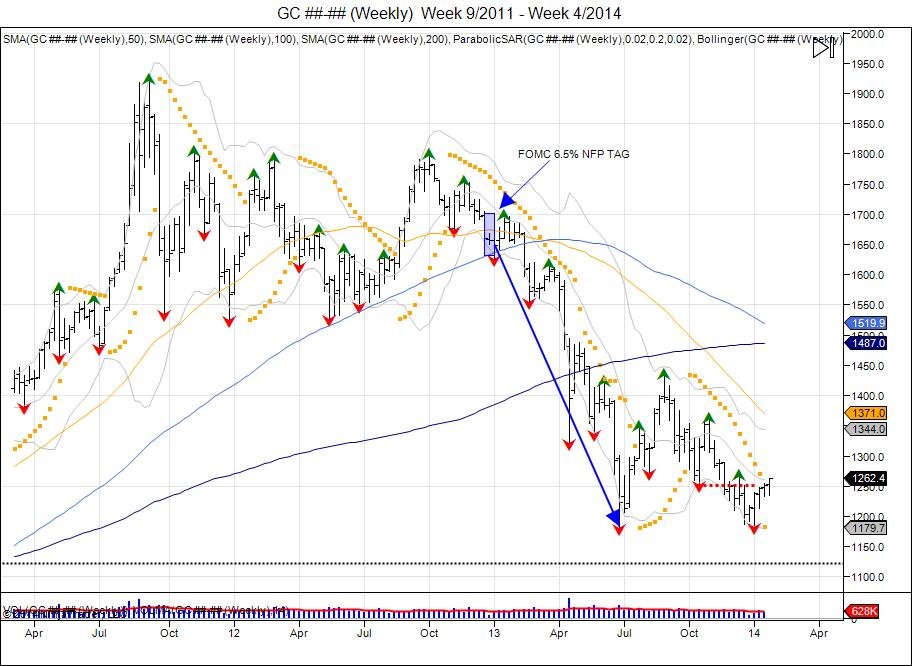
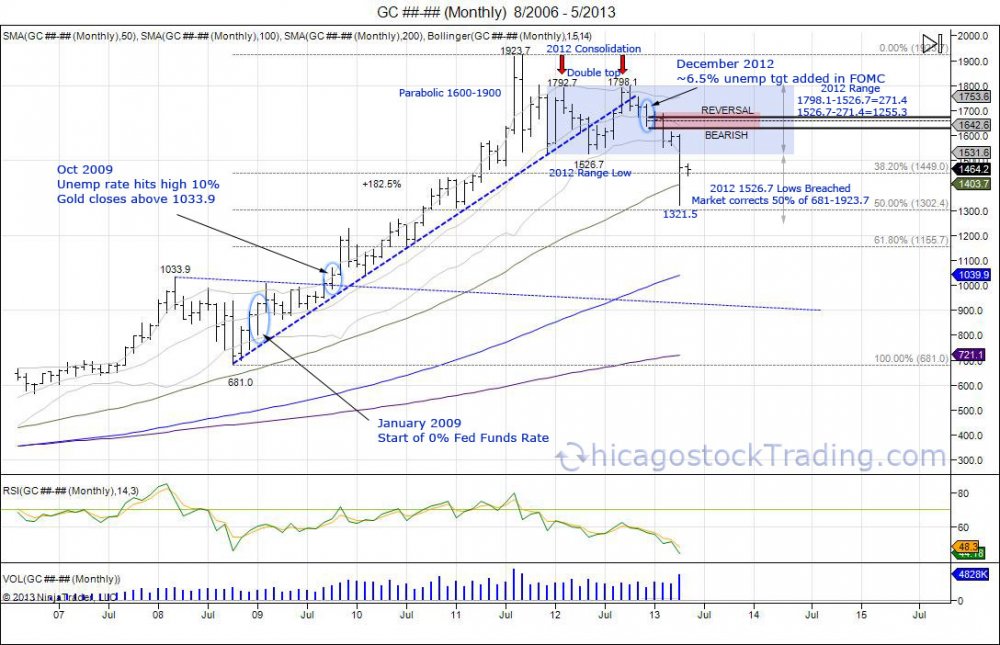
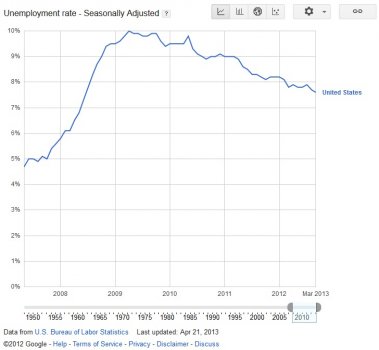
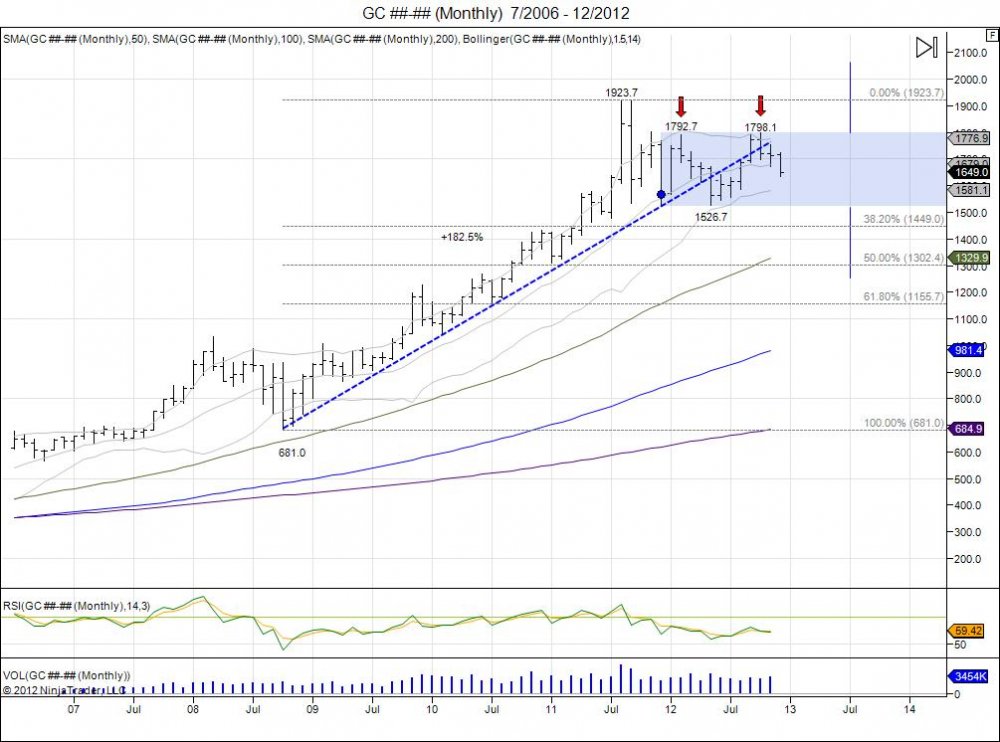
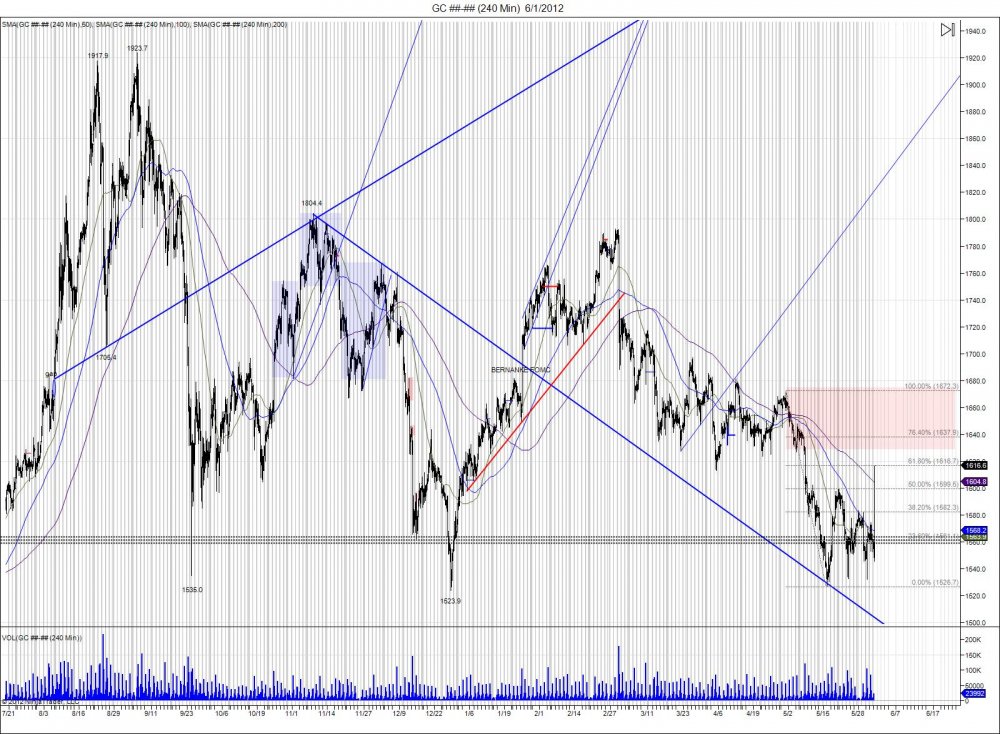
When the FOMC decided to place a 6.5% target on NFP rates to justify raising the federal funds rate, the SP500 was trading 1427, gold 1718, US dollar 7985, and 30 year bonds at 148.
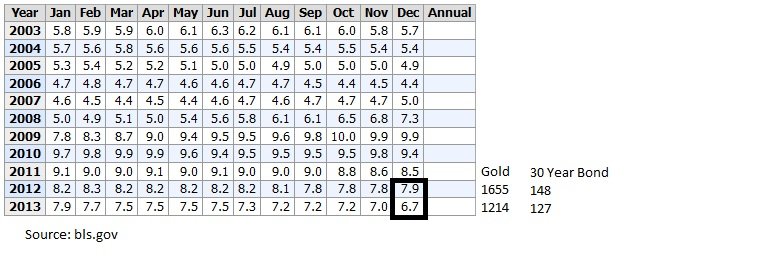
“… the Committee decided to keep the target range for the federal funds rate at 0 to 1/4 percent and currently anticipates that this exceptionally low range for the federal funds rate will be appropriate at least as long as the unemployment rate remains above 6-1/2 percent…” (FOMC 12/12/12 source).
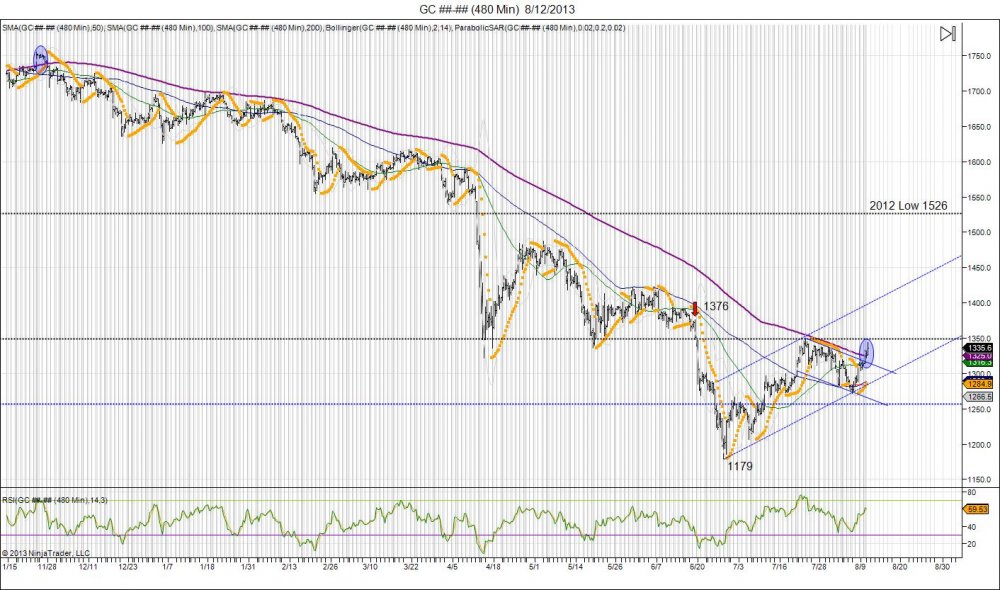
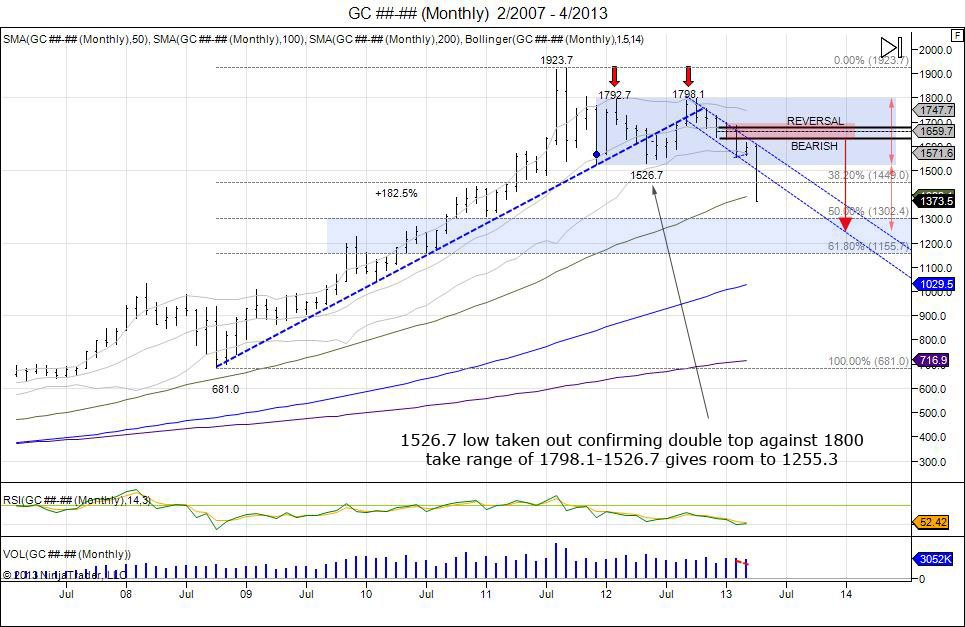
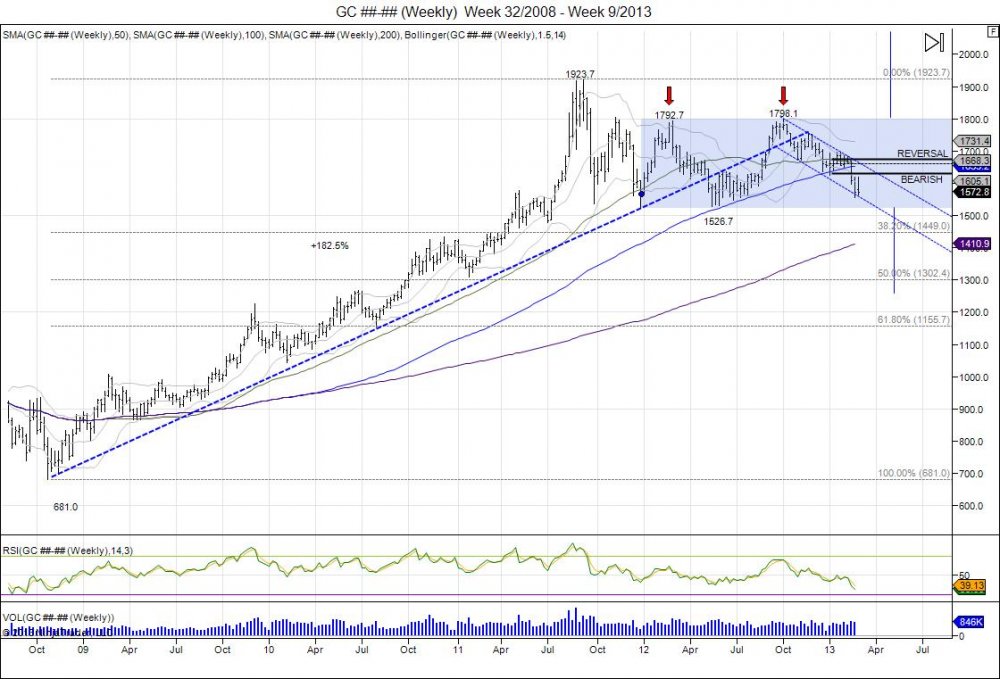
Just days after this release, we highlighted the weakness in gold: Whats With Gold? FOMC Spooks Market. Double Top Eyes 1250.
4888 Hits
 12_10_2010 - 1_27_2012.jpg)