
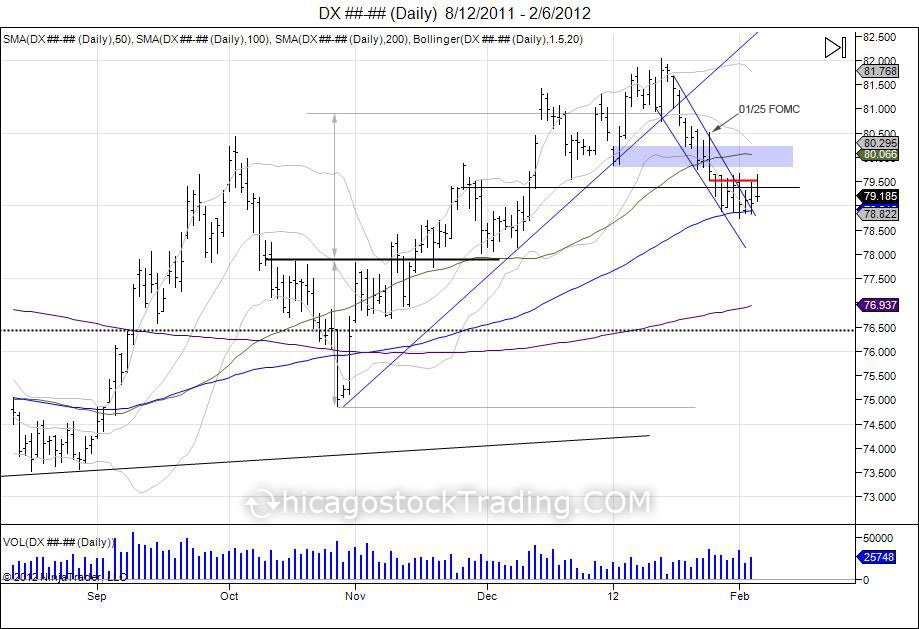
Since the US dollar put in its “Island Bottom” in October of 2010 with the failed breakdown of 74860, the market reversed to create an inverted head and shoulders with a neckline of 77855, targeting 8100. After breaking through its neckline in November, this 77855 level turned into support and the short squeeze was on as the market squeezed into completing its inverted h/s at 8100. Consolidation was seen at these highs with a tug of war taking place. The market began 2012 on Jan 3rd with lows of 79830 and highs of 80225. Following this first day of trading, the market ran into new highs, touching off at 82045 on January 13, 2012. This 8200 level turned into the last hoorah for the short squeeze, trying to get as many shorts out as possible, as the market began to roll over and broke its uptrend line from the October lows on January 18th. Following this break of the uptrend, the market began trading in a newly formed channel pointing down as it targeted the year lows at 79830. These lows for the year were eventually taken out on January 23rd, leading up to the January 25th FOMC statement by the Fed chairman Ben Bernanke. On the 25th as the Fed released their FOMC statement, the US dollar had attempted to rally, however failed. Putting in highs of 80505, only to reverse into lows of 79515. Since this FOMC and break of the year lows, this level has now turned into major resistance for the past 2 weeks at 79515. The year lows that was support at 79830 has also turned into major support as the market reversed its early momentum in the year. At this point the market has reached its 100day moving average on the daily chart and has been in consolidation mode in a fight to hold this support as upside resistance is being tested. Pressure remains to the downside now with the Jan 3rd range of 79830-80225, followed by the FOMC high at 80505 as major resistance. A push past these levels would be needed to get buyers back into control, however only leading to retest the next major resistance coming in at the year highs at 8200 where a failure would create a right shoulder. The question is will the market rally up to test this high and give sellers an opportunity to get out or continue this chase to the downside. Buyers who did not get out in time from last year’s rally are now seeing the pressure turn against them. Below the 100day moving average on the daily, next major support comes in at 77855 being the old neckline from November, followed by the October head at 74860 and year lows of 72860.
more...