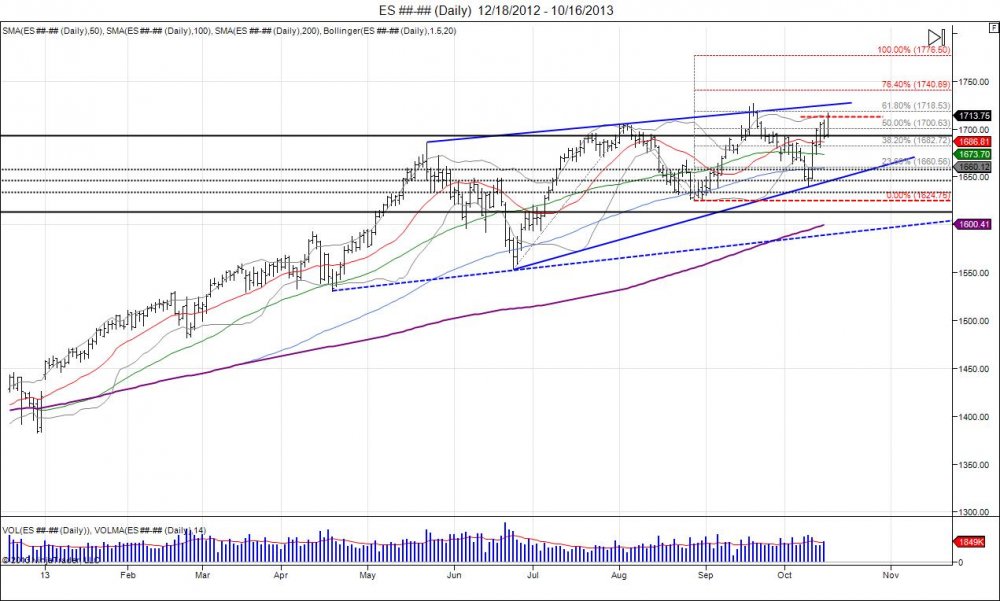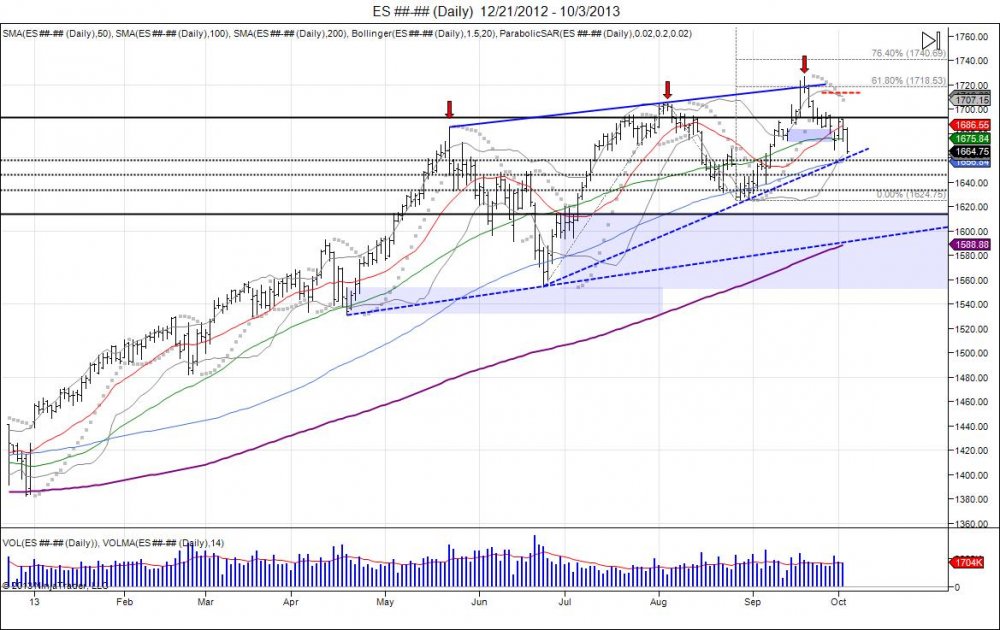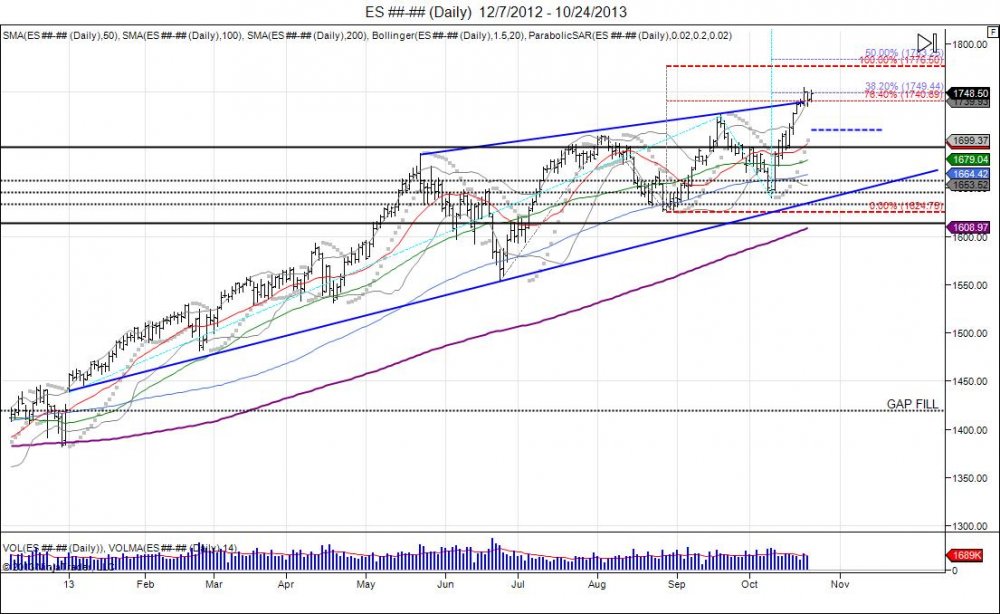
As seen above, the SP500 has enjoyed higher lows and higher highs ever since its biggest correction of the year. This correction attempt started in May, dropping the SP from 168575-155325, 7.9. Since then, we have been in this trend where higher lows have been made as pullbacks become shallower with buyers chasing the market up, and higher highs as shorts have been squeezed with the market taking out the previous highs. Anytime someone is forced to chase a market, it never ends well. The latest squeeze came as the market pivoted off 1640 and ran in the face of a government shutdown and the constant debt ceiling debate. With the September highs taken out, highs of 175450 were made this week on the NFP number release, pushing the market above its rising wedge, and testing fib extensions of 1740-1749. Wednesday attempted to see a pullback only to see the market saved as it held 1736 which has the market back to pressing the highs of the week. This is consolidation taking place as the market attempts to take a breather, yet continues the pressure against shorts and forces buyers to pay up. Push through the weekly high sees the next major resistance levels coming in at 1776 as a 100% fib extension, along with 1783 as a 50% fib extension based off the year low to the September high and October low. Falling below 1736 as a healthy market should, would give way to retest old resistance at 1710 and attempt to build new support. Without this happening, it forces buyers to continue to pay up, which gives way for them to chase these highs and next fib levels to be tested. The trend of higher lows and higher highs since the May correction has not only seen buyers desperate to buy every dip, but also brought major pain to short sellers in attempt to clear them out of the market before the carpet is pulled from underneath. The second half of the year remains in a "bullish bias" and any pullbacks down to 1620 would give buyers a major area to support this bias and keep the momentum. The question is if there will be any buyers left after the market has forced them in with this rising wedge. It will take a period of 7 closes below 1620 to reverse the bull bias and give way to target the June lows for the rug pull and move to fill the gap that began this year down to 1420s.
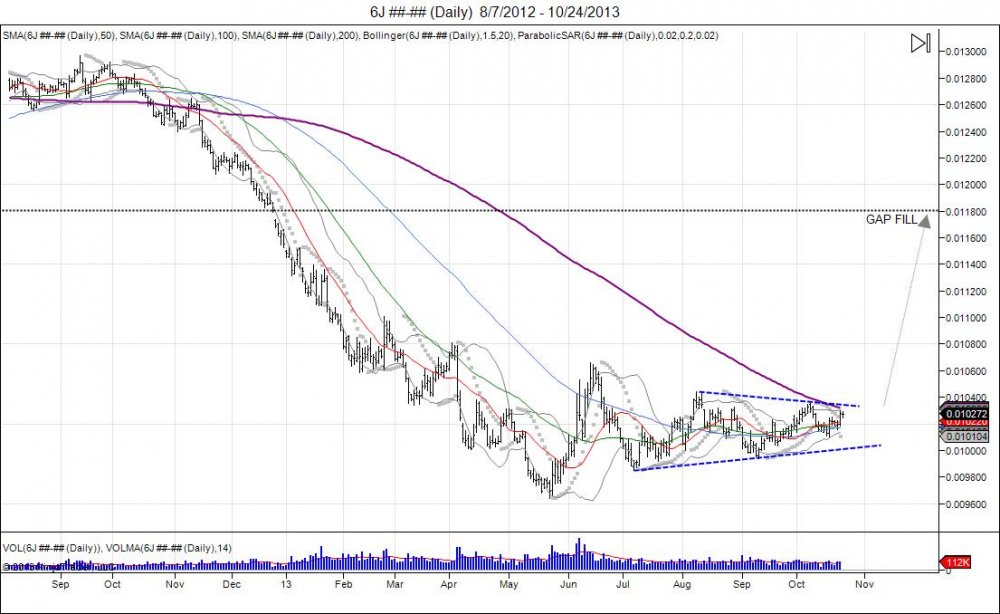
As the SP500 hit a top in May and pulled back, the Japanese Yen in contrast hit a low and squeezed 10 handles off the low. This was followed by a pullback to retest the lows, and ever since then, as equities have gone higher, the Yen has traded sideways and compressed as the 200day moving average on the daily chart has caught up. Since the Yen's original move was from 126 - 96, it is in a bear trend and this sideways action is consolidation of the trend and an attempt to reverse or see continuation of the trend. Currently, the Yen is retesting the October highs of 10357 that rejected the test of the August high. As this spring is compressed, a move above the October high gives way to reclaim 104 and force shorts to cover, giving way for a retest of the June highs at 10663. Reclaiming these highs gives confirmation of a reversal in this bear trend and sees room up to 118 to fill the gap created in November of 2012, just as the SP500 has it's gap of 1420 from December of 2012. Recall the Yen attempted to bottom out at 10340 in March, only to see the Bank of Japan come out with new stimulus that derailed the reversal attempt and slammed the market into new lows down to 9640 printed in May. The squeeze in June led to the BOJ announcement levels which was rejected. This is a major level as a recovery above this is a recovery in the Japanese Yen. Bottom line, for the week, need to see buyers sustain current bid to see new buyers step in next week and close above 104 to squeeze shorts. Failure to hold above 104 and break of 100 sees a retest of the May lows.