Chicagostock Trading

Chicagostock Trading

Stocks and Volatility Shorts on Tight Rope

05_22_jpg.jpg 

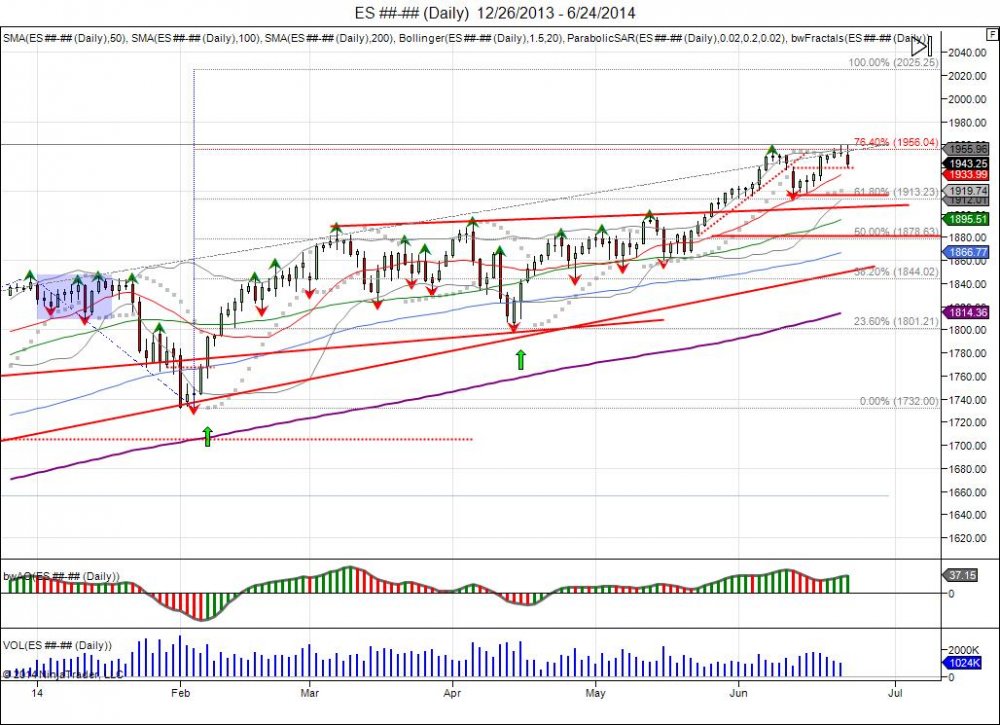
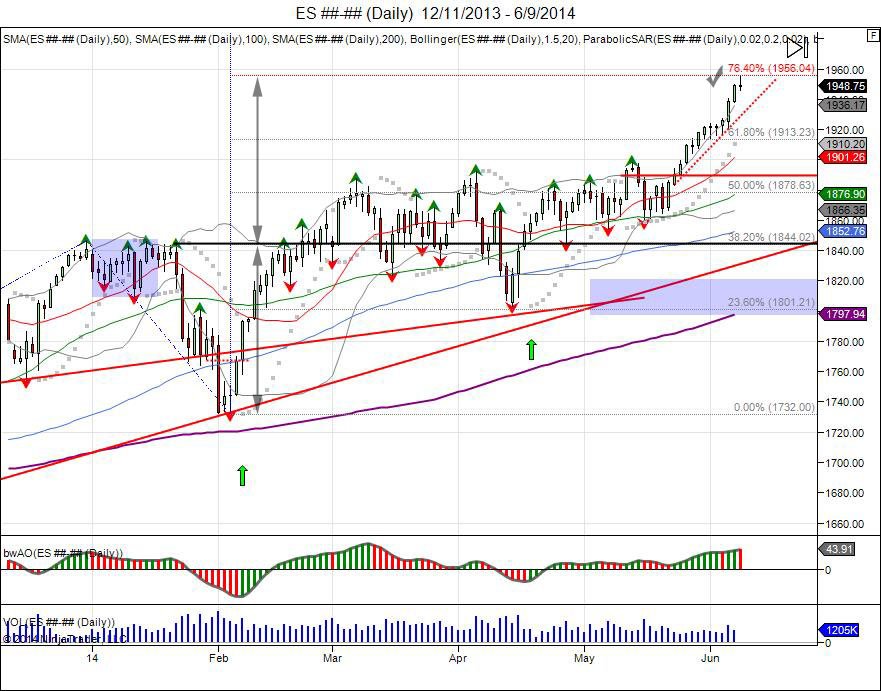
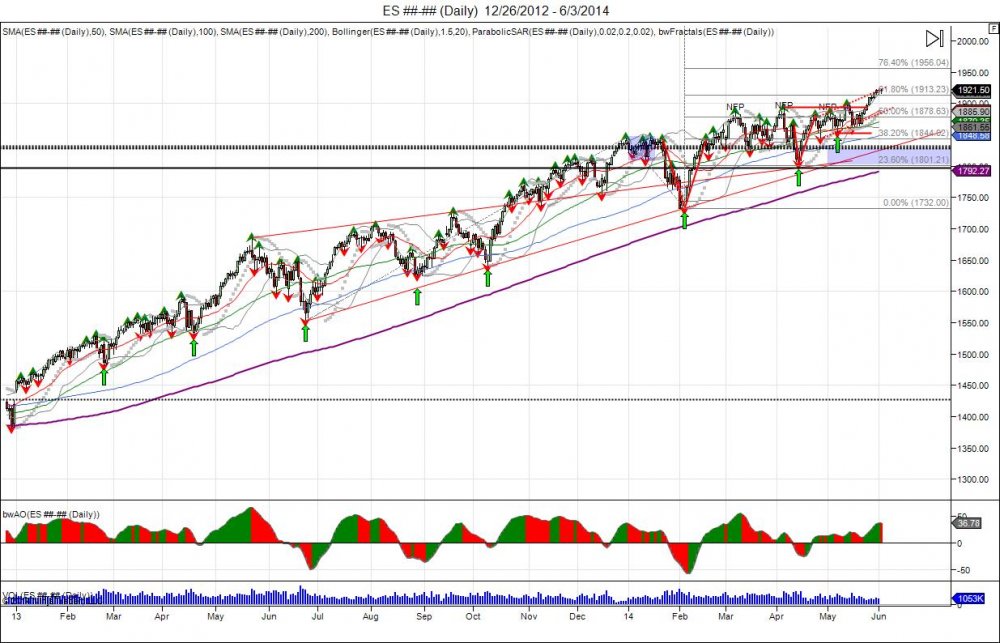
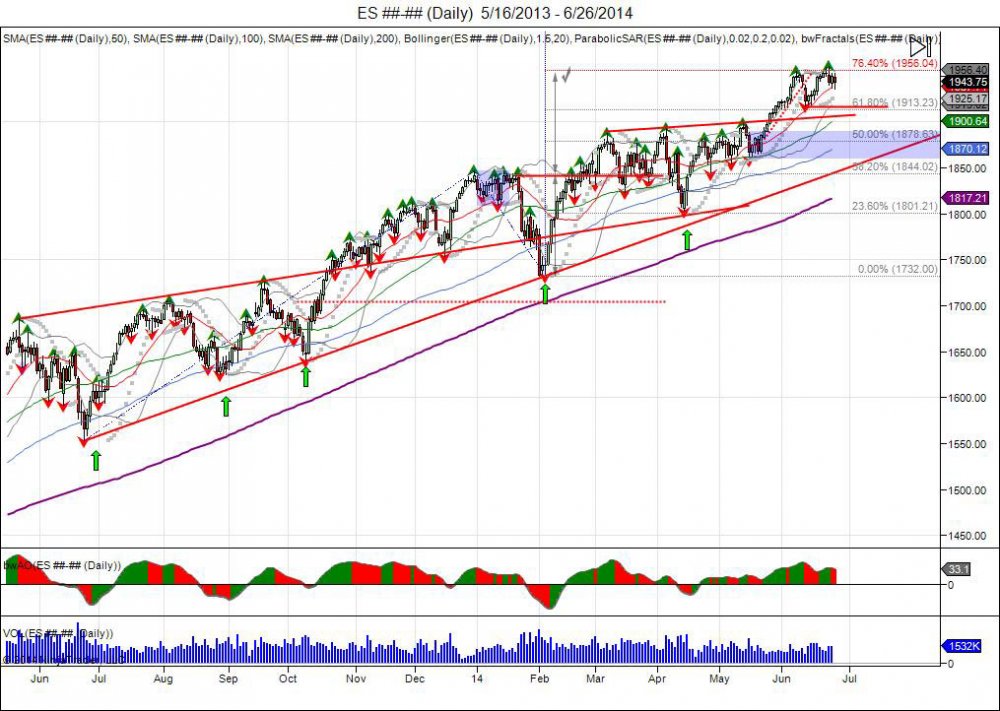
SP500 futures have been in limbo after completing the 1955 target based off the January-February range expansion (1844-1732 = 112, 1844+112=1956).  This level has also coinciding with a major fib extension at 76.4% based off the May 2013 low (1553) to the December 2013 high (1846) and the February 2014 low (1732).

We know this year started off sideways from last years close, which was followed by a massive liquidation from 1844 down to 1732.  This selloff was reversed, with the market recovering above 1844 to squeeze out shorts.  The reversal above 1844 created the plateau to allow new buyers to come in and support prices to attempt and expand the 112 point move down up into 1956.  After 3 months of sideways consolidation and bear traps, the market printed new highs in May at 189850 followed by a low of 1859 that barely held its May low of 185450.  By holding this low, the market managed to reverse and squeeze through 1898, giving way to breaking outside of the 3 month range and expanding up to complete the target as shorts once again were squeezed.  The ECB came out on the 5th of June to cut rates to negative, giving the boost in the SP to hit 1940.  The following day was the Jobs report on the 6th of June which continued the move into highs of 184975. Spilling over into Monday, highs of 195475 were made completing the range expansion and meeting the 76.4% fib, give or take a point.  The futures rollover from June into September saw prices rollover with, falling down into 1917 to test the June lows and hold, before reversing back up as the September contract became the front month and went toward to meet with its 76.4% fib as well. 

Highs of 195975 were made during last Sunday's Globex session that further squeezed shorts after September took out the continuous highs. Since this Globex high, the cash market opened lower only to rally back and retest this high, making a new one by a tick at 1960 before going offered down to 1936.  Over the past 2 trading days the SP has fought to hold above 1940 as it attempts to defend the reversal off the 1917 lows and develop a base to squeeze shorts through 1960.  Buyers at the 1940 level need a move through 1960 to be rewarded based on their risk of defending the 1917 low.  Doing so, gives way to the next major fib level of 100% at 2025.  Failure to hold 1940, gives way down to target the 1917 low made last week.  Failure to hold 1917 confirms the new highs as a failed breakout with buyers that will be forced to liquidate which gives way down to retracing into the May breakout at 1890 to allow buyers to defend.  This would be alot healthier to the market as it would allow buyers a opportunity to buy a dip and use a break of the May lows as their exit, as opposed to forcing buyers to chase above 1960 in which will continue the capitulation of shorts and parabolic squeeze. It is the struggle to accept 1950.


unemp1_7.jpg


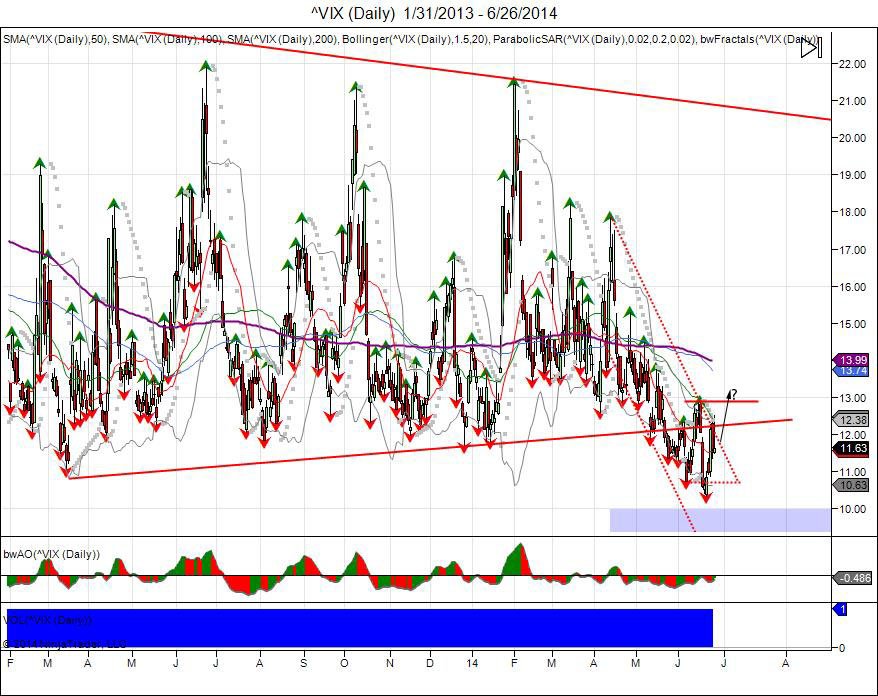
It is important to pay attention to VIX futures here.  After taking out multi year lows and falling below its trend line from the 2013 lows, VIX fell into 1073 early June, before bouncing up to 1289 in an attempt to come back.  This early attempt was rejected and VIX was sold down to make new lows (as the SP made new highs), falling down to 1034 before seeing a push back to highs of 1233 on the 25th of June.  It is interesting to note the take of the Volatility Sonar report from Optionmonster TV that highlights July call sellers in the VIX futures and an absent of what they call the "call stupid buyer" that has been buying premium in VIX not show up on that particular weakness from the 25th.  Jamie Tyrell explains how VIX can turn higher toward the end of the video.  Thursday saw VIX press against highs of 1251, nearing that 1289 June high, before backing away. Shorts in Vol should be concerned as a squeeze through the June highs forces shorts to cover as the June lows setup a failed breakdown, giving way for a move to retest the April range of 16-18.  

This was our projection of VIX just a little over a month ago: http://stks.co/p0M9e


Continue reading
3695 Hits

What Tuesday's Reversal Means

 05_22_jpg.jpg


On Tuesday, the SP500 put in whats called an "outside reversal bar". What this means is the market took out its prior high, however failed to hold and reversed to close below the lows.  This comes after seeing last week the contract rollover from June into September, see the market sell off down to 191750 after the June contract reached its 76.4% fib extension and 1955 target with its 1954.75 high.  The market recovered after the rollover lows of 191750 last week and ended the week with the market taking out the continuous 195475 high up to 195675. This allowed the September contract to meet its 76.4% fib. Monday saw a continuation of this squeeze overnight with the Sunday globex trading seeing a squeeze up to 195975 and Monday's cash open lower. Tuesday saw the market retest this globex high, take it out by a tick at 1960.00, and fail to hold, falling down to take out the cash open to reverse the market, falling into major support at 1941.  Going forward, this reversal not only caught longs off guard, but has also left some shorts on the sidelines with Tuesday's retest of Sunday night's short squeeze.  The close below 1950 has turned the level into new resistance with pressure against 1941 based off the 1917 low made last week. The reversal down to 1941 allows buyers a retest of major support to defend and prevent the 1917 lows from failing.  Bulls must now get through 1950 resistance and recover the failed 1960 high to regain momentum.  Failure to hold 1941 support gives way to target last week's 191750 low to squeeze longs and confirm the daily new high as a failed breakout. This would be a front run ahead of next week's NFP report with the downside chase to squeeze longs and lure in shorts below 1917.  Failure to hold 1917 gives way to break the June 191375 low and put in a reversal for the month, giving room down to retest major support within 1890-1880 based off the May breakout. 


Continue reading
2537 Hits

SP500 Completes 1955 Objective

05_22_jpg.jpg

The SP500's breakout in May has expanded its January correction from 1844-1732 of 112 points with highs of 195475 missing the marker by 1.25 (1844+112=1956).  This comes after the correction in January setup a bear trap which was followed by a V shaped bottom, squeezing out those shorts. For the months of March through April, the market made peak highs on job reports, however remained below 1900 and held above 1800.  This range tightened in May with the jobs number failing to take out the previous high, putting in a lower low at 1886 on May 2nd.  This lower low for the first in 3 jobs releases lured in shorts as it setup a failed retest and breakout of the April highs at 1892.50.  A correction was attempted following this lower high, only to hold at 1859, holding the May low of 1854.50 and preventing a reversal on the month to confirm the short side. This failure to take out the monthly low caught shorts trapped as the market gapped open on the 21st at 1874 from its prior day close of 1868 and pressed to take out the May 2nd jobs number high of 1886. With this jobs number taken out, the short side was forced to cover, using this as fuel to break through 1900 and take out the 3 month range which gave way to expand the 1844-1732 V bottom up to 1956, as well as meeting the 76.4% fib extension at 1956.  This level completes the short squeeze objective and the range expansion objective, however the pressure remains to the upside as the breakout is in a parabolic period.  The latest leg from 1924 up to 1941 was sparked on high volume with the news of ECB going to negative interest rates. The jobs report gave the last spark into 1950 on Friday and this created a spillover effect, seeing Monday continue the rally into 195475, meeting its objective, before going into profit taking.

Going forward, a daily close below 1945 gives way to back and fill last week's ECB squeeze with lows of 1921 to retest the breakout point and major support down in the 1920s with sell stops below 1913. Failure to hold 1913 gives way to shake out the long side and retrace back to the range highs down to 1900-1890 from the original breakout point in May.  This provides buyers an area to buy on a pullback as opposed to chasing the market on the highs.  The pivot for the rally comes at the May lows as a breach below the May low reverses the upside momentum. Above 195650 sees the 100% fib extension up to 2025.


Tags:
Continue reading
3512 Hits

SP500 DAILY VIDEO ANALYSIS


Futures, foreign currency and options trading contains substantial risk and is not for every investor. An investor could potentially lose all or more than the initial investment. Risk capital is money that can be lost without jeopardizing ones financial security or lifestyle. Only risk capital should be used for trading and only those with sufficient risk capital should consider trading. Past performance is not necessarily indicative of future results. Video content hosted by third party.


05_22_jpg.jpg


Tags:
Continue reading
2265 Hits

Why Stocks are Lagging

05_22_jpg.jpg


As the NFP rate creeped toward the Fed's 6.5% target, the bond market acted ahead and as it closed 2013 on the lows, it started 2014 on the lows, only to fail in moving lower and squeeze higher during the month of January. This upside reversal caught shorts by surprise as it squeezed the market from 12723 to 13503 to stop against major resistance from October of 2013.  The reversal into this resistance squeezed out the short side, however for the next 3 months the bond market stabilized sideways to consolidate the reversal and in turn develop a base or in technical terms an inverted head/shoulder pattern from February to April. With April's low retesting March lows and holding, this saw a push back to breach the 3 month highs and confirm the inverted h/s pattern. The coiled pattern once again left shorts selling the market trapped and with the breakout above the 3 month high, this gave fuel to expand this inverted h/s target and squeeze out October 2013 highs. This was done in May, confirming the lows of 2014 as a failed breakdown and a reversal in trend. So far since the October highs being taken out, this has led the bond market to further squeeze another 4 handles as late buyers now come in after the confirmation and chase the market up.  Going forward, major resistance is being tested from June of 2013 in the bond market with new buyers chasing prices above last October's highs. A move through 14028 squeezes this resistance level and retraces the bond market 50% from its 2012 high to its 2014 low. A break below 13606 reverses short term upside momentum to shake out longs chasing the market and give way to test downside support at old resistance 134, followed by 129 as major support off the year lows.


05_22_jpg.jpg


The Yen also started the year on the lows and reversed higher during the first month of 2014. This caught the market off guard again, squeezing out the short side with the move from 9486-9926.  Since this January upside squeeze, the Yen, as the bond market, went into a sideways consolidation period as it turned lower, however held above the January lows to keep shorts trapped. The consolidation and coiling led to an inverted head/shoulder pattern just as the bond market, with a squeeze in May to break above the neckline of 9870 and reach its 200day moving average for the first time since November of 2013. In contrast to the bond market, the Yen has had much more difficulty in expanding this range and seeing new buyers chase the market at these levels. For now investors are favoring the hedge of stocks into the bond market. Eventually this should rotate from bonds into yen and gold. Short term, the Yen remains in an uptrend with a target of 10150 to expand its 3 month range. Failure to hold the May low gives way to retest the April lows.

Continue reading
2669 Hits