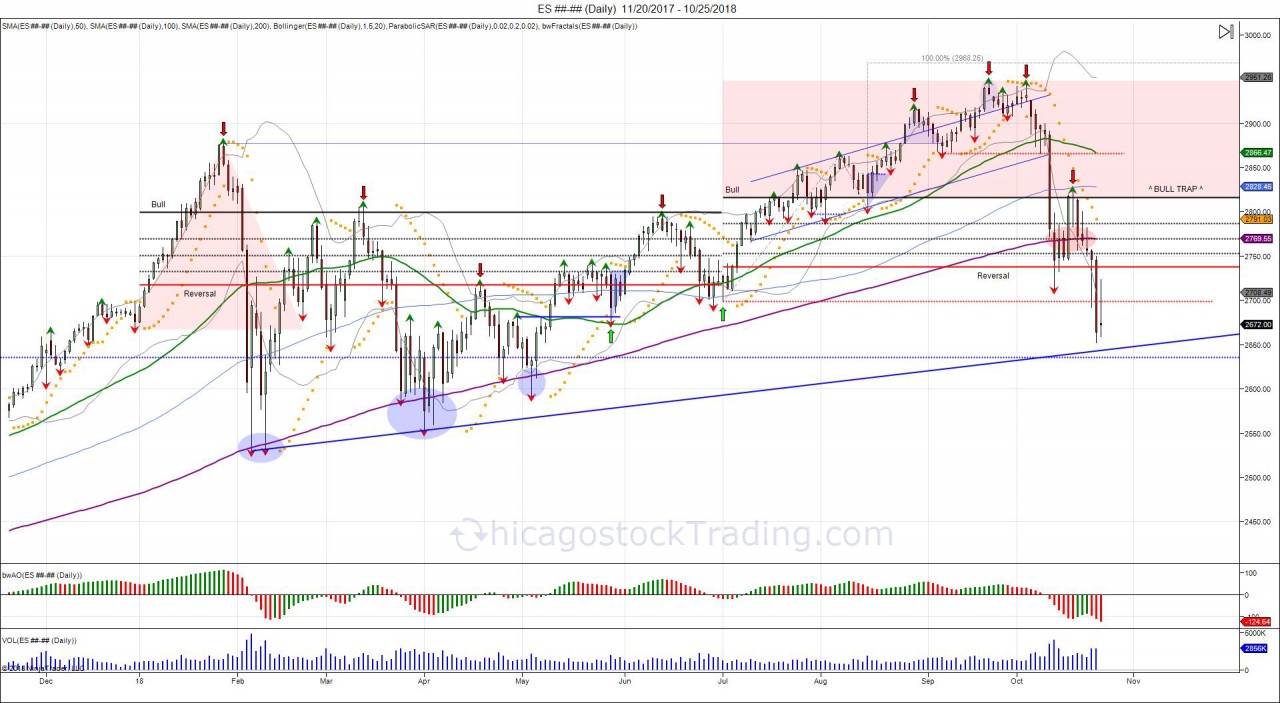
The year of 2018 has been a year that has lured in buyers, only to trap these buyers as sellers took profits into the rallies. In the beginning of the year, we saw the market stampede from 2700, through 2800 into a high of 2878. The move over 2800 (the 6 month volatility window), lured in buyers as it established a bullish 6 month bias, that were forced to defend pullbacks. These buyers turned into "bag holders" a term used for late buyers, as the market fell below 2800 to trap the longs. Liquidation below the year low came fast. Reversing the 6 month bull bias, and turning 2800 into resistance as buyers were trapped above, creating overhead supply. For the rest of the 1st half of 2018, the market was walked higher, from 2529 up to retesting 2800 before going into the 2nd half of 2018. In the 2nd half, July, new volatility windows were set. Once again, the market broke through its upper vol window (2816), establishing a bullish 6 month bias and once again luring buyers. This time around, buyers were able to convert 2800 into support, allowing a move to overcome the January 2878 high. The breakout over this high lured in new buyers and stopped out shorts, pushing the market up to a high of 2947. After failing to overcome this high in October, falling short at 2944.75, the bottom fell out, seeing the prior month low of 2865 (September) taken out. Thus has once again led to a waterfall effect that forced buyers to defend the 6 month reversal window of 2737, based off the July low of 2698. First test of this level saw buyers with their backs against the wall, forced to defend the level to prevent another reversal bias. Bulls managed to squeeze the market back to retesting the 6 month vol window at 2816, however failed to overcome the level. This once again has left buyers above the 6 month volatility window on the hook, showing more supply is trapped above, then demand. The return to the reversal window at 2737 has saw buyers fail to hold, after using most of their ammo on the first test. Buyers are out of ammunition. How many more times can they double down? This has led to the July low of 2698 to be taken out and as of now, the market has closed below its 6 month reversal window of 2737 for 2 days. 5 daily closes below reverses the 6 month bull bias, giving way to expand the market lower once again. The correction in the market began in February. However the market spent the next 7 months grinding out shorts and luring in new buyers. With shorts being stopped out as new all time highs were made, new buyers are again on the hook with the failed hold of the September low at 2865.
Buy the rumor, sell the news?
Consumer Confidence is highest since Sept. 2000
— zerohedge (@zerohedge) September 25, 2018

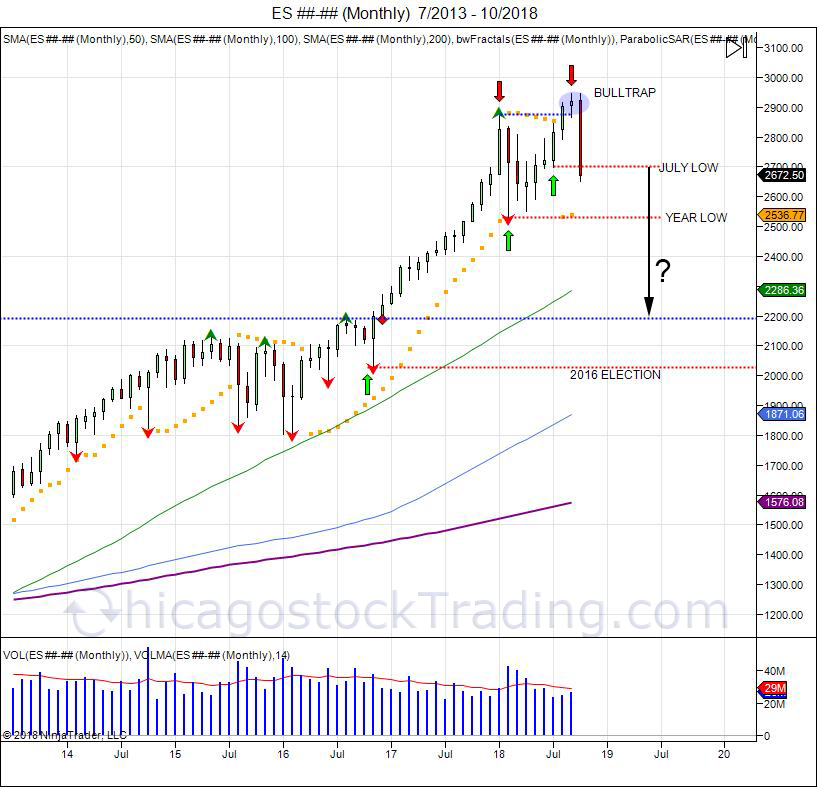
As seen in the monthly chart above, the "Trump rally" started in November of 2016. Seeing the market breakout from 2170 into a high of 2878 in January of 2018. For those that follow our work, we pointed out how the Trump V bottom on election day projected 2300. Obviously the market went much higher, however the buyers that came in to start January of 2018 were the late buyers that panicked in. They were corrected down to a low of 2529 in February. From this low, the market spent 7 months grinding out shorts as the market was walked up to take out the January high, luring in new buyers, only to fail in holding above and turning right back down to take out the July low. This has created a "failed breakout" as new longs above 2800 are now on the hook. Rallies up to the September low of 2865 provides new resistance for sellers to defend and buyers to overcome to recover the trap above. Next major stops in the market are seen below the year low of 2529. Below this low, opens the door to retrace the "Trump rally" from 2200 back down to that level. Big move? Yes. Impossible? No. No guarantee this will take place, however doing so would retest where the market broke out and provide buyers an opportunity to defend the breakout. In the long run, this would be considered a "healthy" correction. Unless you think the market going up every month is healthy.
If you want to see how the October 2018 correction started, check out this link: https://t.co/z3RZmSa8mq
2018 January Correction: http://www.chicagostocktrading.com/blog/sp500-january-2018-mirrors-january-2016-1.html
2016 Election V Bottom: https://twitter.com/Chicagostock/status/801150246906687489
2016 February V Bottom: https://twitter.com/Chicagostock/status/701882994844311553
