%20%202_29_2012_1.jpg)
click image to maximize
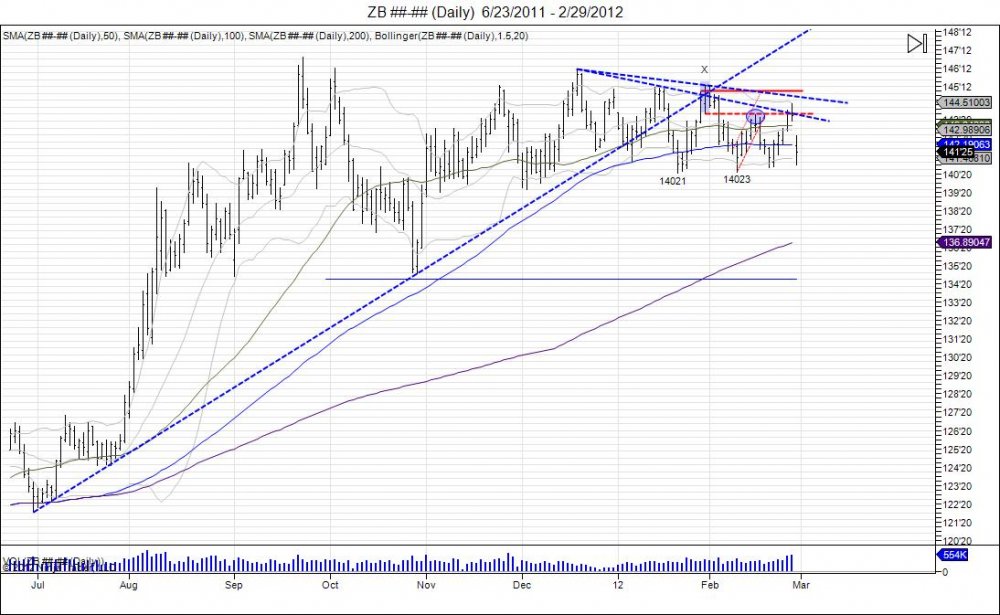
Notice a pattern above?
Over the past 2 months we have seen the 30 year bond attempt to breakout only to fail. Thus far, we have seen 3 setups that attempted this. The first one was during January 13-18, followed by January 30-February 2nd, and most recently February 27-29. All these attempts have couple things in common, one they were all led by short squeezes as the market tried breaking down but was not ready to, and two- as they tested the highs and tried to break out, they failed and created a 3 point consolidation that was followed by a selling. Most recently, once again the 30 year tried to breakout as short covering led the market into testing its 14400 level, only to once again fail and create a head/shoulders pattern with highs of 14403/14411/14404. This thus far has once again repeated the pattern and broken down as the June contract has taken over for the front month. Lower highs, and higher lows are now being created and this market is getting tighter.
read more...
click image to maximize
Late January, when we wrote about the bonds as "X Marks the Spot", the 30 year was once again trying to breakout as it tested the highs and clipped January's high by 2 ticks at 14515. This breakout failed leading hte market to retest the year lows at 140'21, putting in lows of 140'23. This 'double bottom' attempt was followed by a short squeeze that led the market back to retest where it broke down from at 14328-14515 on February 15 with highs of 14327. This test of this resistace failed and the market once again traded lower to try and break the 'double bottom'. Lows of 140'31 were made on February 21st as the bonds failed to break this double bottom leaving shorts in the market as it once again went into short squeeze going into the March-June contract roll over. The squeeze rallied back into the resistance range of 14328-14515 with highs of 144'14 as the March contract took out its 14327 high in attempt to squeeze out shorts. This high turned to be the last 'hoorah' for the short squeeze to shake out weak shorts as the June contract became the front month on February 29th, opening at 142'05, showing a gap on the continuous contract. This roll over and gap is catching people off guard as the market is once again on the verge of testing its lows for the year at 14021 and attempting to break through. This is a strong bull market and is fighting very hard to hold as cracks are appearing and the market is trying to roll over. Market at this point is once again targeting the 14021 lows where a break below targets the December 13924 low which eventually gives room into 135-133. First level of upsid resistance is met within 14200-14300, followed by 14316-14414. A break through this is needed to target the 14516 highs and reverse this downward slip.
If you have been doing this right, even though this has been a strong bull market, the short has given oppurtunity to profit. However, one must always scale out to lock in profits and as fighting a trend it can turn and lose all those profits.
Below is exact trades on the first two breakdowns locking in about 4 handles on both. Even though the market did not complete its 3rd and 4th targets both times, scaling out allowed to lock in profits as runners were kicked out with the bond market being stubborn on breaking lower.
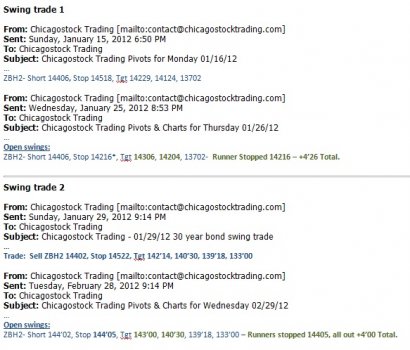
When all is said and done, it all comes down how you trade the market. You can still make money fighitng the tape, however know your risk, understand your risk, and be comfortable with your risk. Most importantly follow the levels the market offers.
These trades can be found in our archives where members have access to. A new bond trade is now working, subscribe to the daily futures newsletter to be updated on upcoming trades and daily levels.

