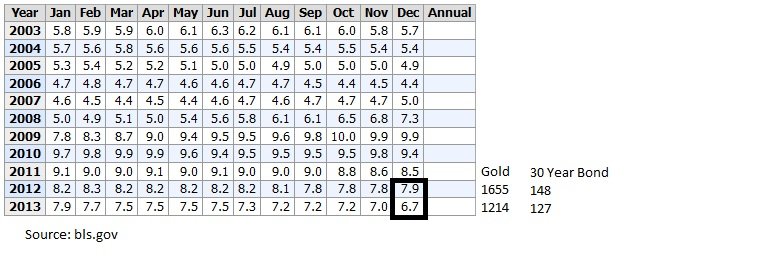
Just a little over a year ago, in December of 2012, the Fed for the first time during its low interest rate policy, attatched a 6.5% unemployment rate to its fed funds rate. As highlighted in December of 2012, this spooked the gold market, which at that time was trading 1655 with a range of 1526-1798 in 2013. Bonds on the other hand closed the month of December at 148. Since this new FOMC policy, both gold and the 30 year bond market front ran the unemployment rate target, seeing gold break its 2012 range of 1526-1798 to expand lower, making lows of 1179 in 2013, and lows of 12723 in the 30 year in January. On January 10th, 2014, the BLS reported an unemployment rate of 6.7%, down 1.2% from Dec of 2012, and only .2% from the Fed's 6.5% threshold. So with gold and bonds moving ahead of this target, and now the target coming into play, it only makes sense to see gold and bonds recover and turn the other way.
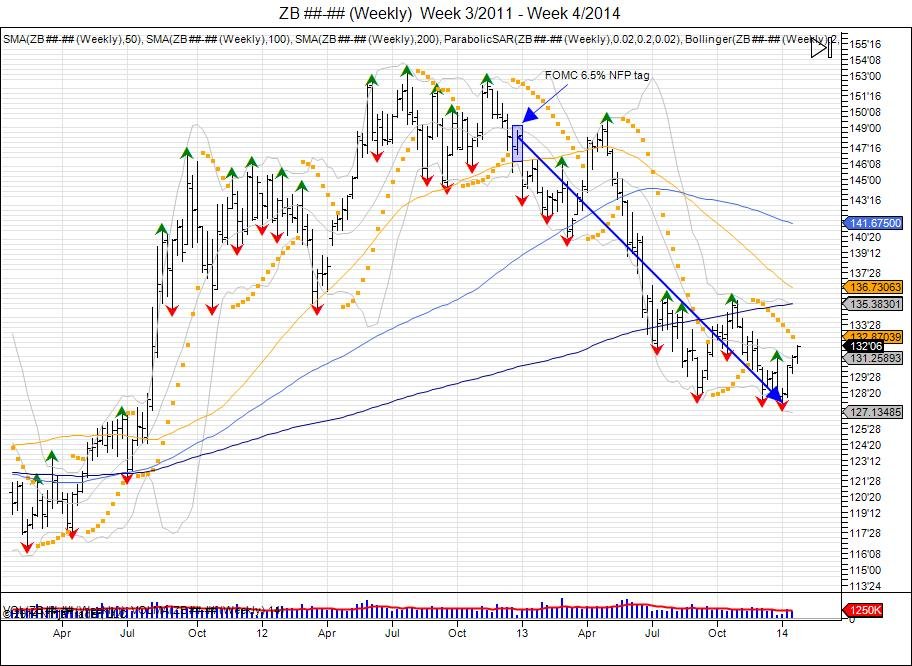
30 Year bonds put in a failed breakdown early January as the lows from 2013 of 12801 were taken out down to 12723, and failed to hold. This has thus far led to a reversal and short squeeze, seeing the market recover above 13100. Overall trend remains down as seen in longer term weekly chart with major resistance for this trend coming within 13320-13524. Breach of this range will change trend and momentum in the 30 year, confirming the weekly double botom and giving room to retest the March 2013 lows at 14014.
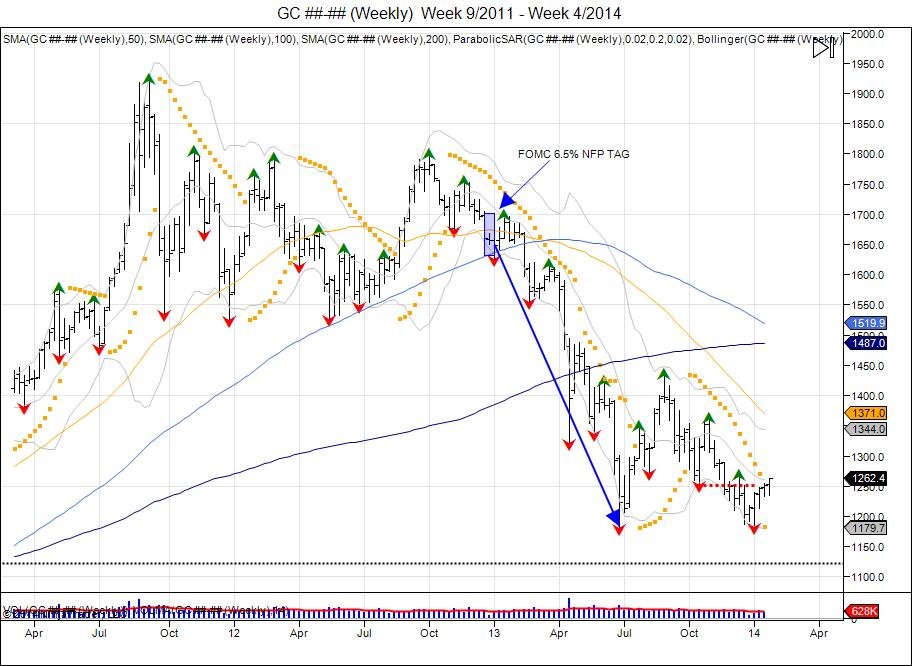
Gold's 2012 range of 1526-1798 (272), was expanded (272) lower into 1254. This did not stop as panic selling came in and gold saw a flush down to 1179 before quickly recovering up to 1434. For the next few week's, gold's downside pressure from its new found downtrend below 1526, forced the market to retest the 1179 lows. Tax selling also put pressure into the end of year 2013 as investors sold gold to lock in losses and balance some of their stock gains. In January, just as the bond market made a new low, gold also made a new low down to 1181.4, however managed to hold the 2013 low of 1179.4 by $2. This has thus far led to a small bounce, retesting resistance from the prior high of 1267.5 made in December. Today gold ran into these highs but has fallen short in taking them out by .5. A move through the December 1267.5 high confirms a short term double bottom and gives room to retest next major resistance up to 1380s based off the 1434 high in mid 2013 before falling back below 1200. This 1380-1434 level will be huge for the change in momentum and trend. As a break above this confirms a double bottom and gives way to retrace back up to and retest the 1526 level from where the market failed.
Just as in December of 2012 with gold at 1655 and 90% of community being bullish after 90% was bearish sub 1000, this did prove correct and we did see a correction down to 1179. So at 1179, down $744 off the highs and unemp rate reaching 6.5%, is this the time to be short gold? Opposite as majority of community is back to being bearish metals, this is the time to start looking back into gold, and picking up physicals. A flush below 1179 can still be seen, but should provide opportunity for longs as a reversal after the flush would be expected.
RISK DISCLOSURE: PAST PERFORMANCE IS NOT INDICATIVE OF FUTURE RESULTS. THE RISK OF LOSS IN TRADING FUTURES AND OPTIONS IS SUBSTANTIAL AND SUCH INVESTING IS NOT SUITABLE FOR ALL INVESTORS. AN INVESTOR COULD LOSE MORE THAN THE INITIAL INVESTMENT.

