February 6, 2012, Prince Alwalweed of Saudi Arabia with Maria Bartiromo of CNBC - "Saudi Arabia went public by saying we will not let the price of oil go more then $100. Which means we can use our leverage, our excess capacity to be sure to pump more if needed, to be sure to have it not go over $100, so we will not impact and affect the consumer countries while they're getting out of the economy of the recession slowly but surely, hopefully."
Source: CNBC
more...
The Technical outlook:
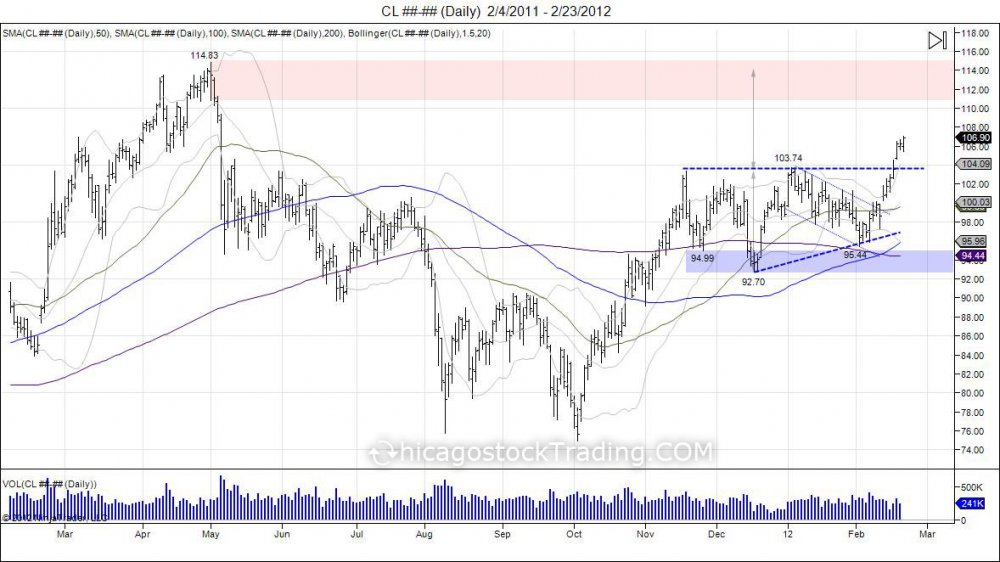
On October 4th 2011, just as the SP500 futures put in lows of 1068 and reversed, crude oil made lows of 74.95, taking out it's August 75.71 low. This new low was followed by a short squeeze that rallied the market up to highs of 103.37 on November 17, 2011. For the next 3 months, crude oil began to consolidate it's move from 74.95-103.37. This consolidation gave a range of 92.70-103.74, with the 92.70 lows put in mid December and the 103.74 high put in early January 2012. As the equity markets started 2012 on a strong note, this gave crude oil the push to put in this high of 103.74, however the market was not quite ready to continue as the lows from 92.70 were never retested. This led to a grind lower during the month of January as the market retraced to retest its December lows of 9500-9270. On February 2nd crude oil came in very close to this range putting in lows of 95.44 before finding support and turning higher. By testing this December low the market gave oppurtunity to show its weakness and break the lows or show its support and hold them. Sure enough the test was supported and the market turned to create a "right shoulder" of an inverted head/shoulders pattern with the December low being the head. Since this test, the market has found itself ready to continue the rally and push through its neckline of 103.74, putting in new year highs of 105.80. As the market is now breaking out, we can take the range of 103.37-92.70 being 10.67 and add it to 103.37 to get a potential target of 114.04. This target would be retesting the May 2nd, 2011 high of 114.83, following in the footsteps of the SP500 as it also tests it's May 2nd high of 1373.50. There are times when markets break through their head/shoulder necklines only to fail and turn back. The way to trade these patterns is to step in front of the market and support it when its coming in to test its "head" so by the time the market has moved to it's neckline, profits are taken and runners are let go to see if the breakout is indeed good and it can continue its breakout target. If this breakout in crude is indeed strong, pullbacks into old resistance of 10374 should now act as support for buyers to defend as this is the top of the range that was broken and bulls should not allow a move below for shorts to get out until fully squeezed.
For daily levels on crude sign up for pro membership.

