click chart to maximize
more...
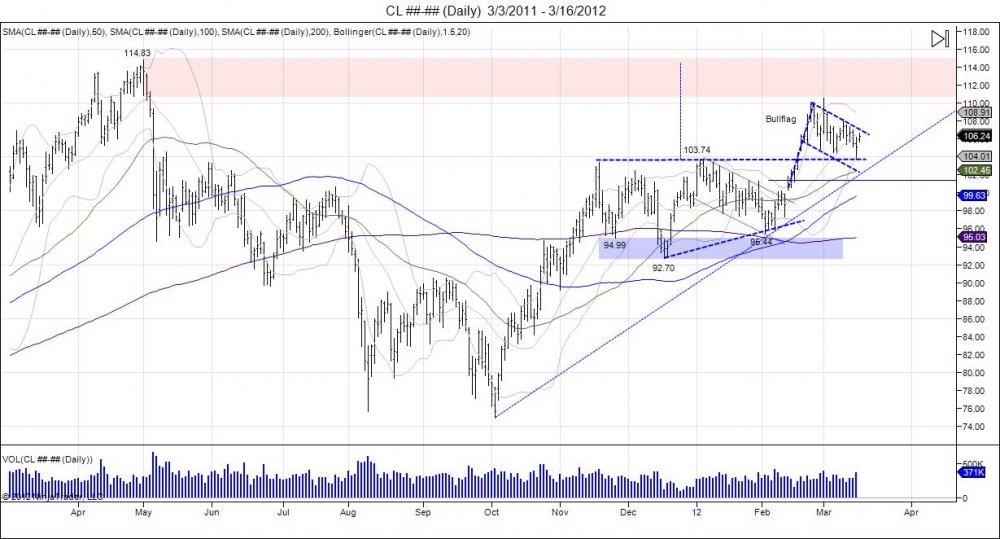
Since oil's breakout this year above the 10374 necklin, the market squeezed into testing major resistance of 110 off May 2011's highs at 11483. Not being ready to take out this level, we have seen this resistance defended and the market "flag" lower. The flag is the consolidation and tug/war as the market backs off this resistance and gives a chance to retest where it broke out from to see if this bull is indeed strong. The pole for this flag is the move from 100-110. The old highs of 10374 also the neckline of the inverted h/s pattern from Nov-Dec, is support for the market as the bull wants to hold above this as it is retested. Yesterday with rumors of the SPR being tapped the market fell right into this level with lows of 10378 before bouncing back. We are going through a contract roll over now from April into May and this is the time for bulls to shine and break out of this flagging formation to continue the momentum and target the May 11 highs to squeeze the level and complete the inv h/s pattern, following in the footsteps of the SP500 taking out its 2011 highs. Next major support is seen at 10130. Failure to hold the flagpole lows of 10028 will squeeze out longs and attempt a retest of that 9544 right shoulder.

