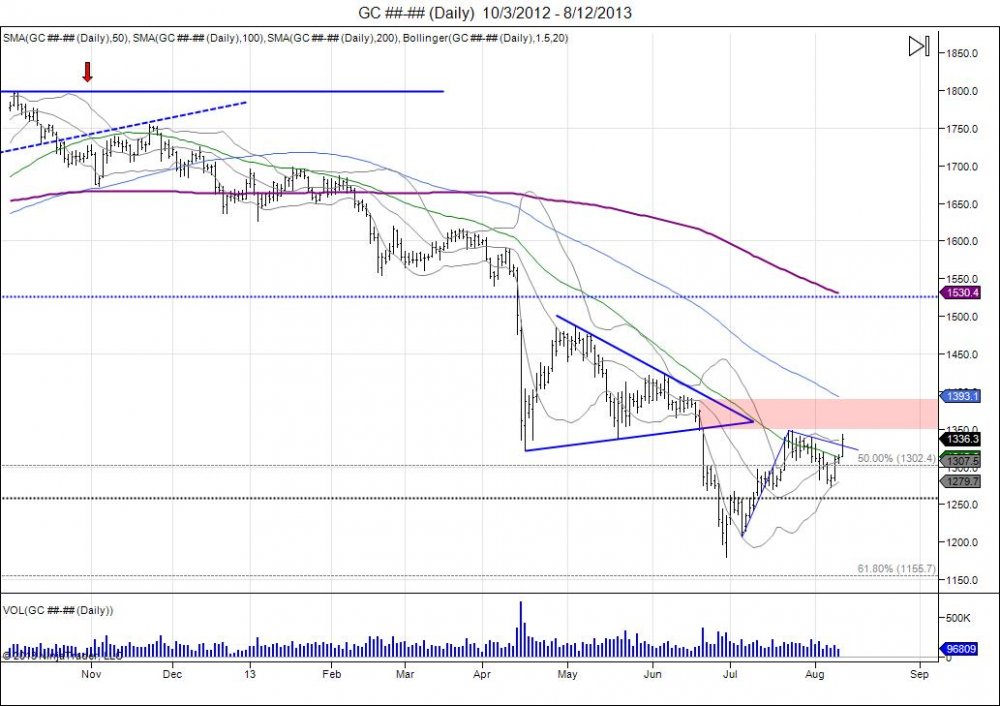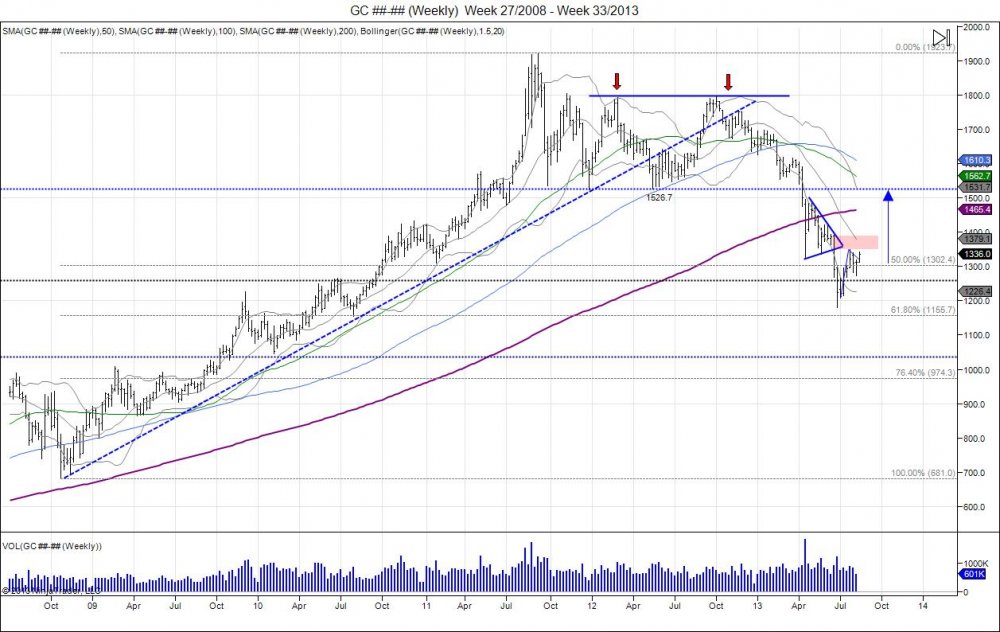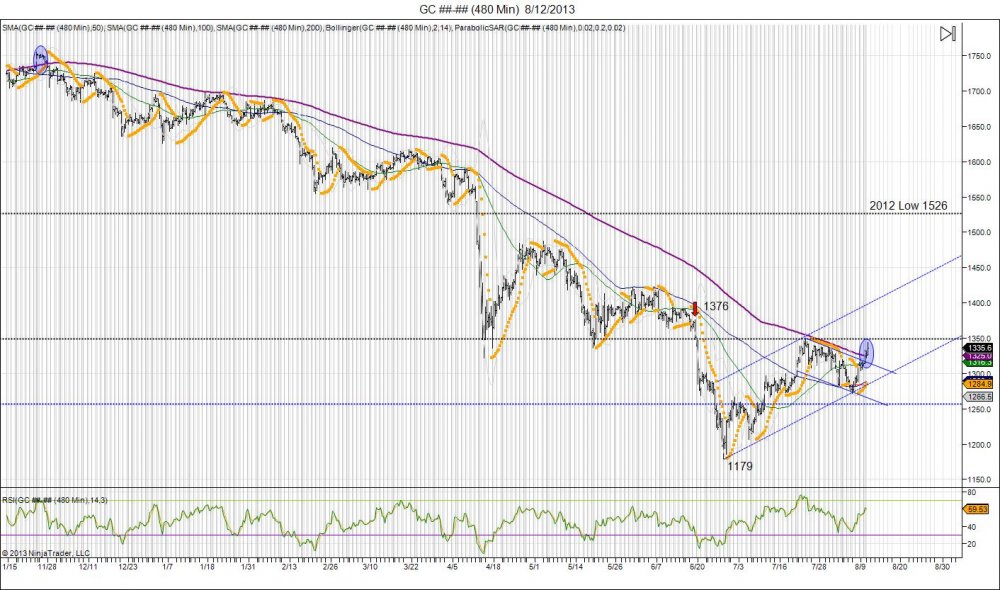
Gold broke out of it's downward channel it has been in since meeting its 1348 resistance level late last month and squeezed through it's 200day moving average for the first time since November 2012 on the 8 hour chart above. After completing 1255 downside objective from 1526 and even falling further to 1179, this setup oversold conditions which gave way for the short squeeze that saw the market recover back from 1179 into 1348. This 1348 level is a major level of resistance based off the pivot high of 1376 that led into the flush to 1179. After hitting 1348 last month the market consolidated and traded lower to shake out longs, putting in lows of 1271.8, to hold 1269.3. This setup a small double bottom which gave way for a reversal last Friday back above 1300. The reversal late last week above 1300 put pressure against the 1320 pivot high prior to 1271. Overnight the market took out 1320 to squeeze shorts which gave way to highs of 1343.7. This is now retesting the 1348 level and putting pressure to squeeze through this to take shorts out and confirm the hold above 1300 to open the gates to the next major level at 1376 being the high that led into 1179. By taking out 1376 the market recovers its fall from 1376-1179, confirming the "flush". At this point should gold do this U turn, we look for the market to consolidate and build a base to develop support for continued retracement back to retesting the 2012 lows up to 1526.