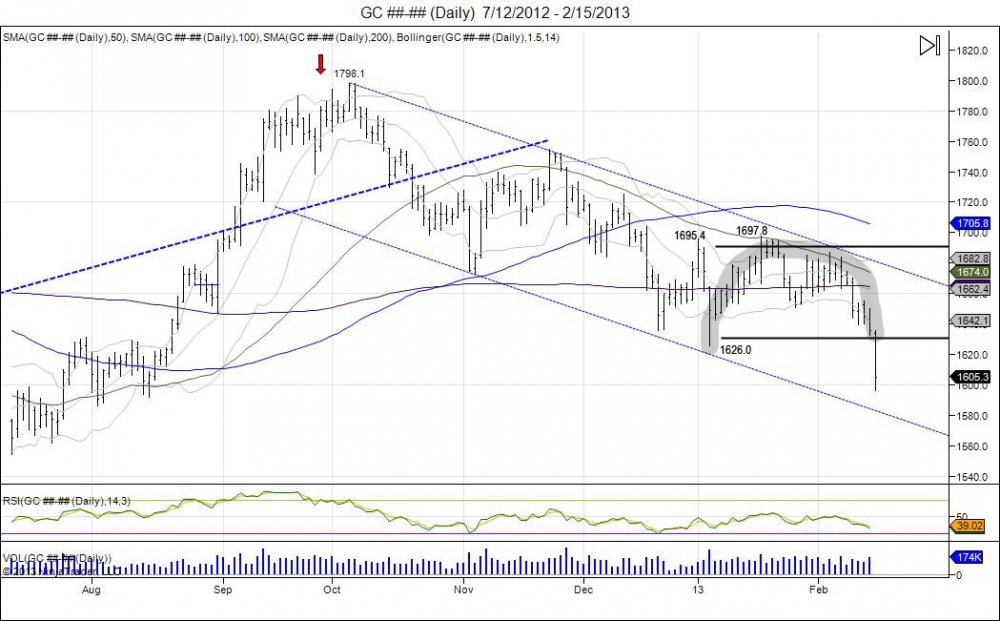
Gold broke its year low of 1626 today after it bounced off the level early January only to take out the early year high of 1695.4 by a few points at 1697.8. The market failed holding above the year highs in mid January and fell lower to retest the lows later in the month and beginning of February. After 2 weeks of consolidation above 1650 exhuasting daytraders selling, the market finally broke below 1651 on the 11th of February. This killed the attempt to build an inverted head/shoulder bottom and regained the bearish momentum as the market held below 1650 to keep buyers above trapped. Trapping these buyers led to the move today in breaking the year lows to run stops and fall down to 1596.7, 101.1 off the year highs. This has the market now testing major support off last year's lows of 1526.7. As seen on the daily chart, the market has created a upside down U turn. Meaning gold started at 1626, moved to 1697 and now back below 1626. Going forward, a 5 day hold below 1630 establishes a bearish bias for the first half of the year and gives room to continue the move lower.
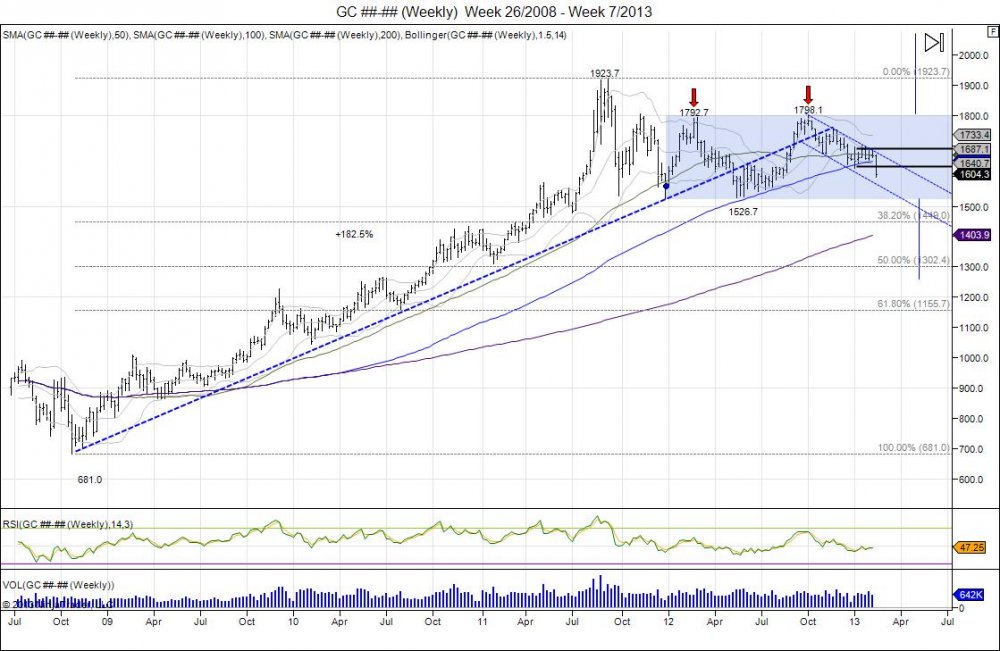
As seen in the longer term weekly chart above, gold has been in a downtrend channel since putting in a double top in 2012. The year of 2012 was a year of consolidation following the move of 681-1923.7 in the prior years from 2008-2011 when the Fed began its 0% fed funds rate policy. This consolidation created a range of 1526.7-1798.1 or 271.4. December was when the Fed tied gave a target of 6.5% on unemployment before raising rates. Since this the market has been spooked and trading lower. The double top of 2012 is confirmed on a break of the 1526.7 lows which gives room to expand the 271.4 range to the downside which gives a target of 1255.3 and retrace the market 50% from its 681-1923.7 rally. This would be a healthy move in the long term as it would shake out late buyers as well as give longer term investors oppurtunity to buy the retracement. A squeeze of the short term bear is seen above 1700, followed by 1800 to attempt to expand the range higher. Going forward, 1597-1526.7 is support range for sellers to chip through and break last years lows. New upside resistance is now met first at 1626, followed by 1659 with stops above 1697.8.
Bearish gold until a breach of 1700.Inv h/s attempt on daily since Dec20.
— Chicagostock Trading (@Chicagostock) February 1, 2013
To follow precise trade recommendations with stop and target levels: Subscribe today.
RISK DISCLOSURE: PAST PERFORMANCE IS NOT INDICATIVE OF FUTURE RESULTS. THE RISK OF LOSS IN TRADING FUTURES AND OPTIONS IS SUBSTANTIAL AND SUCH INVESTING IS NOT SUITABLE FOR ALL INVESTORS. AN INVESTOR COULD LOSE MORE THAN THE INITIAL INVESTMENT.


