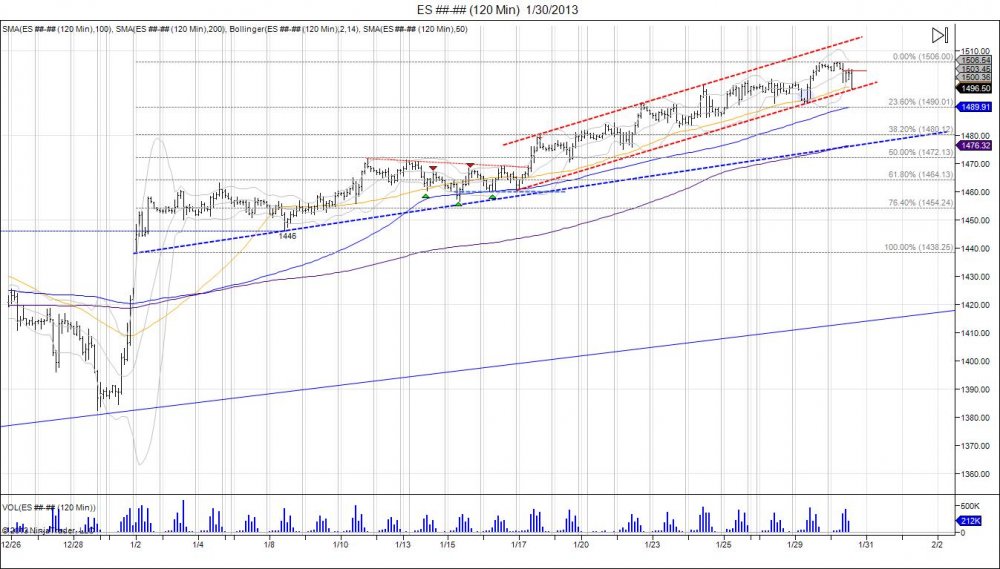
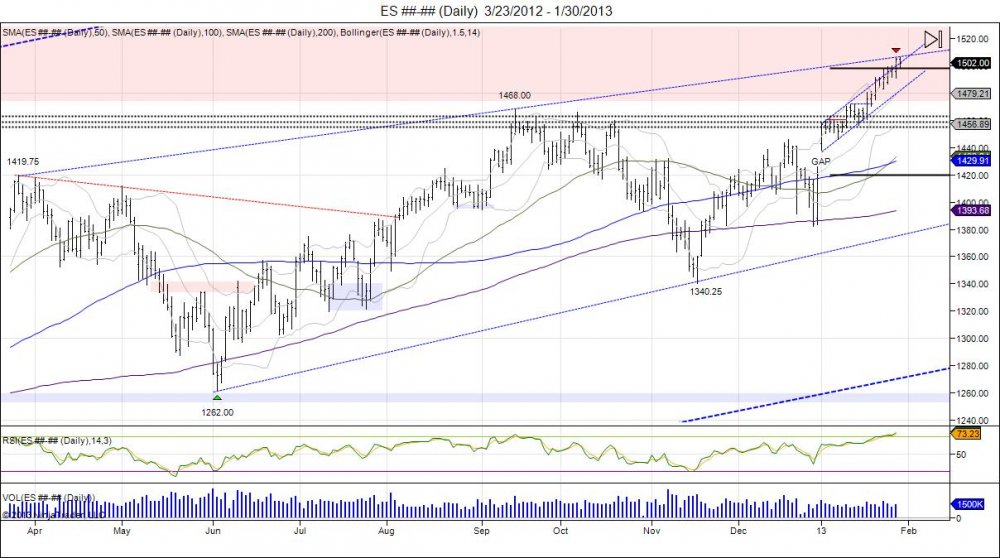
The SP500 hit highs of 1506.00, a 4.7% gain from the year lows of 1438.25. The squeeze following the gap open for the year has been relentless, seeing the market grind higher to take out its 2012 highs. Yesterday (01/29/13) the Emini SP500 closed above 1500 for the first time since December 26, 2007. The close had the feel of short sellers throwing in the towel ahead of today's GDP and FOMC economic data. Overnight, during the globex session the market managed to squeeze out a new high by a tick up to 1506.00. GDP dropped to .1%, much lower then expectations and worst since the second quarter of 2009. The fed continued with is same policy of purchasing securities at $85 billion a month.
On the technical side, the market is merely backing away from a trendline created by the 2012 highs of 1419.75-1468.00 connected. This is providing the market resistance and pressure to see profit taking as the market falls back to retest the 1495 level from Tuesday's open. Looking at the hourly chart, the SP500's rising channel from the breakout on the 17th is seeing the bottom of this channel being tested today. After a failed breakdown yesterday with a lower low by a tick at 1491.00 only to lure in sellers for a squeeze to new highs of 1505.75, a higher high was made by a tick and the market is seen falling back down to 1495. A breach of this channel sees the market targeting those lows of 1491.00, nearing a 23.6% retracement of the 1438.25-1506.00 move. For the sell side to be wrong the market must squeeze the Dec 2007 high of 1527 to gain momentum into the 2007 highs. The gap open this year caught many off guard forcing to buy the market and chase up. Just as the August breakout in 2012 caught buyers off guard during summer "vacation" by breaking above 1380 and moving into 1468, they had missed this move. They began betting on pullbacks as oppurunities to defend the market, only to see every every dip only continue to move lower as the market fell all the way down to 1340 in November. We're seeing the same thing as people on the sidelines are looking to support dips in this market. The question is - does the market do the same thing to give these dip buyers an entry but no uptick only pain until they squeeze out. 1455-1463 is a major area of support (pivot), followed by the gap fill at 1423. If we look at the Nasdaq, it has been stuck trading sideways following the retracement into the September range which is major resistance considering this is where the market reversed and fell down to 2492.00
RISK DISCLOSURE: PAST PERFORMANCE IS NOT INDICATIVE OF FUTURE RESULTS. THE RISK OF LOSS IN TRADING FUTURES AND OPTIONS IS SUBSTANTIAL AND SUCH INVESTING IS NOT SUITABLE FOR ALL INVESTORS. AN INVESTOR COULD LOSE MORE THAN THE INITIAL INVESTMENT.

