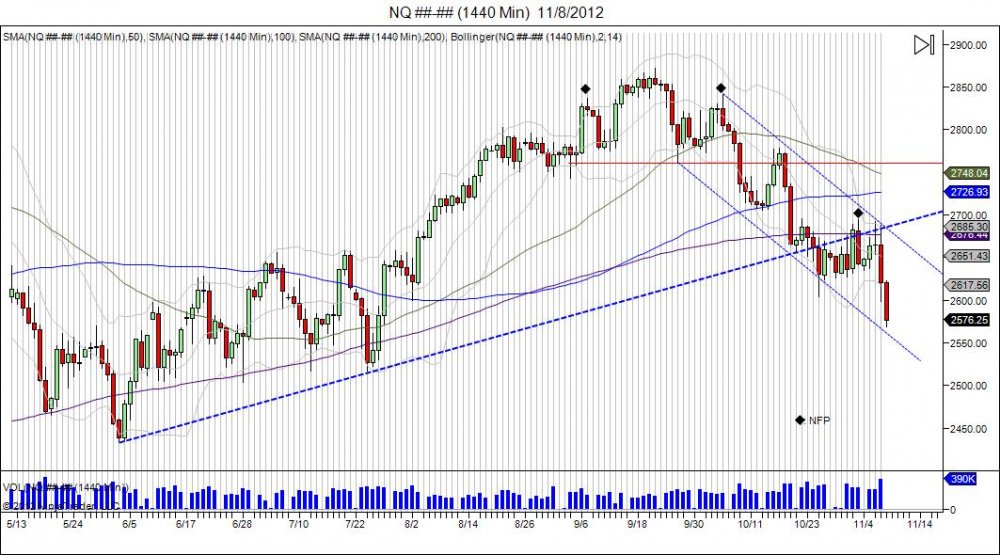
Non Farm Payroll Dates:
09/07/12 - Highs 2836.25
10/05/12 - Highs 2840.75
11/02/12 - Highs 2694.00
The daily Nasdaq chart above shows the importance of the last 3 Non farm payroll dates. The September NFP number marked the left shoulder that was created with highs of 2836.25. A small pullback was seen off that high down to 2777.75. The market early sellers by taking out this NFP high and ran into 2871.75. The move into this level failed as a flat top was made and the market fell to take out the previous low of 2777.75 that led into that high. The breakdown shook longs as the market was digesting the latest QE news. Not quite ready to break down, another squeeze was seen to retest the 2871.75 highs where the market hit 2840.75 on the October NFP number. The test of the highs created a right shoulder for a head/shoulder topping pattern as the market broke lower to take out the neckline of 2762.25. From this level the market moved to expand and complete this head/shoulder pattern by falling into the 2650-2600 range. Since falling into this the market went into consolidation in attempt to hold this support as the move was digested. This led to highs of 2694.00 on Novembers NFP number just before the election. As the election passed, this high was tested and failed, and the downside momentum and chase has continued int he market. This chase is taking place as buyers who missed the August rally higher are coming in to buy the dips only to see the market fail to give an uptick and press down which uses these buyers to sell into as well as squeeze out.
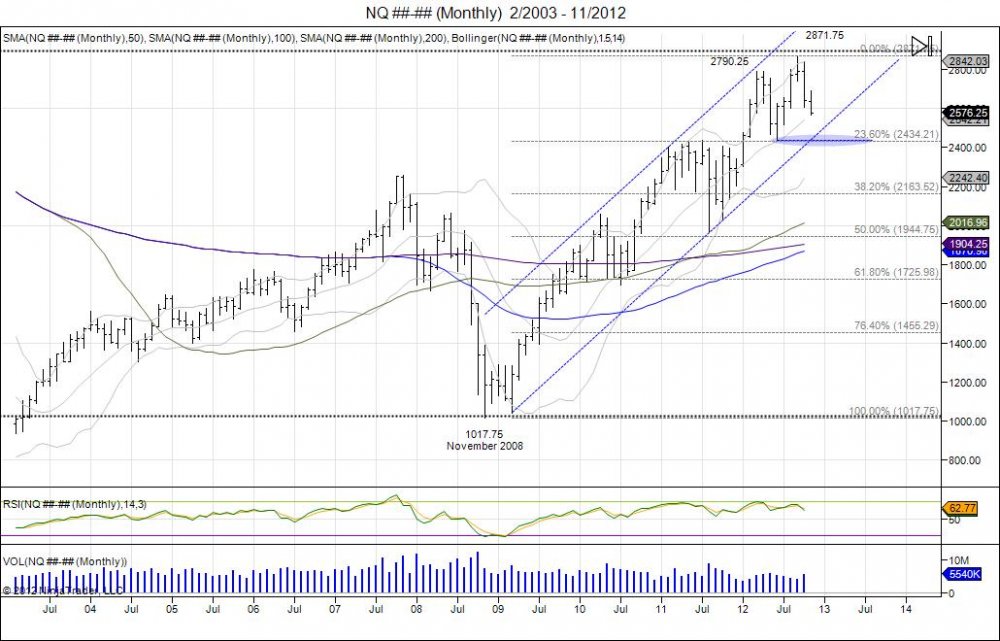
Looking at the monthly chart below we see this correcting 10% thus far of the 1017.75-2871.75 rally over the past 4 years. This correction since the failed highs in September and reversal in October has the market now testing the breakout range in June within 2433.75-2628.25. This is major support for the upside momentum. A target of these lows squeezes shorts and attempts a head/shoulder top formation based off the reversal off the highs and down through these lows. This gives an area of major support as it retraces the market 23.6% and an area to see short covering as well as buyers step in to attempt a retest of the September range. Failure to push the September range sees a right shoulder build followed by a target of the 23.6% neckline again. Breach of the neckline then gives room to expand this range which gives room to the 50% retracement level down to the July 2011 lows of 1972.25. This is all premature, and what we are seeing now is the chase trade that is targeting the 2433.75 lows from June of 2012. Breach of these lows confirms weakness in the market and an area for buyers to step in as well as sellers to await a retest of the September range.
Nasdaq's 2012 Daily Head/Shoulder Creation
RISK DISCLOSURE: PAST PERFORMANCE IS NOT INDICATIVE OF FUTURE RESULTS. THE RISK OF LOSS IN TRADING FUTURES AND OPTIONS IS SUBSTANTIAL AND SUCH INVESTING IS NOT SUITABLE FOR ALL INVESTORS. AN INVESTOR COULD LOSE MORE THAN THE INITIAL INVESTMENT.


