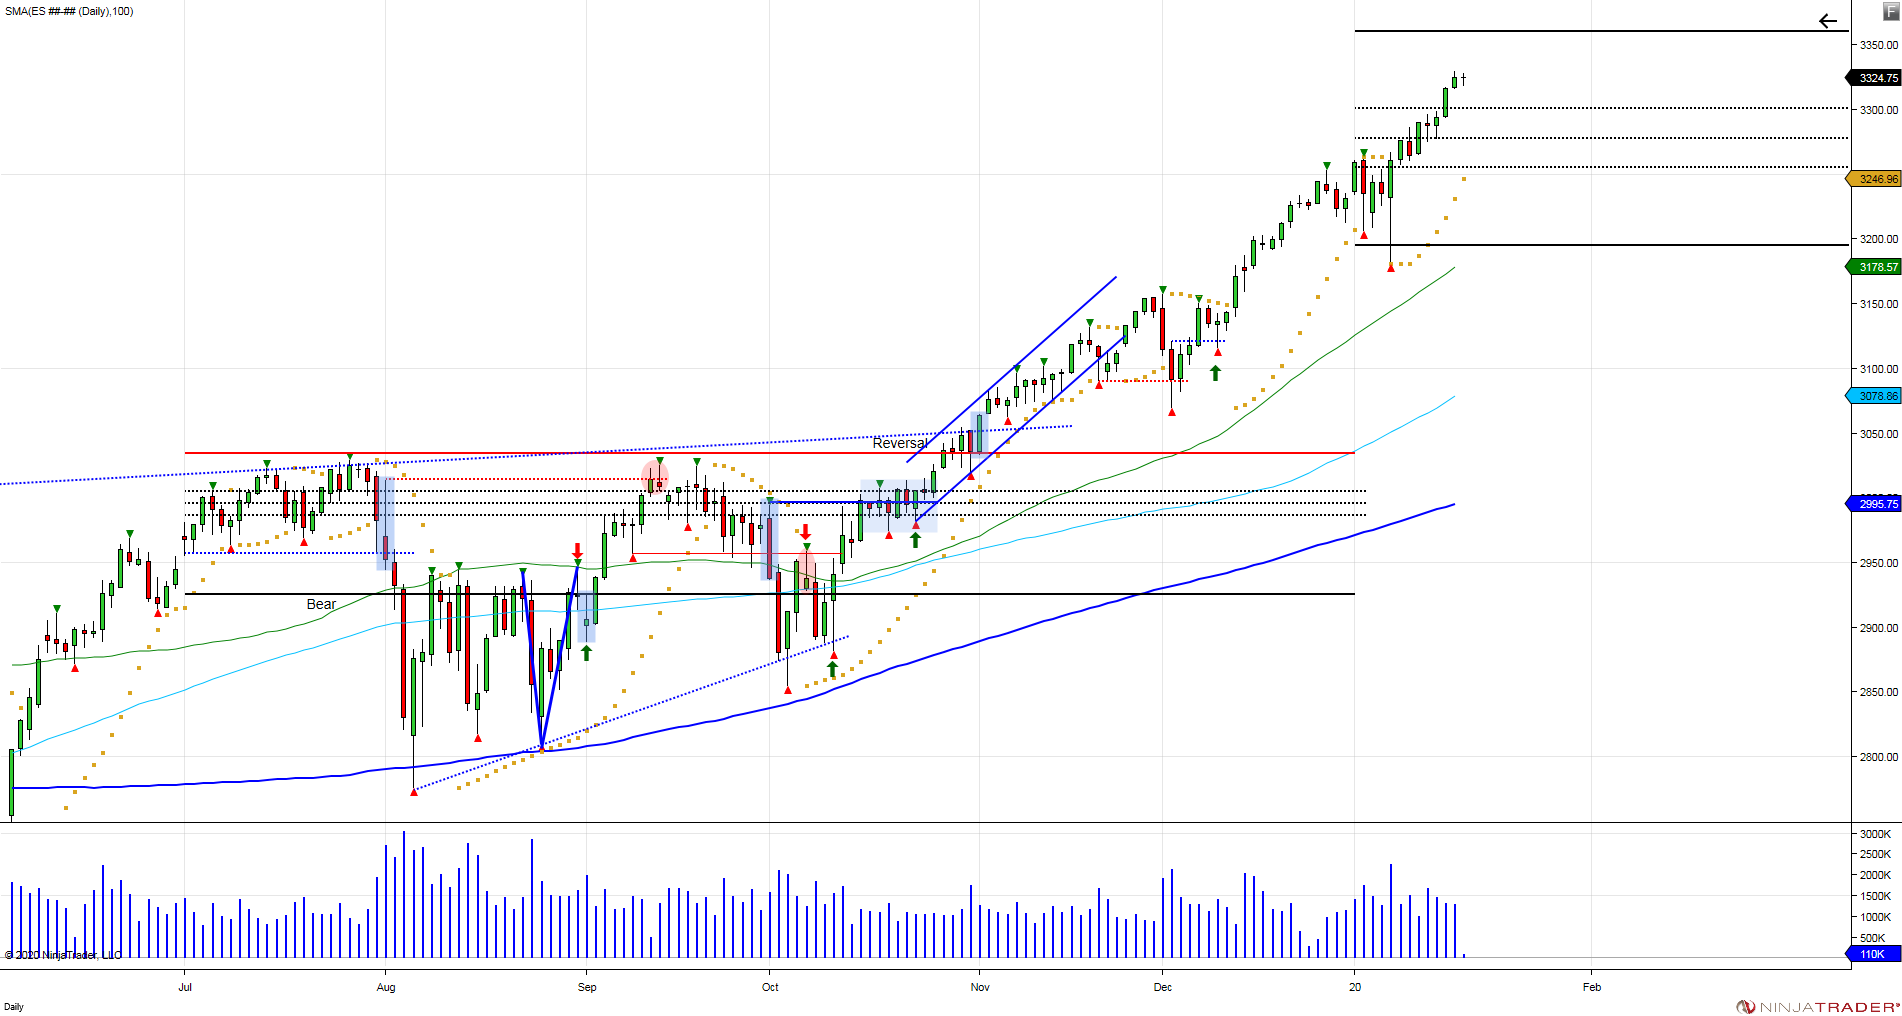
To start off the first half of 2020, the 2 week opening range in January saw the market make a high of 3263 before correcting down to 3181, once again seeing sellers fail to expand lower as the market reversed off this low to overcome 3263. Taking that range of 3263-3181, gives room up to 3345, and as the 2 week opening range closed out last week, the market came close to this with a 3330 high. With the 2 week opening range now completed, we have a new set of 6 month volatility windows and pivots for January – June 2020. The 6 month volatility windows come in at 3196 x 3361. In order to establish a bullish or bearish 6 month bias, the market needs to close above/below the vol windows for 6 trading days. Only one bias can be created, once a bull or bear bias is created, the other side turns into a reversal, as seen in the 2nd half of 2019. Sometimes volatility windows can also be used to trap late buyers and sellers. Since we are coming off a reversal expansion since November from 3035 up to a recent high of 3335, the upper vol window of 3360 will be key as to what the reaction to the level will be. Will the market stall and run out of fuel into testing this level, or will it be able to hold above for 6 trading days to establish a bullish bias and lure in buyers above. Buyers will be forced to defend pullbacks in attempt to continue trending higher. Failure to sustain the breakout over a vol window has the opportunity to trap late buyers above, similar to what took place in January of 2018 https://twitter.com/Chicagostock/status/959475640910209024.
January of 2019 started with the SP500 making a V bottom off its December 2018 low of 2316 by recovering 2520, creating a bullish cup/handle pattern: https://twitter.com/Chicagostock/status/1082322584576974850
After the first 2 weeks of January, the opening range was completed, giving us 6 month volatility windows for January – June. The upper volatility window came in at 2630. The volatility window is used to determine a bias in the market. Since the opening range is based on 2 weeks, in order to establish a bullish or bearish bias, the market needs to close above/below its vol window for half the opening range (1week).
Late January 2019, the market overcame its upper vol window, establishing a bullish 6 month bias and creating a bull flag as it held above its vol window, projecting a move up to 2916: https://twitter.com/Chicagostock/status/1090804147354550273
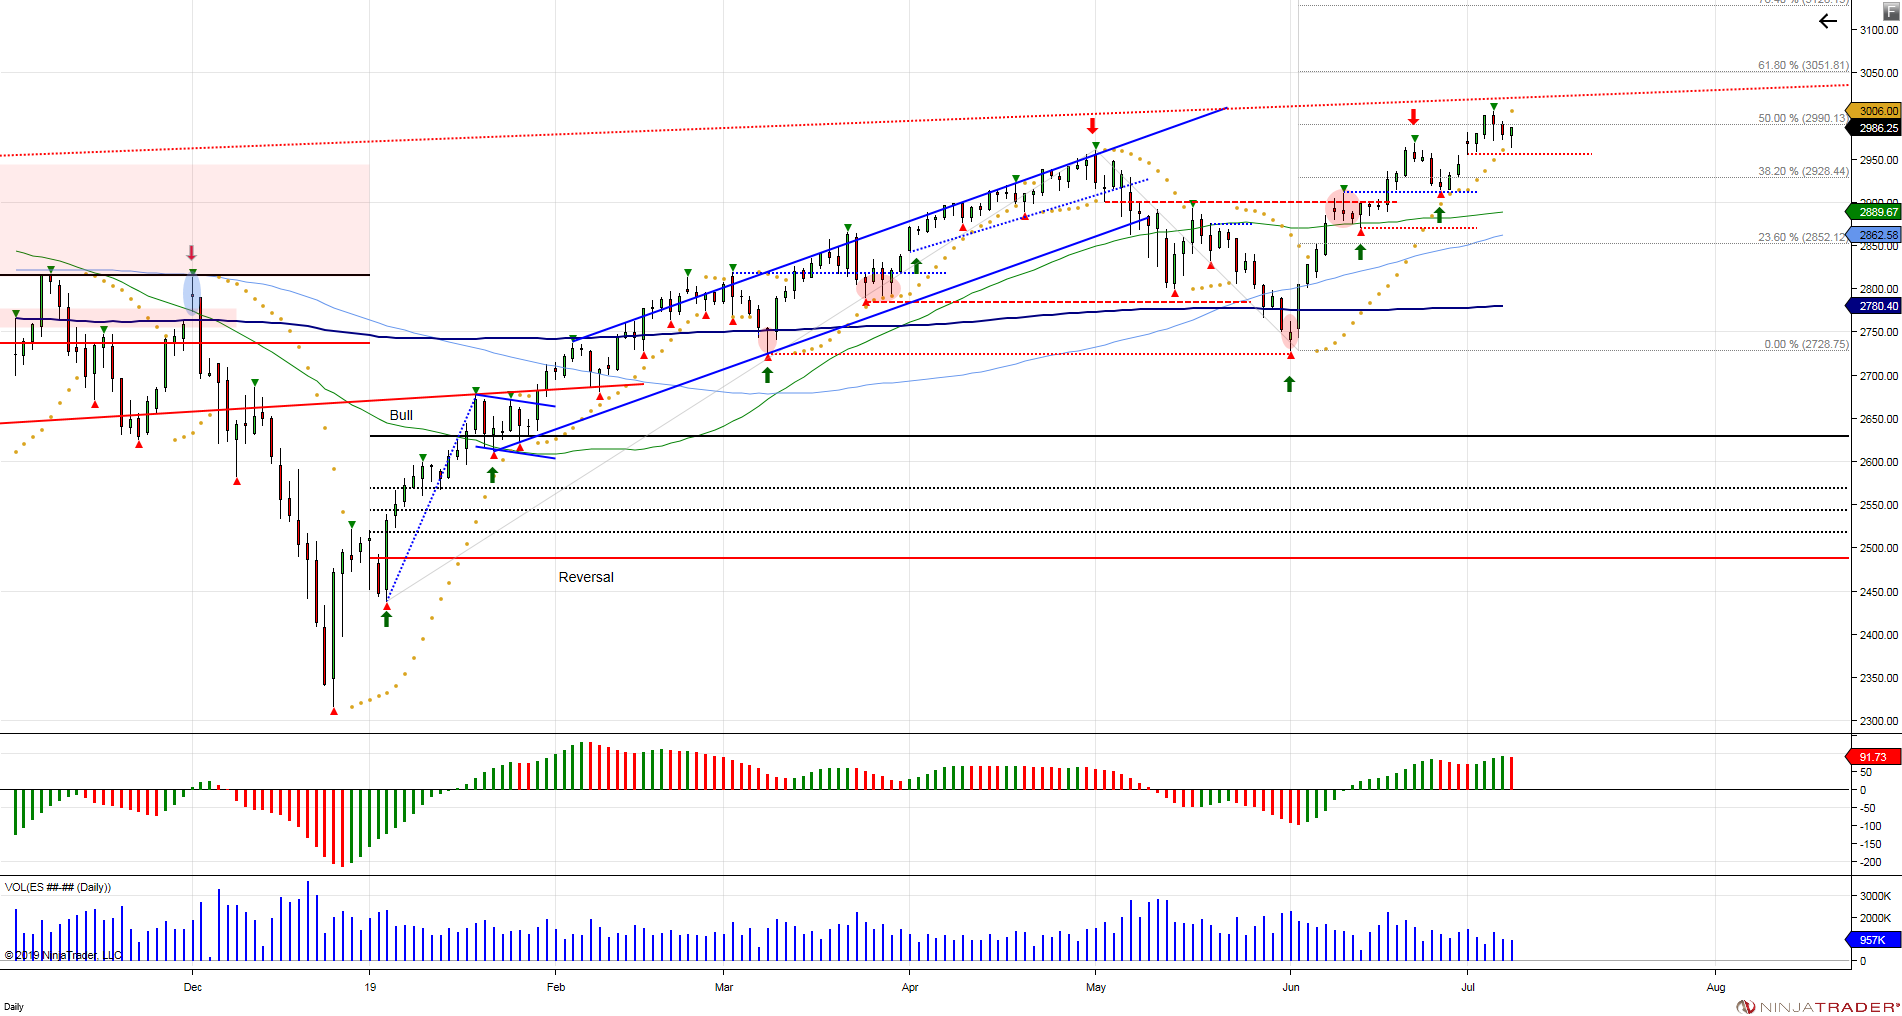
By the end of the first half in 2019, a high of 2969 was made as the market went into July by closing out the first half of the year on the highs.
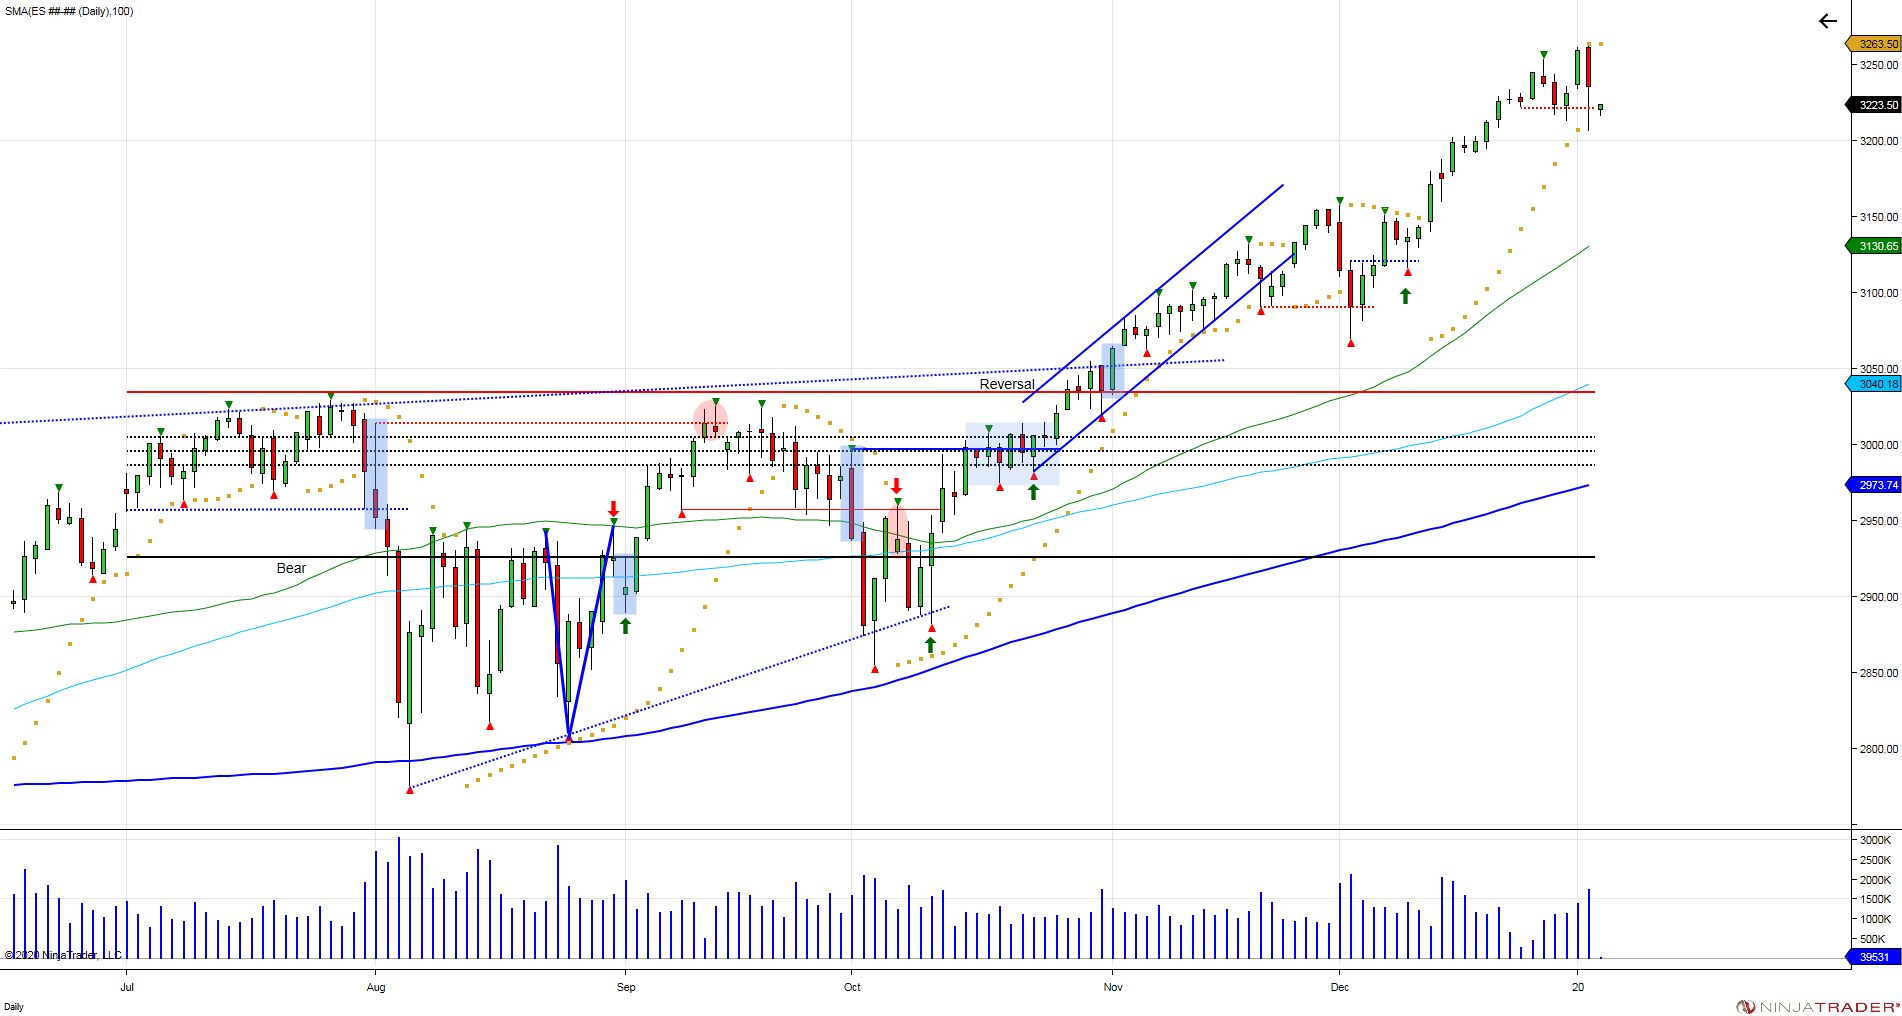
The second half of 2019 provided new 6 month volatility windows, 2927x3065. The market broke below the lower vol window in August, closing below for 5 trading sessions to establish a bearish 6 month bias which lured in short sellers. Short sellers failed to expand the market below 2927 as the August low was defended, setting up another V bottom into the end of August: https://twitter.com/Chicagostock/status/1169638900643639297
The market rallied to test its 6 month reversal window, which is a level created after a bearish bias is established. The reversal window is the last line of defense for sellers to defend the 6 month bearish bias. Sellers were successful in defending the reversal window in September, giving sellers another opportunity to expand below the lower vol window at 2927 in October, only to once again see sellers fail to expand below, and another U turn was created, trapping shorts below 2927 and provided a target of 3161: https://twitter.com/Chicagostock/status/1187815179502981120
In November, the market managed to close above the 6 month reversal window of 3035 for 5 trading sessions, reversing the 6 month bearish bias: https://twitter.com/Chicagostock/status/1190321109696229376
By reversing the 6 month bearish bias, short sellers were proven wrong and forced to cover if not reverse their positions, giving way to expanding the market higher. Notice after the November reversal, the market never looked back as it expanded into a high of 3158 in December (completing the first objective of 3161 from the October U turn), before attempting to correct, only to hold at 3069 and see buyers overcome 3158 to trigger another expansion higher.
The 6 month volatility windows are helpful in providing key levels the market must overcome to establish bullish or bearish biases for the 6 month period in the market. The 6 month volatility window for the SP500 period of January – June 2020 is listed above. Subscribe below for 2 week free trial receive daily volatility windows on the SP500, Nasdaq, Crude oil and Gold. If the 2 week trial is converted into a paid membership, you will also receive the 6 month volatility windows for all US indices, metals, energy and currencies,

