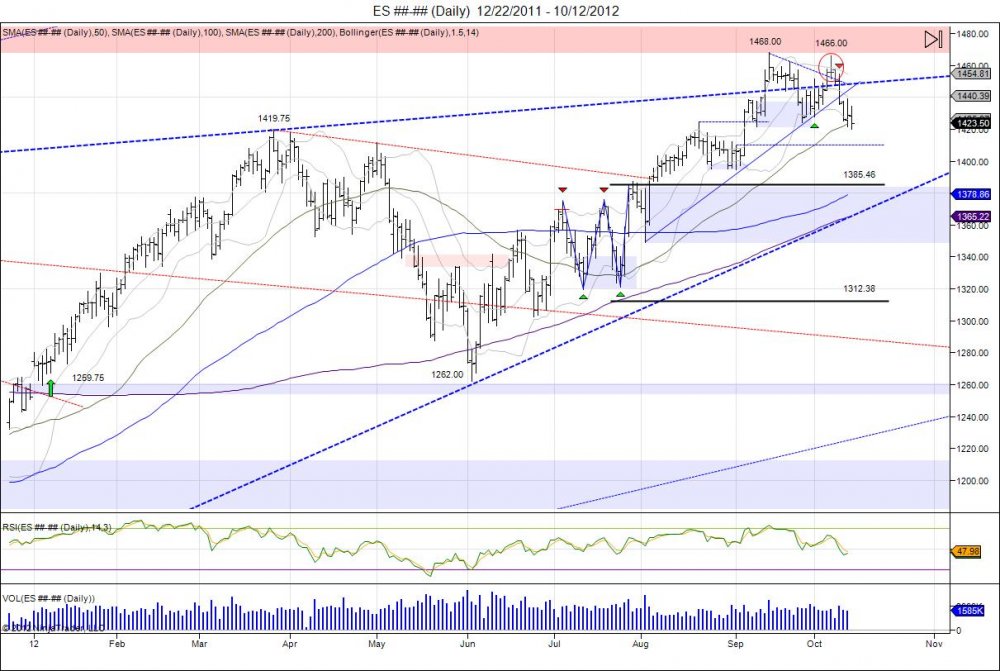
With the SP500 completing its 1441 target coined earlier this early, along with the double bottom made in summer that also targeted this, highs of 1468 were made in September as the short squeeze above the level took the market into this next level of resistance. The market saw a small pullback off the highs and found support off a small trendline based off the August 2nd pivot lows and through the September 4th lows. Not quite ready to break down, the market grinded higher to retest the highs made in September. With the non farm payroll numbers released on October 5th, the market squeezed through 1460, stopping out weak shorts, yet falling short of the 1468 high by 2 handles at 1466 and quickly seeing a rejection during the day. This rejection continued this week as the market saw this as a failure and a potential to double top. With the breakdown seen this week that led the market to take out the trendline from the August2-Sep4 lows, this confirmed the double top and now targeted the 1424 pivot lows made on September 26th prior to double topping. As the market is now working itself through this area of support, next major support comes in at 1410 based off the 1394.50 pivot low made on September 4th, and ultimately sees next major support at 1385 being where the market broke out early August to establish the bullish bias for the second half of the year. This fills the market back to where it broke out during the summer as many coined as a "light volume" rally, and most missed the move higher. This gives the ultimate level for the market to base out for the year and see if buyers step up at these levels to support the market after squeezing out all these late buyers who have come into the market chasing above 1420. The 50day moving avearge is being tested here. For this week the bear mission is to close the market below last week's open of 1432.75 to establish a bearish engulfment on the weekly chart to project more weakness going into next week. Doing so sees first level of resistance at 1427.75, followed by 1451.25 being the lows off the failed 1466 high and the range buyers must work through to regain momentum.
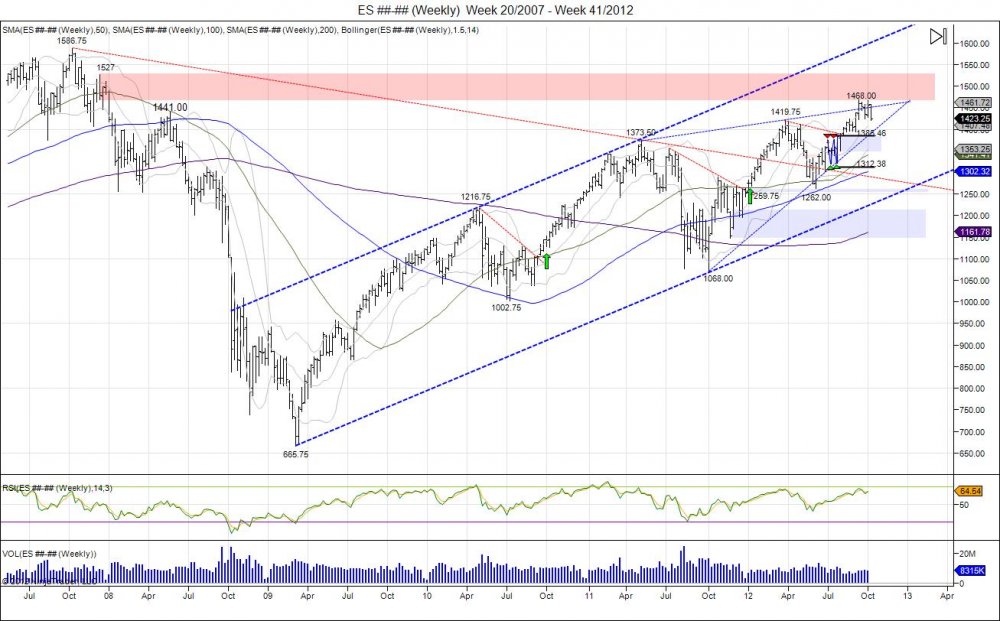
Anytime the market completes a target, in this case it was 1441, it does not mean a top is made right away. Rather we wait for the market to digest the prices and show us whether the market has more gas in the tank or starts to falter, before flipping directions.
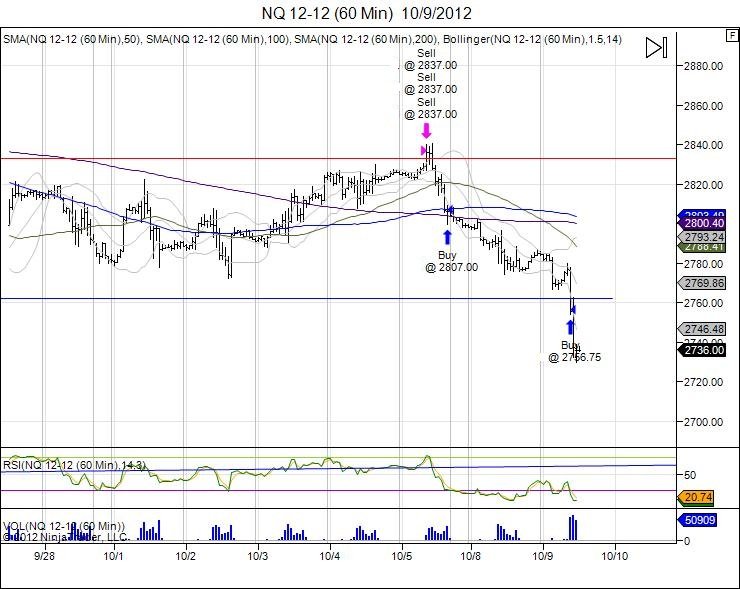
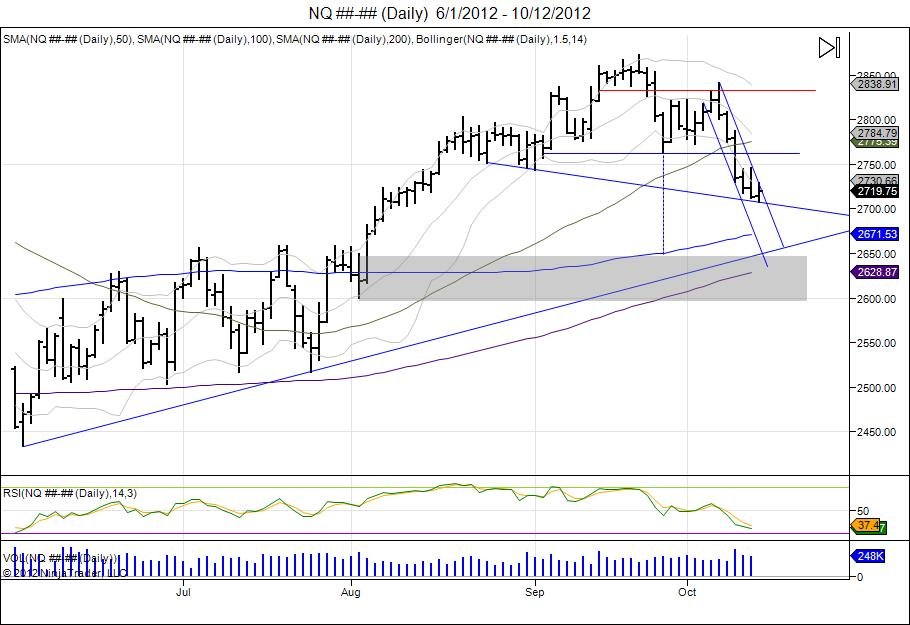
In the case of this recent correction... The weakness first appeared in the Midcaps, showing a head/shoulder pattern. Next, the weakness started to appear in the Nasdaq index as the market fell off its 2871.75 highs and into 2762 to make new lows for the month of September. Going forward, this setup a potential for a head/shoulder top as the market grinded back to retest the highs and was met with resistance at 2840 on the NFP squeeze. Failing to push the highs, the NFP spark landed the market right into the hands of sellers defending the highs, in turn creating a right shoulder that led the market to break its neckline of 2762. Anytime a head/shoulder is played, traders must always look to get into the market in the right shoulder so by the time the market comes down to the neckline, a majority of profits is being taken as the pattern is then visible by the street. This is due because many times the pattern can fail and the breakdown below the neckline is used to lure in late sellers and squeeze buyers only to turn the market back higher. Thus, runners should only be working below the neckline to look for the expansion of the head/shoulder to take place which is always the home run should the market complete.
For precise entry, stop, and target levels on day and swing trades along with updates, click here for more information.

