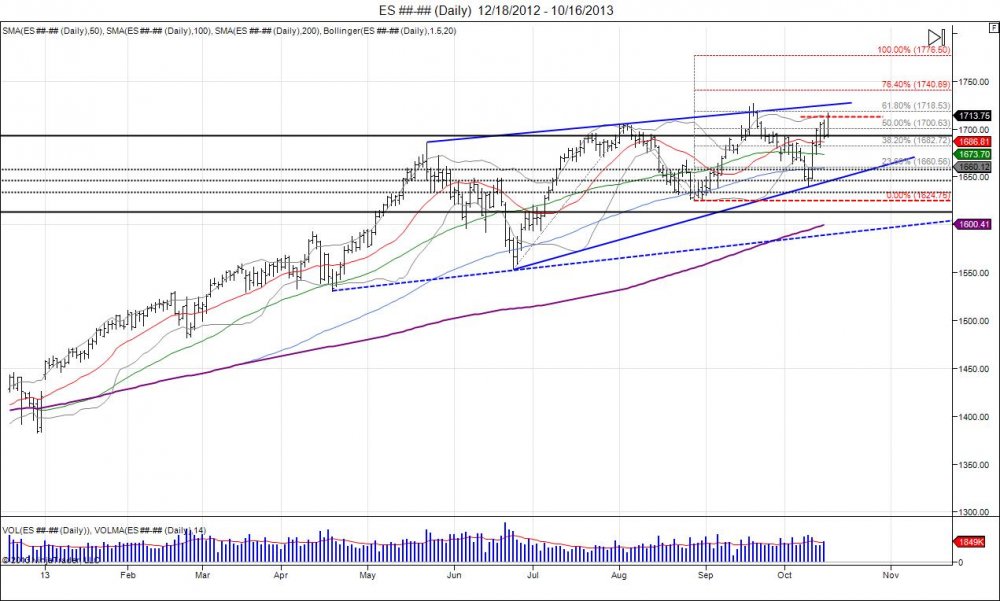
The SP500 is back at pressing last month's, keeping the rising wedge of higher lows and higher highs since the May correction. Putting the market back in the hands of sellers to defend just as a deal on the debt ceiling is made.
The last high at 172675 capitulated shorts above its previous high of 1705 as the Fed surprised the market with no taper and no Larry Summers. This was followed by a pullback which failed to see buyers materialize inside 1680s as the gap was filled post shorts being squeezed. Establishing a weekly bearish engulfment and eventually grinding down into lows of 1640 to test last and major support based off the 162475 August low. Sure enough this held to see the market develop a reversal that was fueled by talks of a deal taking place on the debt ceiling. Shooting the SP 60 points back to retesting major resistance within 1710-1715 from the failed high in September. Just as the SP tests this major resistance, Congress has struck a deal with less then 14 hours before the debt ceiling was to be breached. Many are looking for sell the news to take place, and the test of the September highs here is the true tell as to whether buyers can continue to support prices to push through sellers now coming into defend this resistance. For the market to reject this test of the September high, a quick reversal needs to be seen to fall back below 1690 to give way to test support at 1658 based off the 1640 lows. The longer buyers can support prices at these levels, the more pressure to squeeze out the September high and put in another higher high. Should this take place, we see next major resistance levels coming in at 1740 as a 76.4% fib extension, and ultimately 1776 as a 100% fib extension. Keeping in mind the May high at 1685 that led to the biggest correction of the year was also a 100% fib extension. This would be ironic to see the market reach for this number, the year of revolution/America's birth, just as Congress' approval ratings drop to all time lows and they continue to kick the can down the road with no real solutions on cutting spending or the debt.
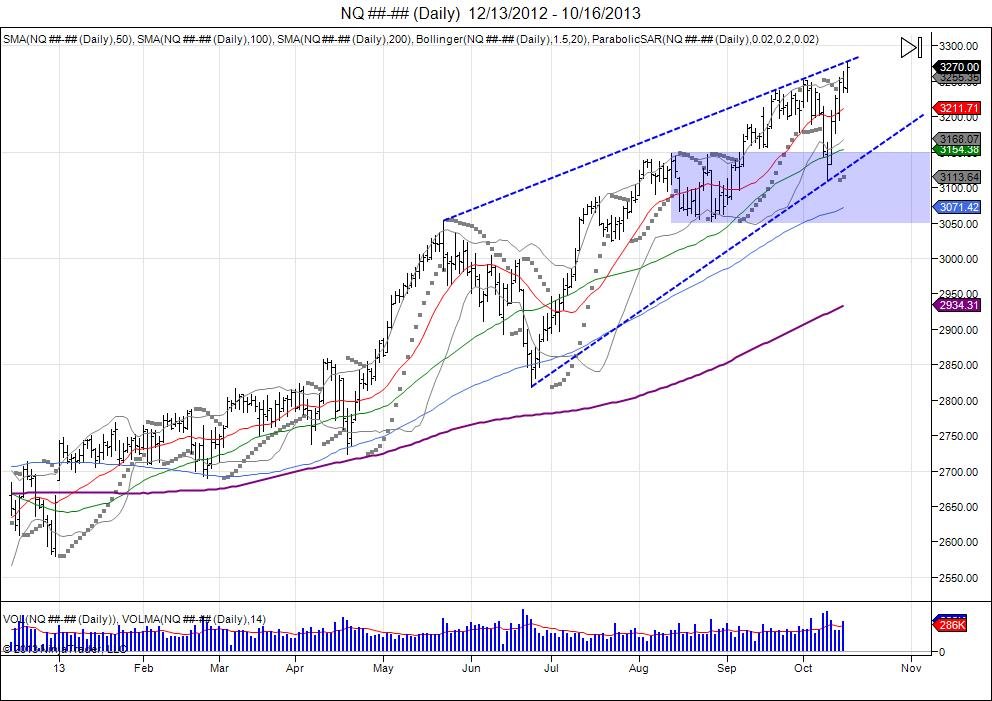
NASDAQ:
DOW:
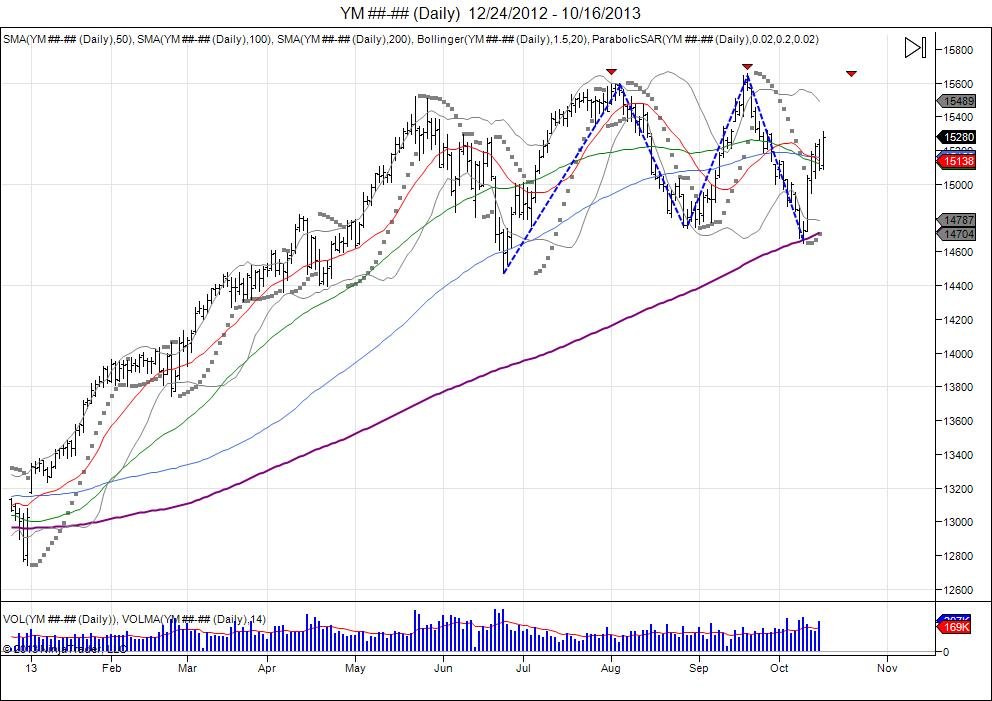
Potential head/shoulder pattern in Dow setting up on continued strength to retest highs.
VOLATILITY INDEX: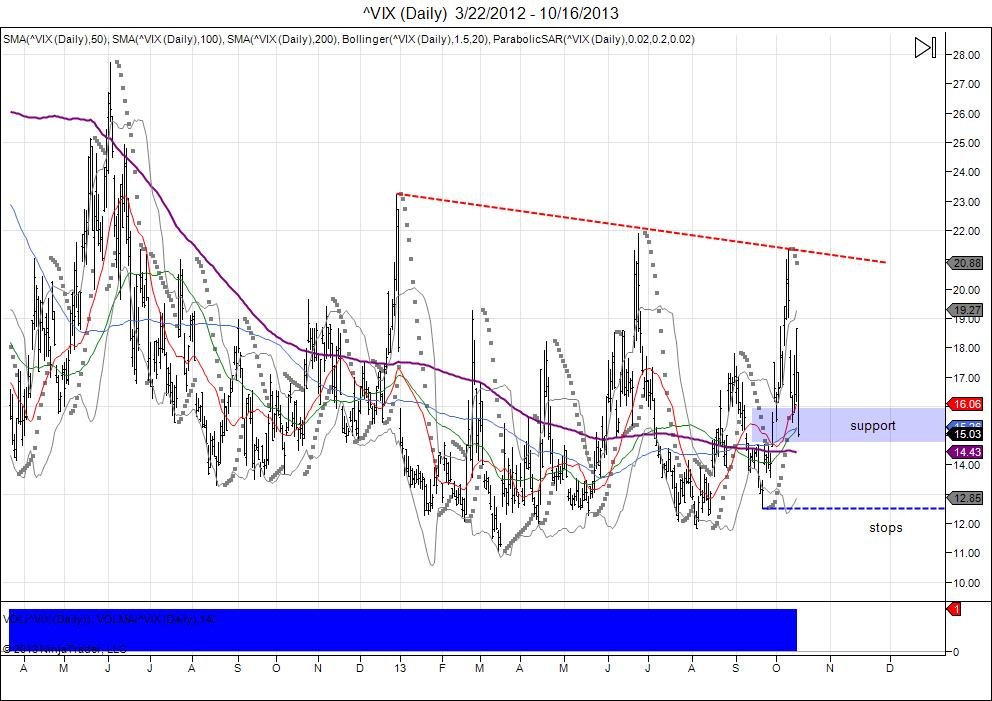
RISK DISCLOSURE: PAST PERFORMANCE IS NOT INDICATIVE OF FUTURE RESULTS. THE RISK OF LOSS IN TRADING FUTURES AND OPTIONS IS SUBSTANTIAL AND SUCH INVESTING IS NOT SUITABLE FOR ALL INVESTORS. AN INVESTOR COULD LOSE MORE THAN THE INITIAL INVESTMENT.

