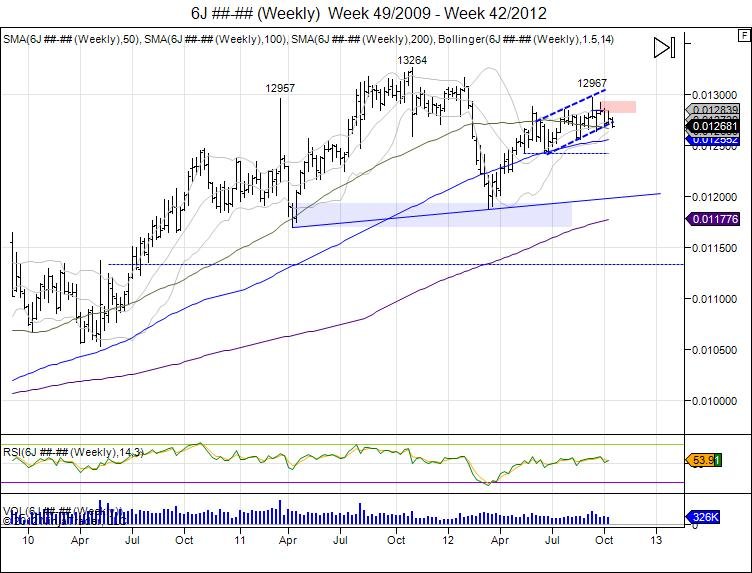
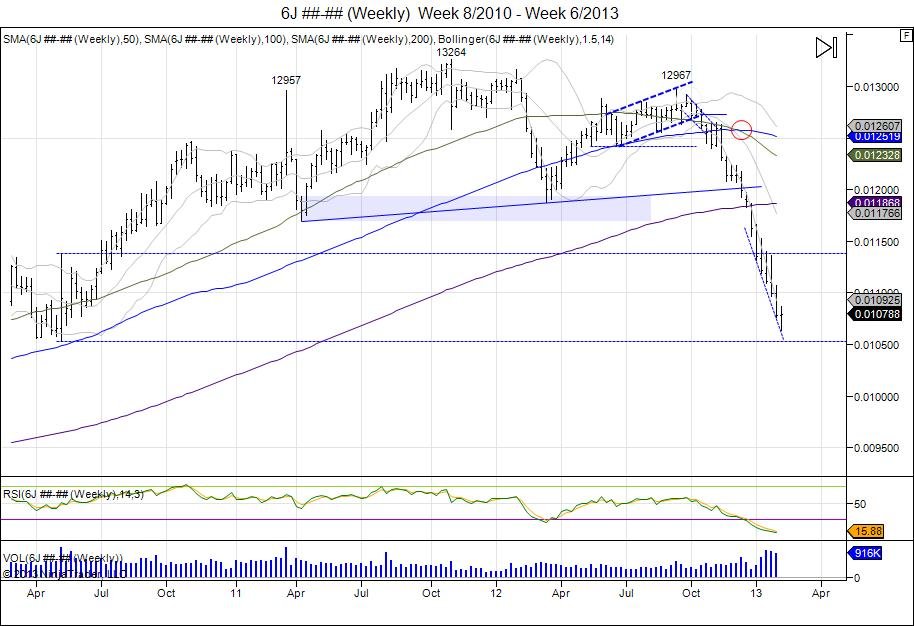
The Japanese Yen has come a long way since putting in it's right shoulder of 12967 in September of 2012 and breaking its neckline of 11879 in December. This this breach of the neckline, the market has been in a downside chase in a hurry to complete its h/s target of 10494. Target is used by taking range 13264-11879=1385 and subtracting this from 11879 to give 10494. Lows of 10633 were made this week as the Yen has retraced back to the flash crash levels of 2010. The opening in May was 10650 which has provided some support at this time with lows of 10532 as seen on the weekly chart. An attempt to bottom out is being made here however major stops remain below this 10532 low from May of 2010 so any buying at these levels is aggressive and most likely short covering. First level of support comes within 10730-10760 as a range aggressive buyers can defend with small stops below these most recent lows of 10630. First level of upside resistance met within 10960-11075, followed by 11090-11396.
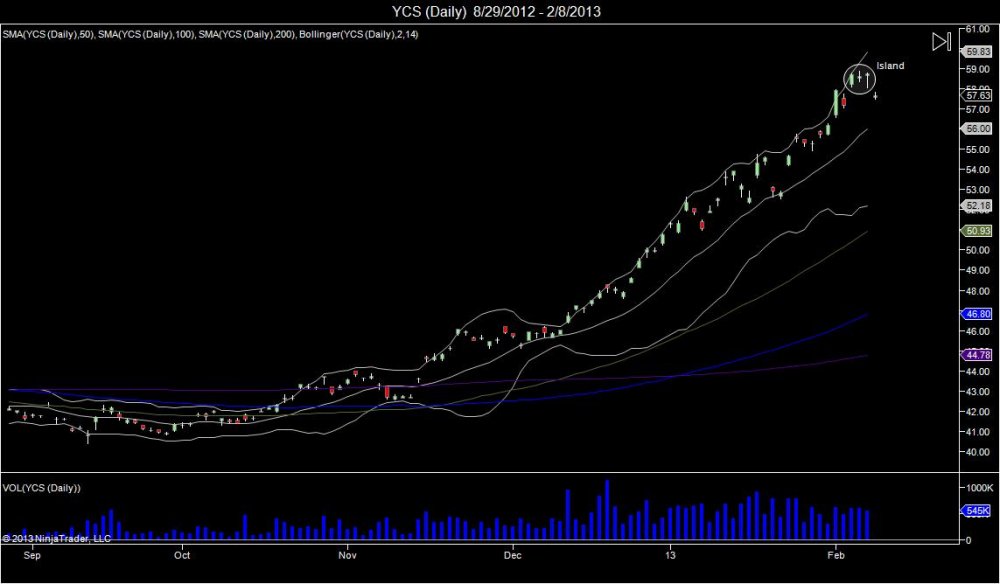
The ultrashort ETF of the Yen has seen 13 straight weeks of gains. The market is attempting an island top as it traded in a range of 5805-5885 and has gapped below this range. This range is new level of minor resistance going forward which can lead to a chase lower in search of support. First level of major support seen within 5475-5230.
RISK DISCLOSURE: PAST PERFORMANCE IS NOT INDICATIVE OF FUTURE RESULTS. THE RISK OF LOSS IN TRADING FUTURES AND OPTIONS IS SUBSTANTIAL AND SUCH INVESTING IS NOT SUITABLE FOR ALL INVESTORS. AN INVESTOR COULD LOSE MORE THAN THE INITIAL INVESTMENT.

