click chart to enlarge
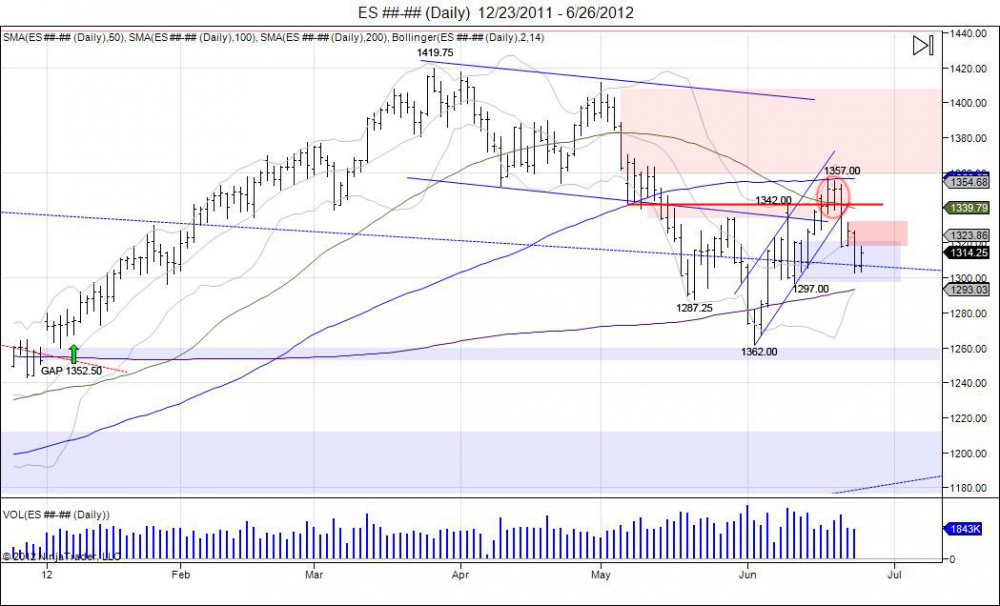
On Tuesday the SP500 worked its way higher after a test of the week low 1302.50 held, catching shorts off guard which led to a short squeeze right into testing Friday's lows of 1318.25. This is where the market paused following last Thursday's break lower below the rising channel which was followed by a brief pause seen on Friday as the market held and traded higher causing shorts to cover into the weekend. On Monday the move down was continued and sellers chased the market lower. Tuesday we saw once again a hold and a trade higher causing shorts to cover, only to lead right into where the market failed on Friday within 1318.25-1331.75. This is a major range for buyers to squeeze through to show strength and attempt to retest where the market failed at 1336.50-1357.00 as the market tested its 100day moving average which kept a lid on prices and has the market now pressuring against retesting the 200day moving average along with the right shoulder of 1297 built on June 12. Tuesday the market did show potential as sellers were unable to put in a new low for the week, causing a intraday U turn which built a handle and pushed into highs of 1318. This push into 1318 is knocking on the door of resistance and is giving sellers their area to defend. Buyers have Tuesday's lows as their reference point to defend pullbacks and use this turn around to attempt to swim against these trends and squeeze through these resistance levels of 1318, 1327, 1336, 1390. Downside support is seen at 1310, break below 1297 gives room to retest the June lows with support at 1282. In the big picture, this is a retest of the inverted head/shoulders that was created mid May into mid June, offering buyers their levels to defend. Failure to do so and a break of the June lows sees room down to next major support at 1209. We believe this pullback offers opportunity for buyers to step up and trade the long side, scaling out against upside resistance levels and adjusting stops accordingly. The inverted head/shoulders within 1342-1262 offers a 80 point range, if added to 1342, this targets 1422 which is a retest of the year highs at 1419.75. Ultimately this will give room to run stops against the main May 2008 highs of 1441 which was the reversal that led into the lows of 665.75. Failure to hold the 1297 level gives the room into retesting those 1262 lows where a break of this gives room to fill the gap from last year down to 1252.50 which puts the sellers into control. The 2nd half of the year begins in July, and how the market trades in the first two weeks will set the tone for the remainder of the year.
For precise entry, stop, and target levels on day and swing trades along with updates, click here for more information.
Limited time Pro Membership trial, follow above link for more information!

