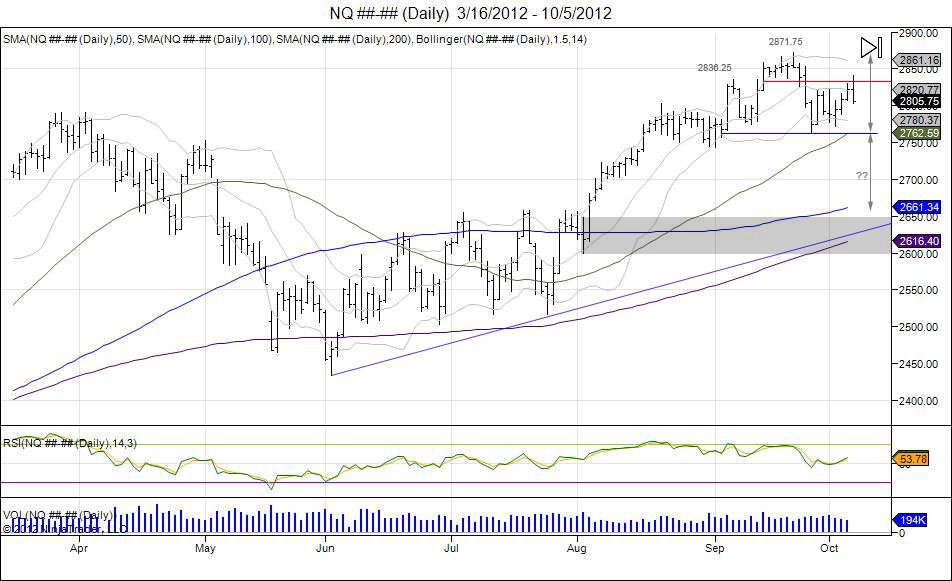
Last month, the Nasdaq future made a higher high of 2871.75, just before reversing to take out the 2775.25 lows made just before that high. The market made lows of 2762.25 on September 26th. Not ready to break the September lows, the market grinded higher off this late September low into retesting where the market failed from the highs. This retest was touched today on the NFP number with highs of 2840.75. This put the market right into the hands of sellers to defend the failed September high, and looking for a right shoulder to build on this failure. Thus far the market is trading on its lows and giving these sellers oppurtunity to take a portion off as this is being reversed the same day. Going forward, buyers must work through this 2840-2872 resistance to squeeze out this head/shoulder pattern attempt and stop sellers. Sellers must look for a move down to the neckline now of 2762.25 to confirm this pattern and allow for another level to take a layer of shorts off. Continuation of the pattern is seen should the market continue to see sellers below the neckline which gives a downside target of 2652.75, retracing the market to where it broke out early August.
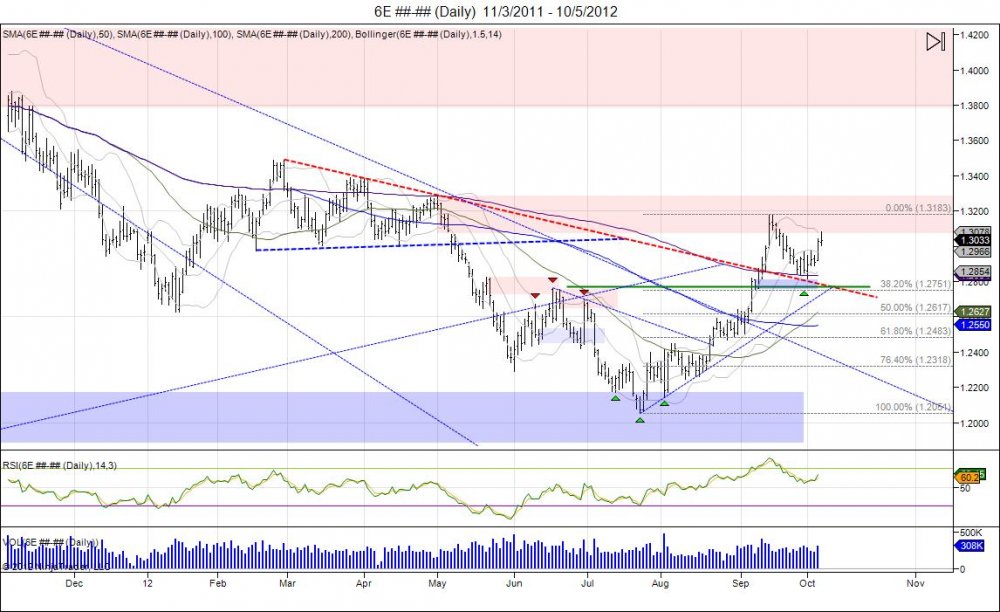
As Nasdaq retraced into its September failed highs, the Euro also retraced today into its failed September high after seeing a bounce earlier in the week off support at 128. Going forward, the Euro must squeeze this September high to continue the momentum into 142 to retrace the market to where it broke down last October. This week's close above 12862 has created a bullish engulfment bar on the weekly chart, so buyers must look to defend pullbacks down to 12839 to support last week's lows. Failure to hold lows sees next major support of at 12617 to retrace 50% of the rally from July and to retest the breakout made in September.
For precise entry, stop, and target levels on day and swing trades along with updates, click here for more information.

