Click chart below to maximize.
more...
.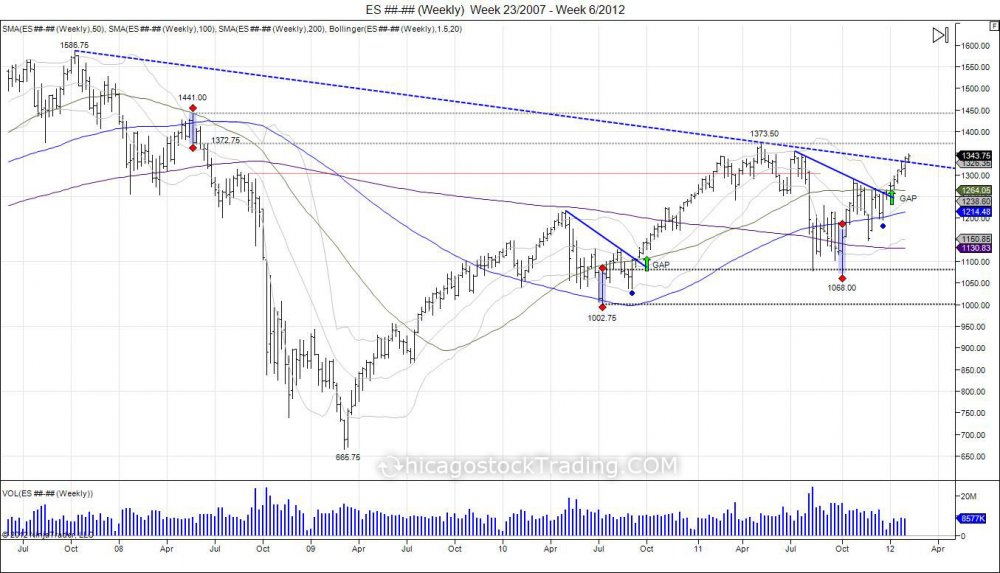
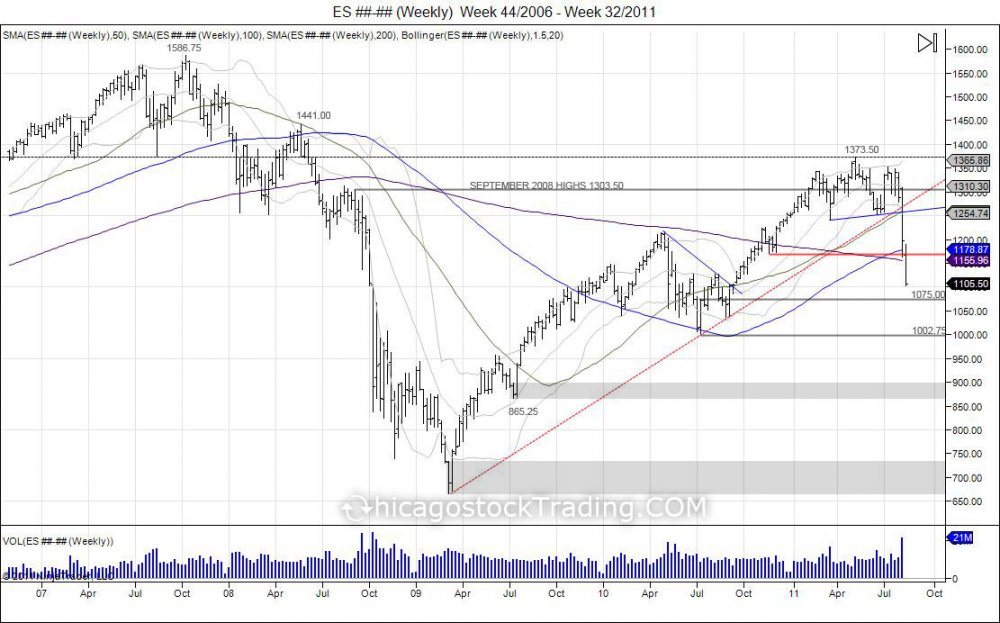
This video highlights the SP500 movements as the market rallied into its May 2008 levels of 1373/1441 by hitting 1373 before falling back to fill its gap breakout in September 2010 at 1105. This was followed by major consolidation and times of volatility as market found support at 1070. The market is attempting to repeat its breakout pattern in September of 2010 by gapping higher and squeezing on low volume, as we are seeing 2012 began with a gap up followed by low volume squeeze higher. Every breakdown in 2012 thus far has been used as buying oppurunity and has lured short sellers only to turn around and use those shorts as fuel for the upside. This tries to return back to where the market orignially broke down from 1354.50 in July of 2011. Once this is completed the market has formed a U turn and will need to look for a base of consolidation to attempt to then target the 1373 highs and continue where the market left off to try and complete the upside target of 1441 and squeeze the May 2008 highs. The first test of these May 2008 levels was met with resistance and the market fell to find support at 1070 so now it looks to go back there and reach for the top level at 1441.
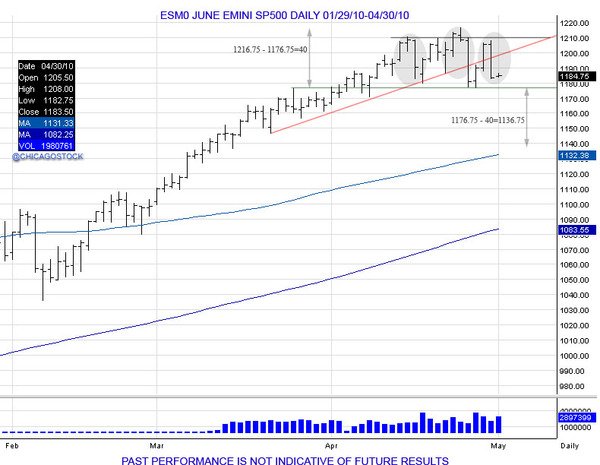
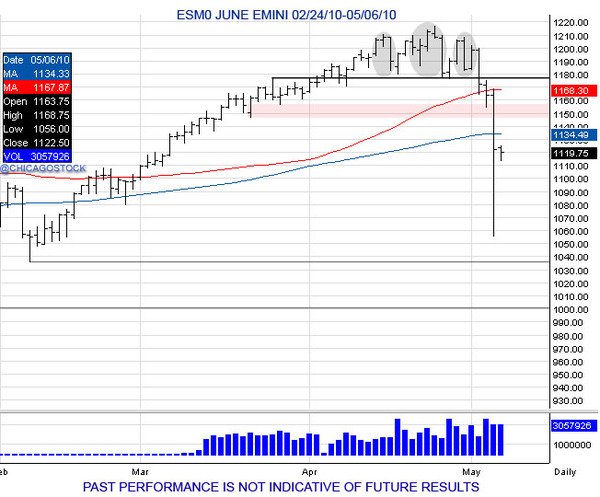
The market climbs the wall of worry and due to all the macro conditions surrounding and the continued need of support from central banking, it is a fragile market. As we say the market walks up the glass stairs and due to its fragility can break through at any point as we saw in 2010 and 2011. Since the lows of 665.75 in 2009 the market has gone through two major corrections and shakedowns. The first one was in 2010 as the market put in a head/shoulders top that led into the "flash crash" panic, dropping the market over 100 points. The second was in 2011 as the market hit major resistance of 1373 and corrected 300 points. Both of these corrections were used to shake out the market before continuing the momentum higher. Following this last correction the market is trying to push past 1373 and target 1440s before another major correction. Lesson is we always need to be on our toes for the next move.
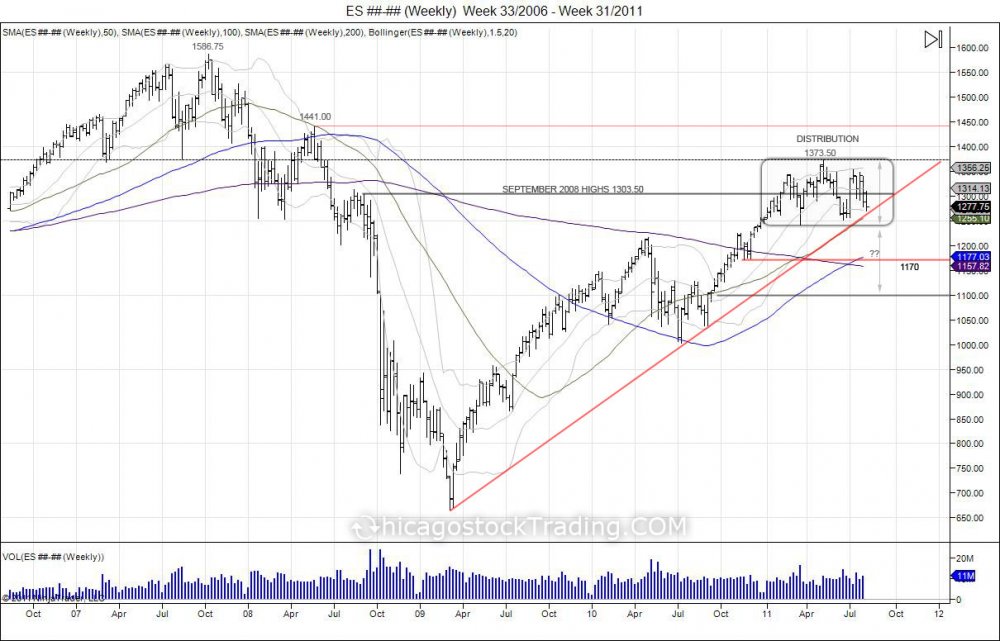
The last two tops that occured both were started by consolidation before failure which brought forth the drop. This means, don't try to fight the tape and "call the top", wait for the market to give the signals and show its weakness as it did in the past 2 tops. Below shows how the Chicagostock Trading newsletter identified both topping formations in 2010 and 2011, allowing subscribers to properly position for protection and or downside shorts.
2010 Head/Shoulders Top:
2010 Head/Shoulders target completed with flash crash move (notice velocity of move):
2011 Head/Shoulders top and failed test of 1373 pointing toward 1100:
2011 Head/Shoulders target completed, (notice velocity of move):