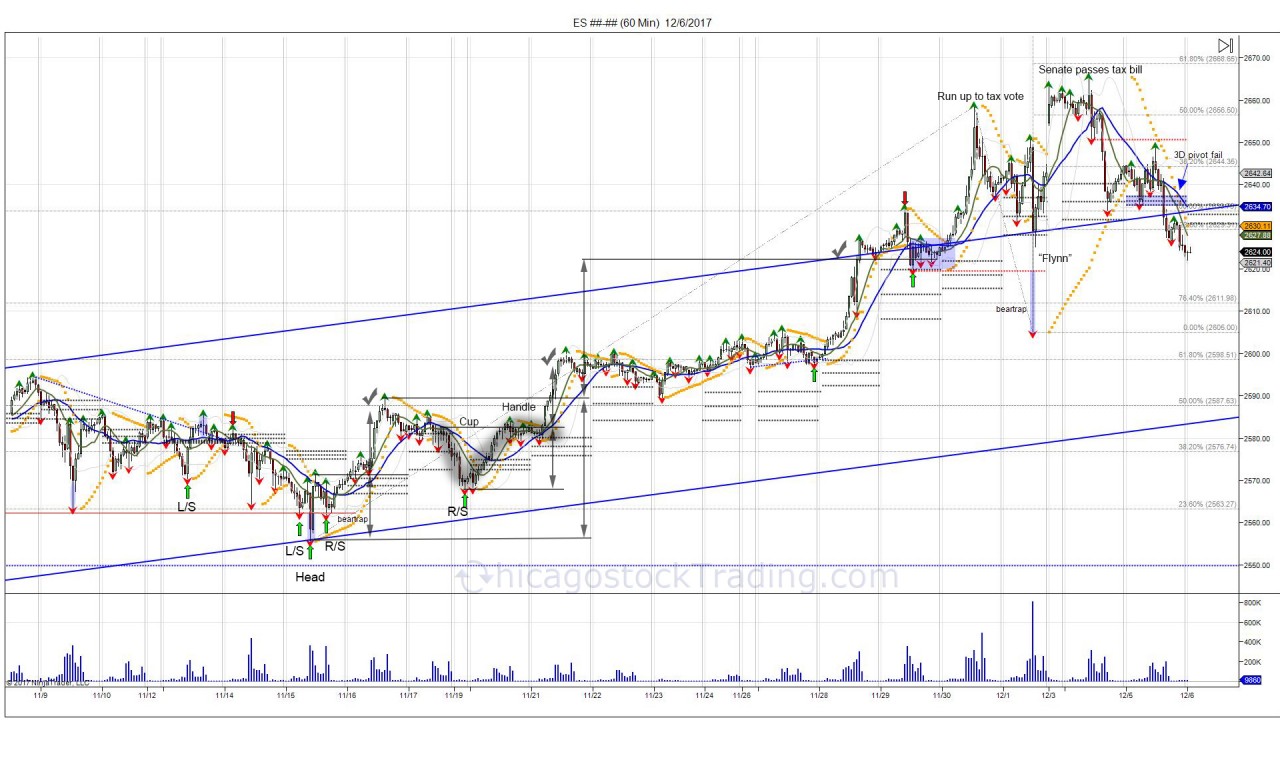
Right before Thanksgiving, there was one technical pattern that was yet to be completed, the inverted head/shoulder projecting 2626 seen here. When the market made new month lows on November 15th and recovered, this created a bear trap with a minor inverted head/shoulder pattern that completed the next day at 2587. After squeezing off the low and completing the small inverted head/shoulder, two new patterns developed. The pullback into retesting the November low gave buyers an opportunity to defend the low, in turn creating a right shoulder for a larger inverted head/shoulder pattern, targeting 2623. Inside of this right shoulder, a minor cup/handle formed, projecting a breakout over the neckline of 258950 to test 2600. After pushing through 2590, the market overcame its last high made on November 16th, aka the "neckline", giving way to expand the larger inverted h/s pattern from 2589 up to 2623. It took 5 trading days to get to this objective on November 28th. After running into 2623 and completing the inverted head/shoulder technical pattern, this is where the market became sloppy. Buyers were not done. Buyers rushed into the market on November 30th in anticipation of the tax bill passing the senate, pushing the market to make a high of 265850. The next day after this high, news came out alleging President Trump ordering Flynn to contact Russia as a candidate, not as the President elect. Nonetheless the market flushed down to a low of 2605, before recovering to settle the market at 2644 and await the tax vote into the weekend. Over the weekend the senate managed to pass the tax bill, which saw Sunday's futures gap 10 higher on the open at 2654. The higher open lured in new buyers, run into the 2665 100% Fibonacci extension where the lid was met and resisted, dropping the market back to Friday's settle of 2644.
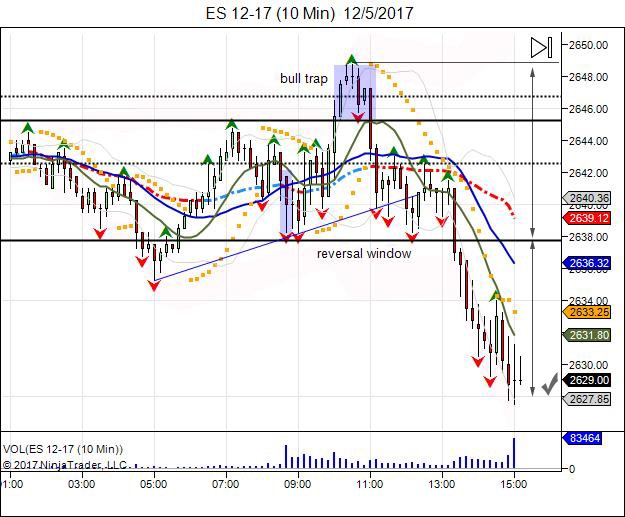
On Tuesday the cash market overcame its upper vol window at 2645 to lure in new buyers, in attempt to give another opportunity to recover trapped longs from Monday above 2650. This turned into an intraday bull trap that fueled a reversal lower as buyers failed to overcome 2650, leaving buyers from Monday's gap up trapped above. The fall and failure to hold the intraday reversal window at 2638, gave way to expand the 10 handle range down to 2628. See here.
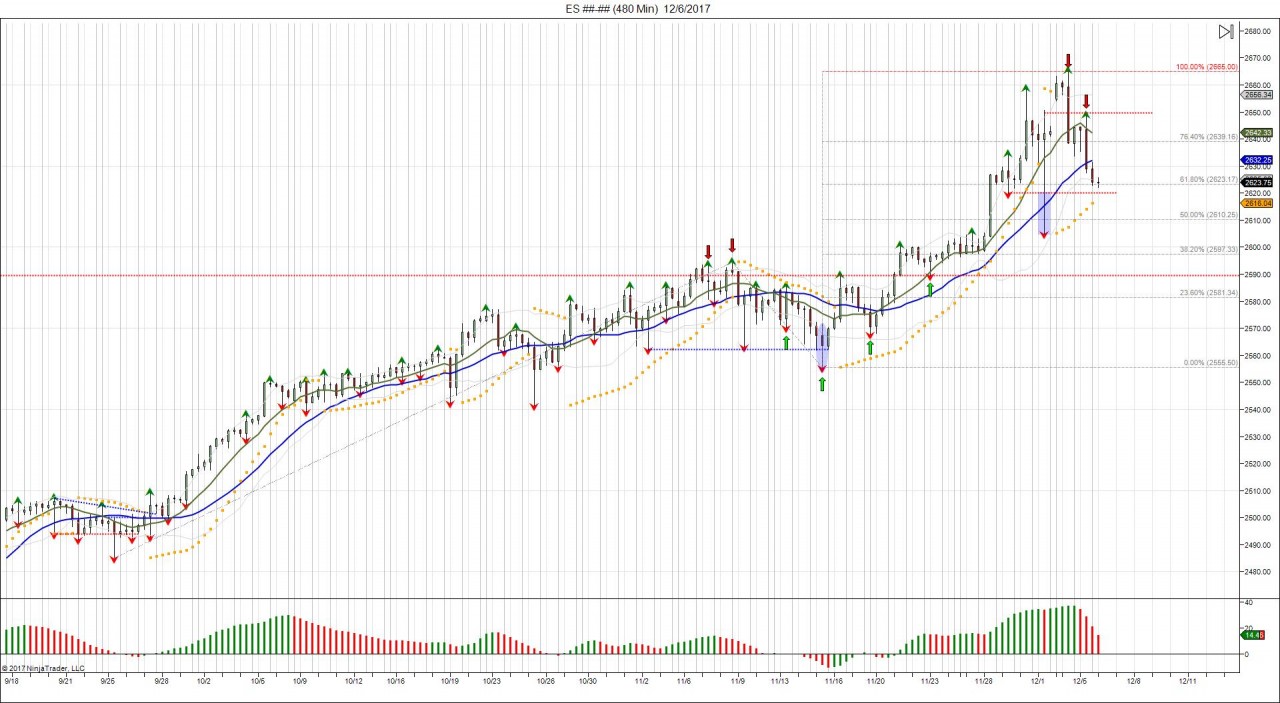
Notice in the above chart Sunday's gap up stopping out shorts into the 2665 fibonnaci extension. The gap up Monday lured in new buyers, however trapped them as buyers failed to overcome 2650 on Tuesday. Going forward, these longs are on the hook as the market is back to retesting the 2623 level. This means the hyperbola over 2623 has the potential of a larger bull trap developing. Failure to hold the last week's low shakes out these longs, and forces shorts to get back into the market. This gives room to retest the breakout at 2590-2580 from the right shoulder of the inverted head/shoulder pattern that projected 2623. Notice how volatility and volume has picked up above 2623. This is the panic of late buyers chasing the market and the tug of war being seen as sellers and buyers are being whipsawed. A bounce back to 2638 allows a retest of Tuesday's failed 264875 high in which buyers will need to overcome for another shot at the highs. Failure to overcome 2638, keeps longs above on the hook for a test of 2605.

