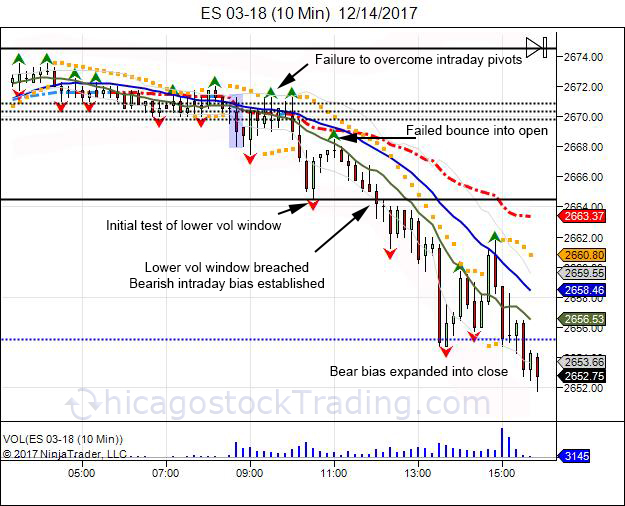
 On Thursday, the day after the FOMC statement, we review the intraday action in regards to Chicagostock's Volatility windows and pivots. The highlighted blue box, is the cash market open, NYSE 930 AM. After the open, the cash market had trouble overcoming the intraday pivots, seeing the range act as resistance. This led the market to fall into the lower Vol window which was met with a defensive bounce. The defensive bounce gave way for a retest of the open, giving sellers an area to defend and buyers major resistance to overcome. For buyers that picked up the initial test of the lower Vol window, this provided a bounce to take some profits into. Second or third attempt at the lower Vol window, increases the odds of seeing the level failing. After failing to overcome the opening range, the market drifted back toward the lower Vol window which was taken out. In order to establish a bearish intraday bias, a 5 minute hold below the lower Vol window needs to be seen. Sometimes the market can establish a bias, and bounce back to the open to again force sellers to defend their intraday trend. In this case, the second test of the lower Vol window saw the level taken out, establishing a bearish intraday bias. Since there was already an early bounce off the lower Vol window, there was not another one and sellers expanded the market lower, forcing longs to liquidate into the close.
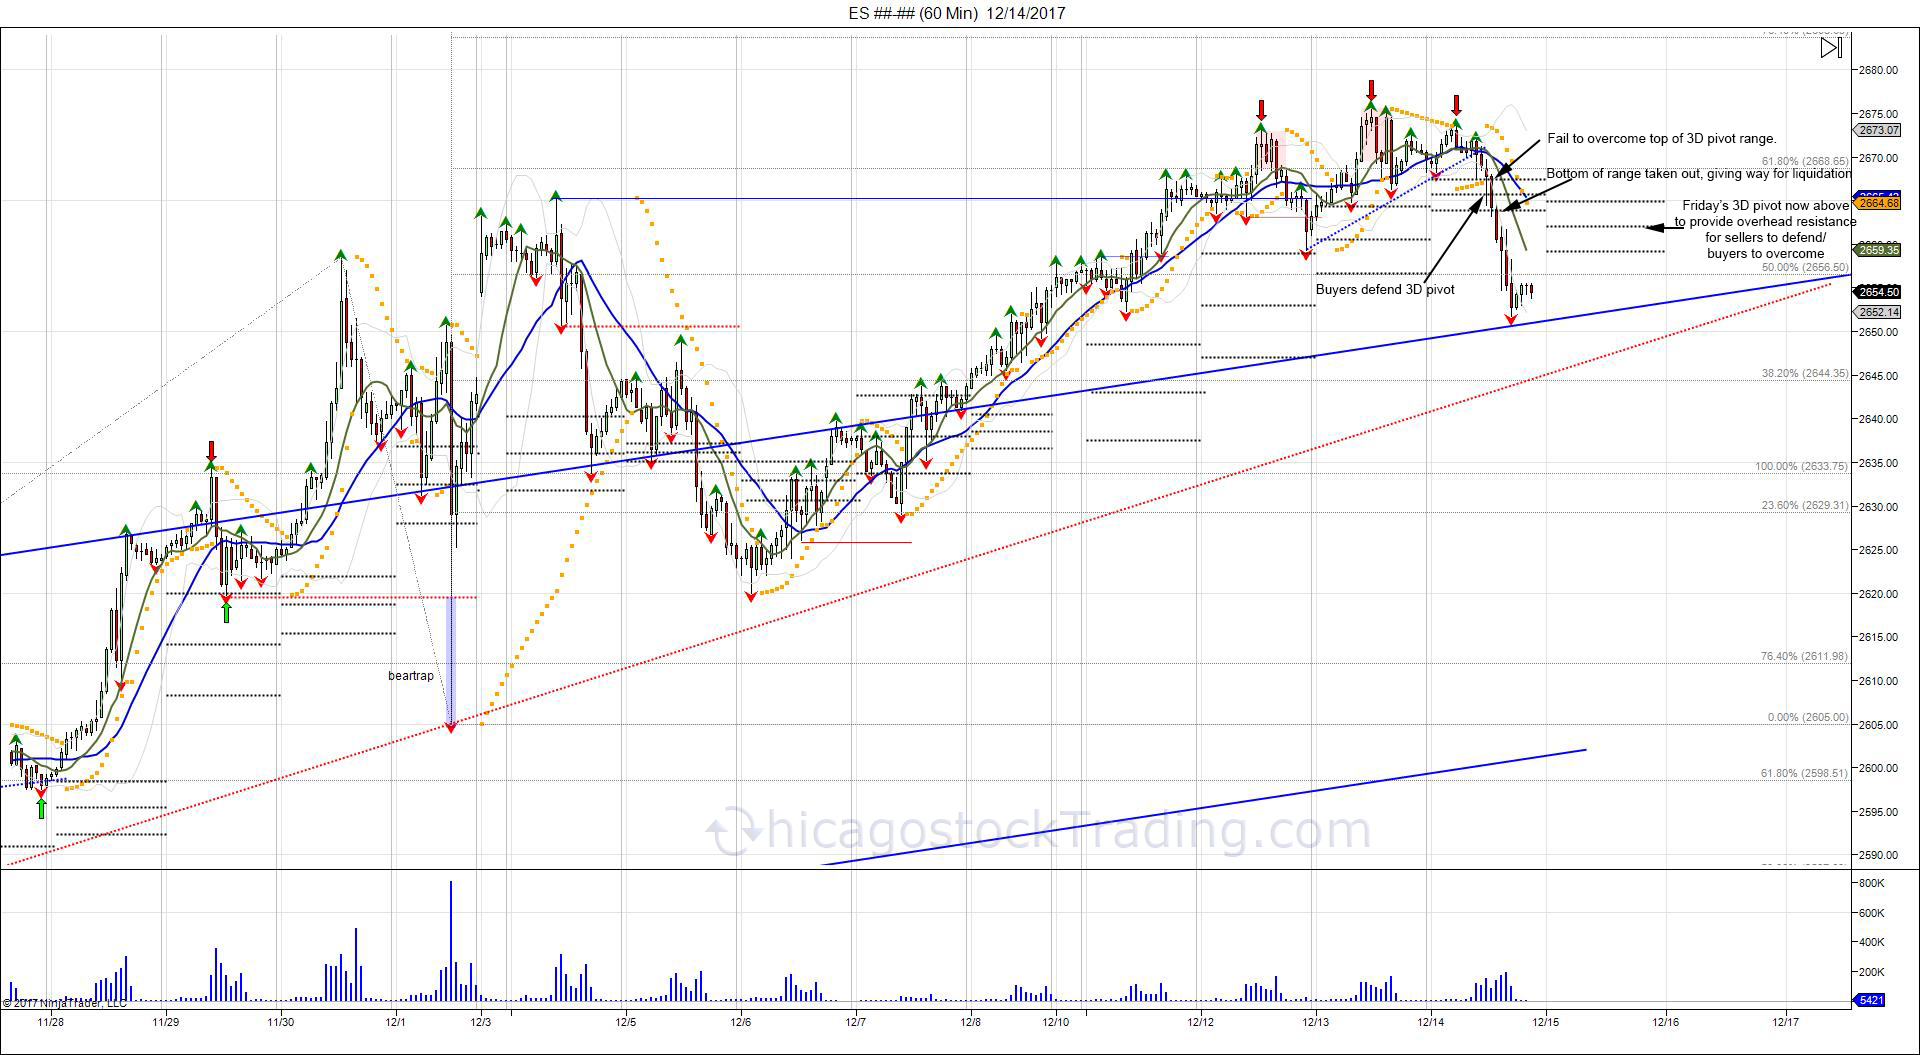
Though the lower Vol window was taken out on Thursday to establish a bearish bias, sellers needed to work through the 3 day pivot range which carries more weight as this is based off a rolling 3 day range. When the range is below the market, it provides an area for buyers to defend, and sellers to work through. Failure to hold the pivots, as seen on Thursday, gives way to see liquidation. With Thursday's break of the 3 day pivot range, this has converted Friday's 3 day pivot range to being back above the market within 2659-2665 to provide overhead resistance for sellers to defend and buyers to overcome. Buyers will need to work through sellers and close above 2665 in order to trap shorts and get another shot at the ATHs. Failure to do so and a close under the 3 day pivot range, gives way to reverse short term momentum into a negative.
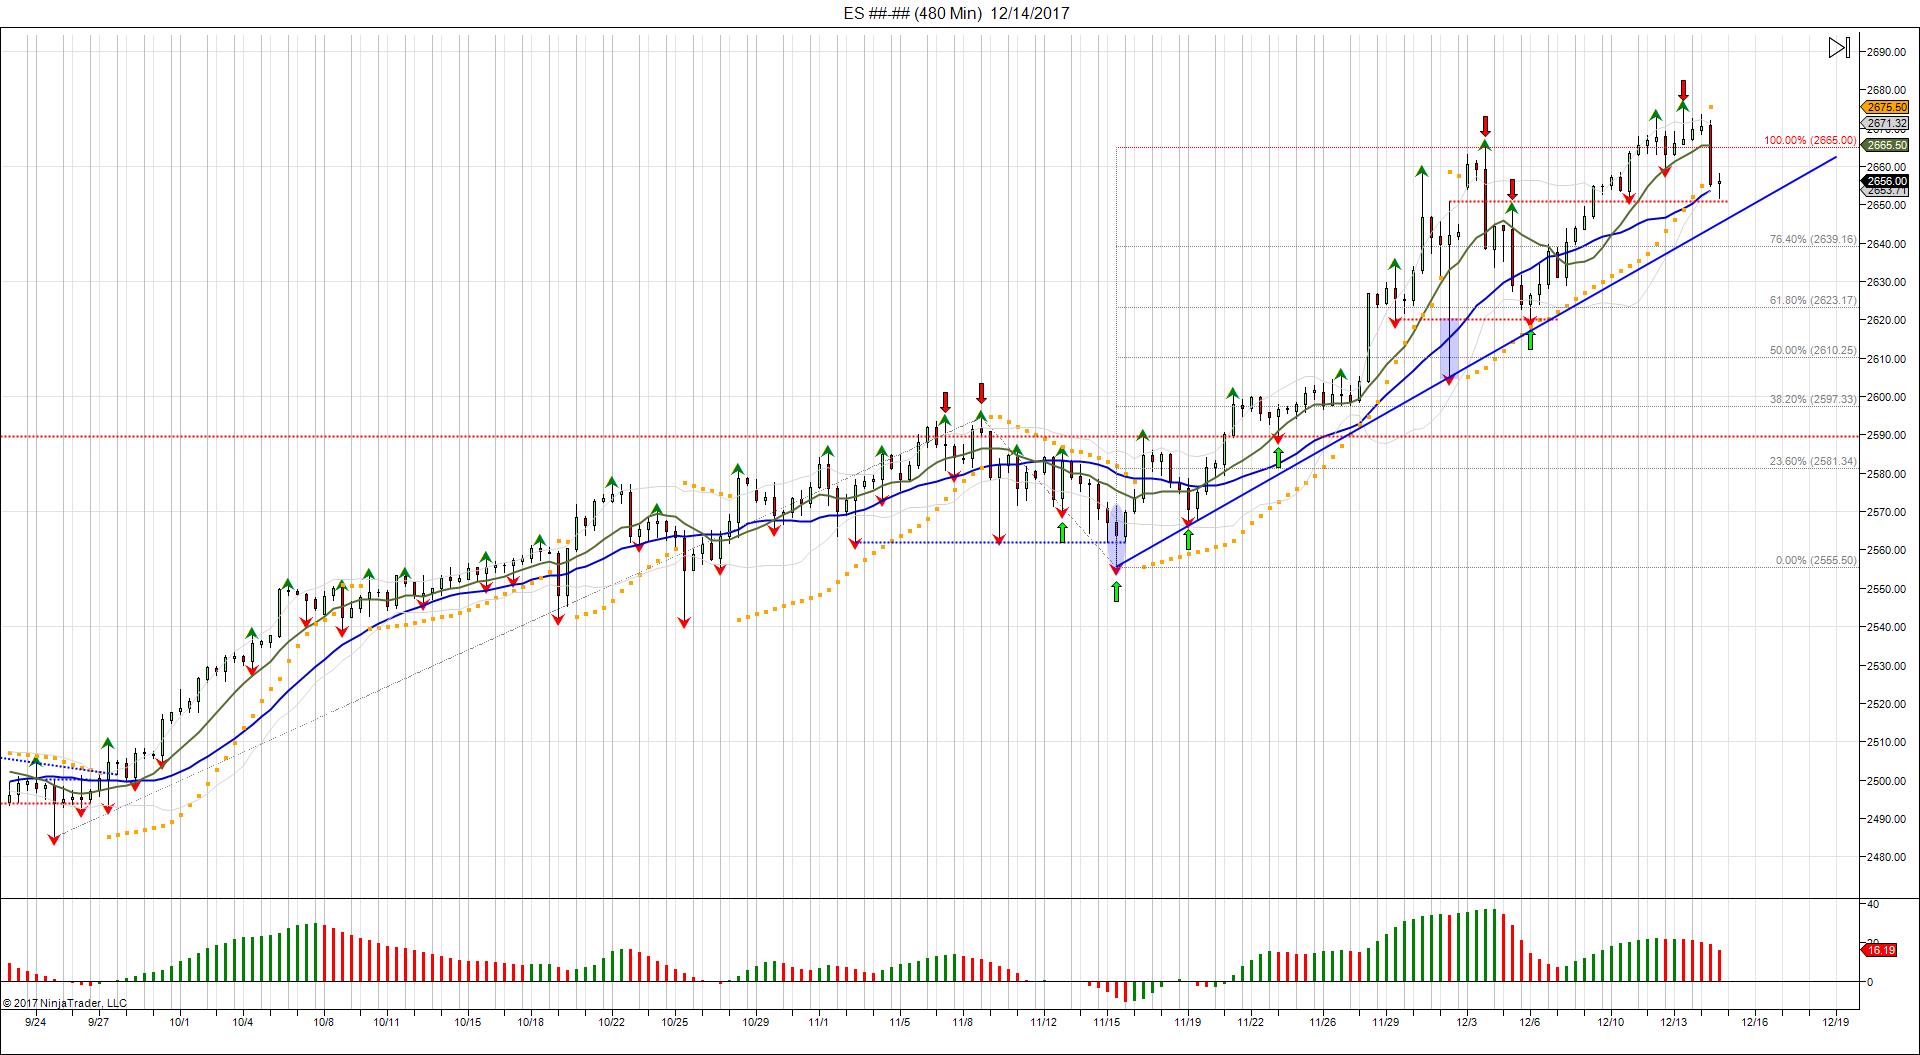
The market still having trouble overcoming its 100% fib extension of 2665. On Wednesday the market printed a higher high of 267550, however was rejected on Thursday with a move back under 2665 and a settle of 2656. This converts 2665 into resistance again for sellers to defend and buyers to overcome. Buyers will need to overcome sellers at this level to squeeze shorts over 2672 for another shot at ATHs to run over sellers. Failure to do so, gives way to test the rising trend channel for a shot at last Wednesday's 2620 low. Any break of last Wednesday's 2620 low without making a new high, would confirm a failed breakout and a double top.
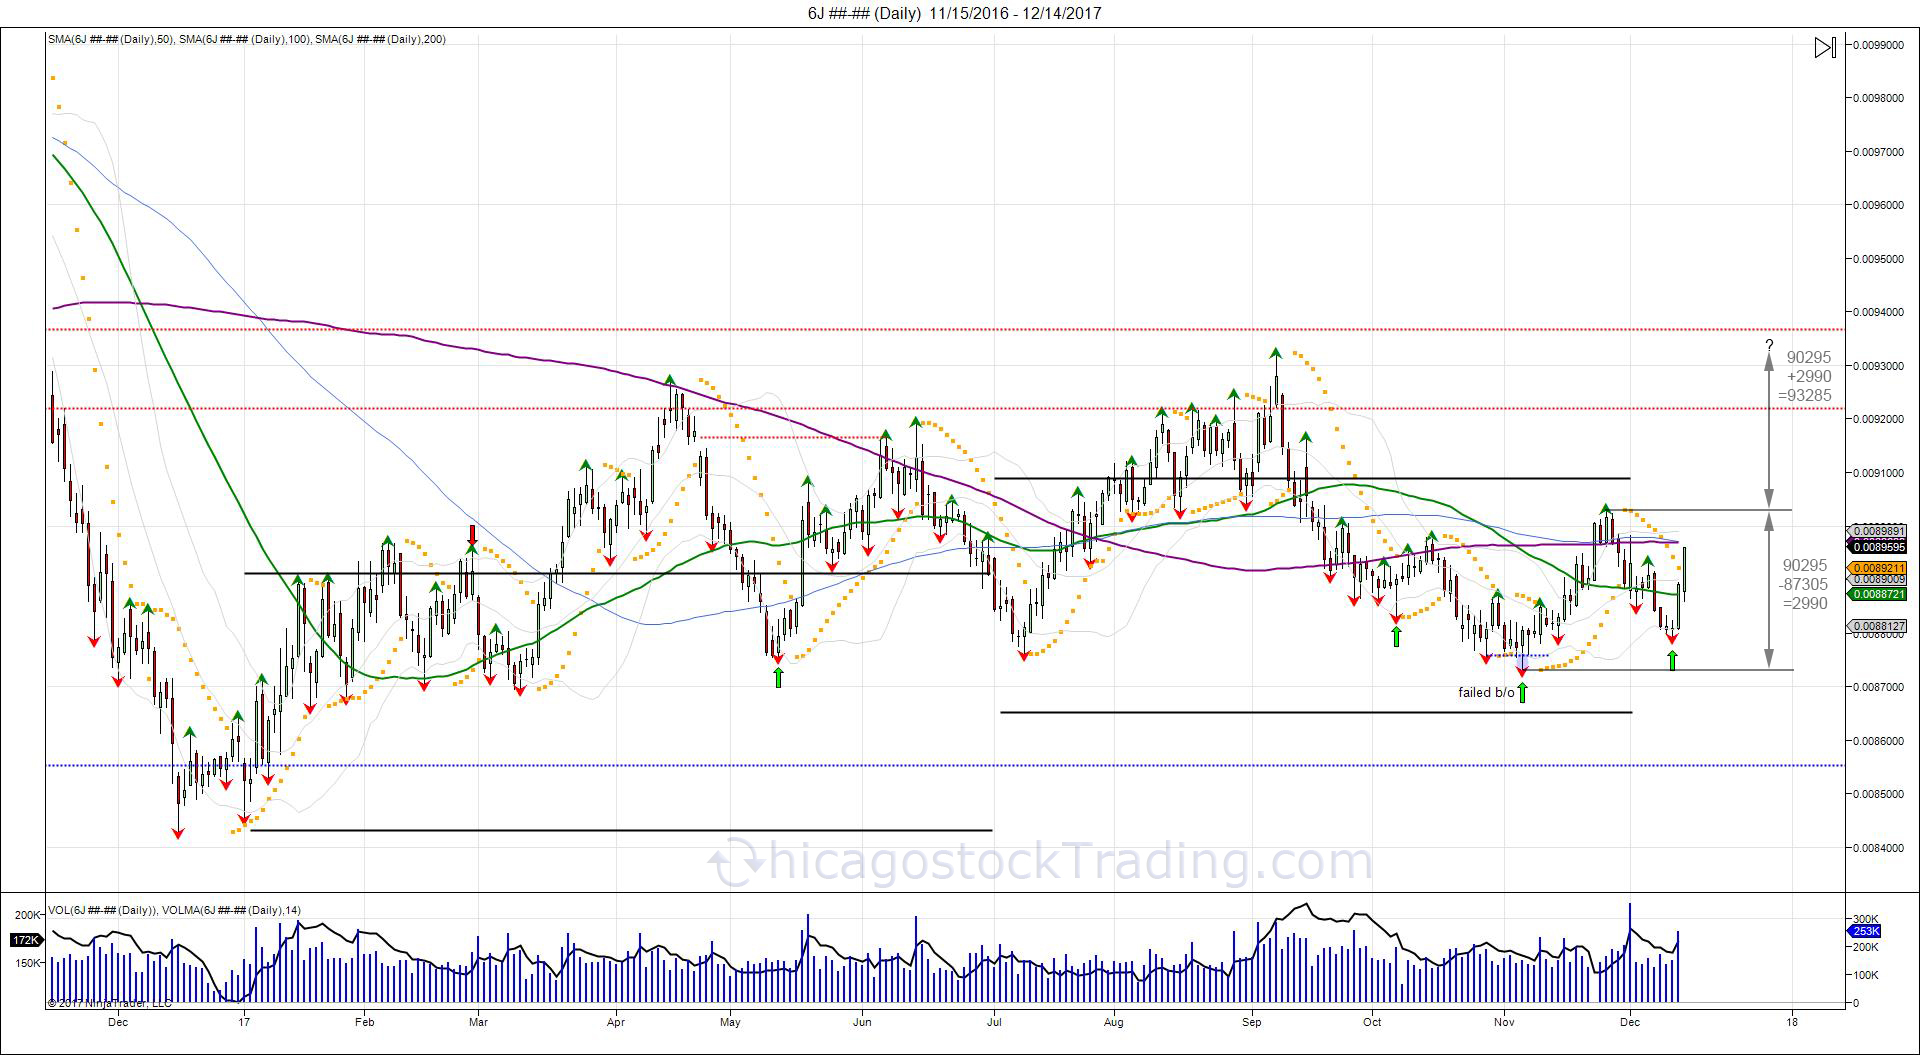
The Japanese Yen, successfully tested and held its November low (which was a failed breakdown aka headfake), in turn creating a right shoulder for an inverted head/shoulder bottoming pattern. Going forward, a move through the neckline of 90295, gives room to expand the range up toward 93285. Doing so, is not bullish for equities.
You can sign up to receive daily volatility windows and pivots here.

