Since the financial crisis in 2009, the Federal Reserve worked overtime to prime the market with quantitative easing and low interest rates. The punch bowl was spiked until the music suddenly stopped in February. Now that the music is off, people are waking up to the fact that the emperor has no cloths. After a series of hiking rates last year, the Fed cut rates back to zero, and now doing daily $1 trillion dollar repo operations in an attempt to support the market's. So far it’s not working, and it will not.
You see when the market bottomed in March of 2009 at 666 and after measures taken to stimulate the economy, the Fed never took their foot off the gas. This is told by looking at the open gaps that have been left behind. Every attempt to correct, was followed with a higher open that never looked back. This not only left short sellers on the hook, but forced buyers to chase the market higher. For bulls, this was no problem, every dip was bought and the overall direction of the market was higher. The problem with this is that rather than letting the market digest its gains and consolidate before seeking its next move, the upside squeeze was forced and continued through the Fed’s easy money policy.
Needless to say, the actions of the Fed did help the market recover from the financial crisis, providing liquidity in getting the market back on its feet. The market recovered from its 666 to a high of 1468 in 2012. In December of 2012 the Fed attached a 6.5% unemployment target to raise interest rates. The gold market was "spooked", losing 1500 and beginning its correction lower. The stock market took off in January of 2015. The market opened higher in January and never looked back. This led to a rally into 2000 in 2014. The NFP target of 6.5% for the Fed to begin raising rates was reached. Did the Fed begin raising rates? No. They pulled it and said the target was outdated. During the period of 2014 up into the election of 2016 the market attempted to digest its gains and correct, however every pullback into 1800 was met with central banks throwing stimulus at the market. Why? In 2014 the ECB imposed negative interest rates. In October of 2014 the Bank of Japan surprised the markets with $700 billion in stimulus. In December of 2015 the BOJ repeated this action, surprising the markets with more stimuli. Why did we need all this aggressive action by the central banks when the markets had not only recovered into all-time highs and jobs numbers were improving?
The action by the central banks during 2014 into the 2016 election, did not allow the market opportunity to correct in search for support. In other words, there was no price discovery in the “market”. If there was no price discovery, was it even a market? By not doing so, this did not give buyers a chance to get in at lower prices. Who cares right? If the market continued higher, no matter where you bought the market you were making money over the long run. Well this created the bubble that were seeing pop today. The election of Trump in 2016 was followed by aggressive policies that gave businesses opportunity to thrive. Manufacturing jobs which were dubbed as gone were beginning to return, cutting regulations, and pro market policies led the market to expand away from 2000 into highs of 2878 in January of 2018 after Trump’s first year in office.
What the central banks did during 2014-2016 by holding the market and not allowing for a correction, gave way for the bubble to be created as the market expanded away after the election. The market attempted to correct in 2018 after peaking at 2878 in January, falling to a low of 2316 in December. Volatility returned and buyers that chased the market in 2018 were either shaken out, or took pain as they saw the market go against them. Worried traders and investors began to get bearish. This turned into a massive trap as the markets put in a V bottom in January of 2019 to set a bullish 6 month bias, expanding the market higher into new highs of 2969 in June of 2019. Squeezing short sellers and to the surprise of longs, seeing the market recover into new highs. Once again in the second half of 2019 the market attempted to correct, in August the market established a bearish bias that lured in short sellers, failing to see expansion in October. As the market attempted to correct, what did the Fed do? Did they allow the market to discover price? Allow it to function normally? Whether it was to correct or not? No. The Fed announced plans to expand the balance sheet and insisted it was not QE. On November 1st I asked a question, was a short capitulation coming? I asked this because short sellers from August and October were caught on the wrong side with the market reversing its bear bias late October and those short sellers were fuel to expand the market higher. The market never looked back. Short sellers were forced to cover, expanding the market up to a high of 3245 in December.
So after the market attempted to correct in 2018, longs were given a scare, but were saved in 2019. If they saw stocks go against them, they were given a second chance to get out. You know the saying, bulls make money, bears make money, and hogs get slaughtered? Well 2019 was a gift from the Fed to bulls to take their profits. What do you think happened? Did bulls say ok now it’s time to get defensive and take profits? Absolutely not. Bulls got greedy.
In an article from CNBC on January 19, it said:
“Investors with $1 million or more in brokerage account are significantly more bullish than they were a quarter ago”
In the article, it states hedge fund billionaire David Tepper saying “I love riding a horse that’s running.” Later in the article he is quoted saying “the market will get to a level that I will slow down that horse and eventually get off.”
You think the market slowed down to give him an opportunity to get off? Anyone riding that horse got violently thrown off in March.
After shorts fueled the rally in 2019, the market was setup on the highs to start the year of 2020. I shared our volatility windows we use to indicate bull and bear levels and 3361 was the upper window. The market needed to hold above it for 6 days to establish a bullish 6 month bias and doing so would not only lure in late buyers, but force them to defend pullbacks. As I stated in the article, volatility windows can be used to trap late buyers and sellers. Once the bull bias was established, buyers got lured in and they were forced to defend pullbacks. On February 24th, the market fell into its reversal window at 3225 which was key level for buyers to defend to sustain the bull bias. By losing this level the following day, the market trapped buyers on the year and this has accelerated the move on the downside because shorts were sidelined and the boat was tilted leaning on the long side. When everyone is caught on the opposite side of the market, this provides opportunity and fuel to expand the market into the opposite direction. Not only did the market fall back under the November short squeeze at 3000, but it has fallen below the December 2018 low of 2316, reversing all the gains last year, just like that. Now with short sellers out of the way and the market trapping buyers in January and February were back to retesting levels from 2018 when the market originally tried to correct. Anyone still holding stocks is now forced with a dilemma. Do they take the loss, or hold in hopes of the market coming back? This is what getting married to stocks looks like. They are now married to their positions, and their thesis is, it’s a long term investment. That may be so, but who knows when the market will return back to the prices set earlier in the year.
For the market to bounce, buyers need to be fearful. You cannot expect the market to put in a bottom if buyers that got caught at higher prices are still cocky in thinking averaging down will play out in the long run. The long run may be much longer and what is the point of getting into an investment if one is not flexible in getting out and trying to get back in at lower prices? Its greed and it’s becoming attached to a position. Many don’t want to let go of their price average from accumulation over the years, thinking the market will never return back to those prices. The market bottoms when you are afraid to buy stocks.
So the market has lost all of its 2019 gains, and the Fed is throwing everything but the kitchen sink at the market. Cutting rates drastically back to zero, new quantitative easing measures, and none of it is working. The emperor has been revealed to be without cloths. They primed the market higher without allowing true price discovery, so now we will be getting that price discovery. The only thing left to fight deflation is to devalue the dollar. This is the last tool in the tool box for the Fed, the nuclear option.
See Ben Bernanke’s speech titled “Deflation: Making Sure “it” Doesn’t Happen Here.” In these remarks, there were 5 major points Mr. Bernanke pointed out as tools the Fed could use to fight deflation.
- Lower interest rates to zero
- Buy securities from banks to expand Feds balance sheet
- Increase money supply
- Buy our countries debt
- Devalue the US dollar
Source: https://www.federalreserve.gov/boarddocs/speeches/2002/20021121/default.htm
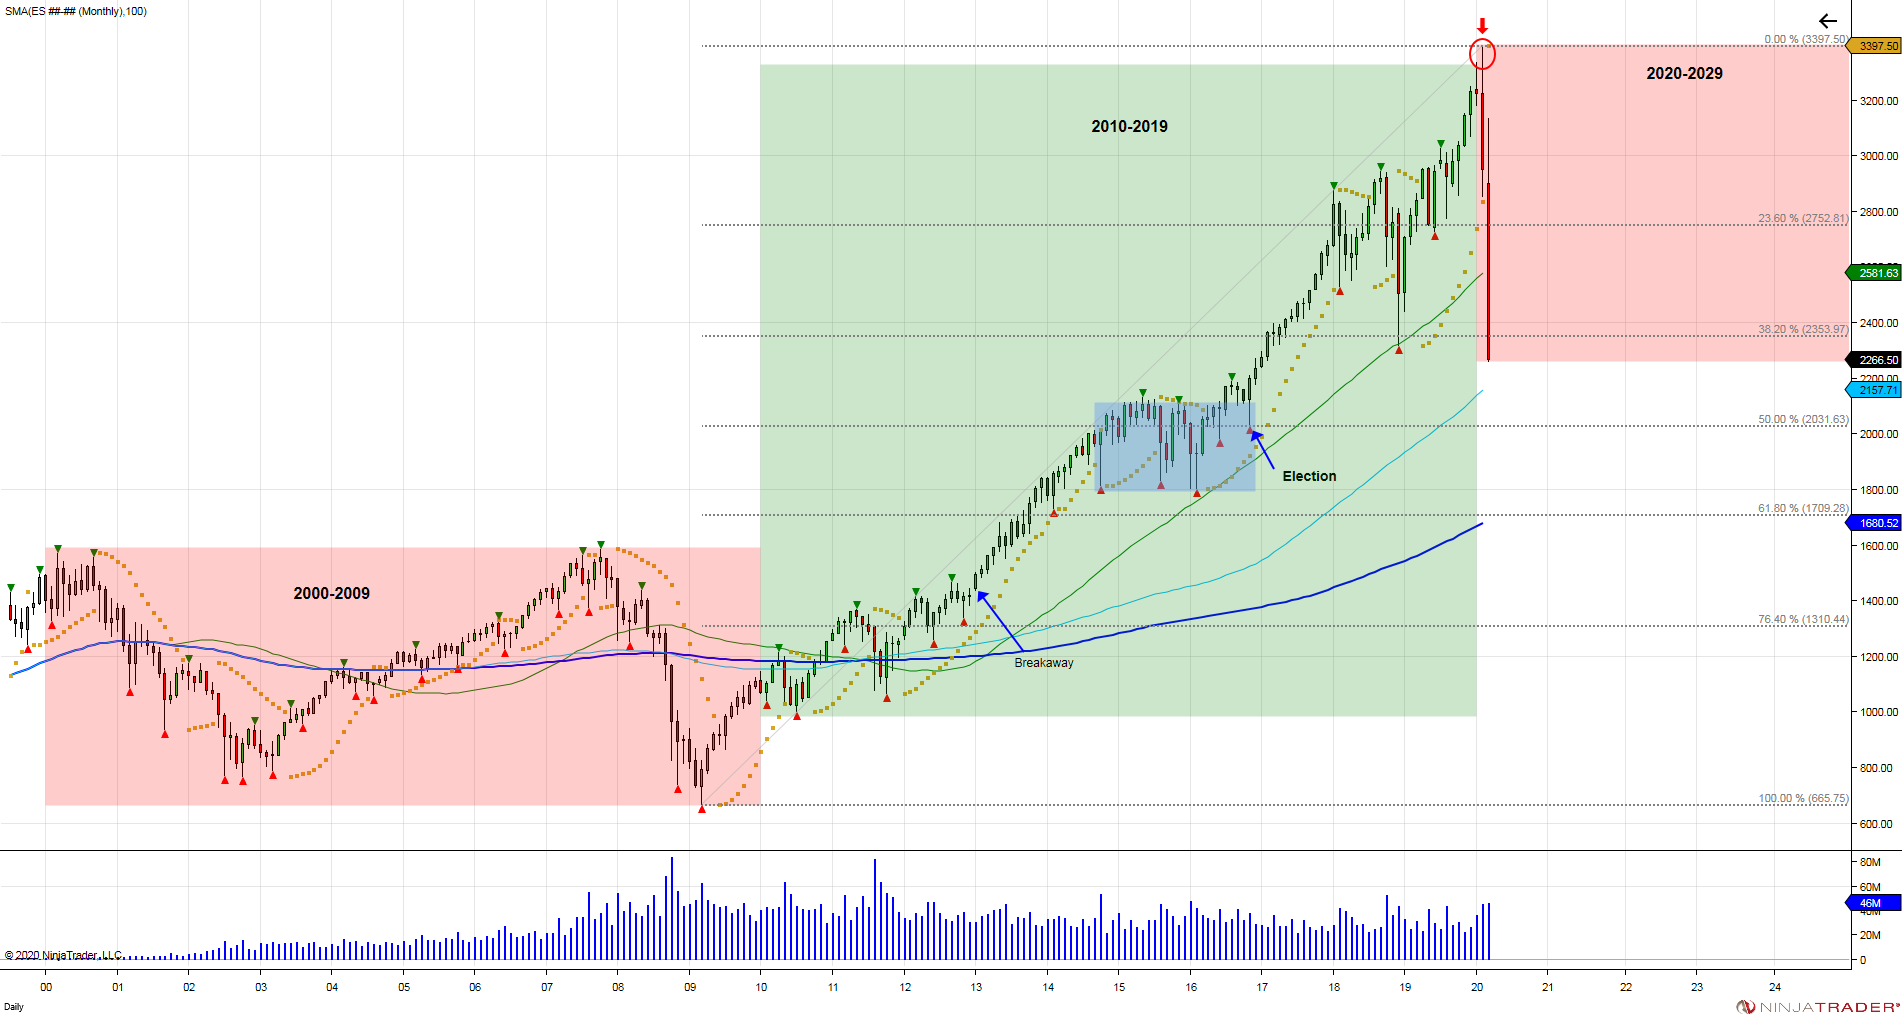
The market is now looking to do its repair work from the last 10 years it was not allowed to do so. Below we will highlight the open gaps as key reference points to the downside. First major level support test is seen down into 1900 which retests the 2016 low of 1802. Failure to hold this sees next major level into 1200 to retest the October 2011 lows of 1068, followed by 830-730 to retest the March 2009 low of 666. Obviously we do not want to see this happen, but retests are inevitable. It’s just a matter of time. Falling down to retest the low from March of 2009 would mean we are in a very ugly place in regards to our surroundings, jobs, economy, etc. All thanks to whom? The central banks, for not allowing the markets to function properly by retracing lower before moving higher, but forcing the market up on easy and cheap money. Kicking the can down the road, well we are finally at the end of that road and there is nowhere else to kick that can too. Any bounce back to 2800-3000 would be key resistance to retest the bull traps set this year. The supply caught above in the market is overhead weight and resistance that will need to be recovered by new buyers to recover and reverse.
Welcome to the new decade.
Corona Virus popped the bubble, but who blew that bubble in the first place? Had we not pumped this market with cheap money, we may not have reached such upside levels, but the velocity on the downside would not be as great nor the pain it has created.
The sun will come up. Each time the market was limit down last week, the sun was still up and the birds were still chirping. We’re going through a cleansing in the market and trying to return back to price discovery. It may be painful, but it is our medicine now to get better later. Every now and then this takes place, and those that play it smart benefit in the long run. Let the dust settle and you will find the opportunities you are looking for.
The loss of confidence in central banks may cause people to reconsider how they are structured.
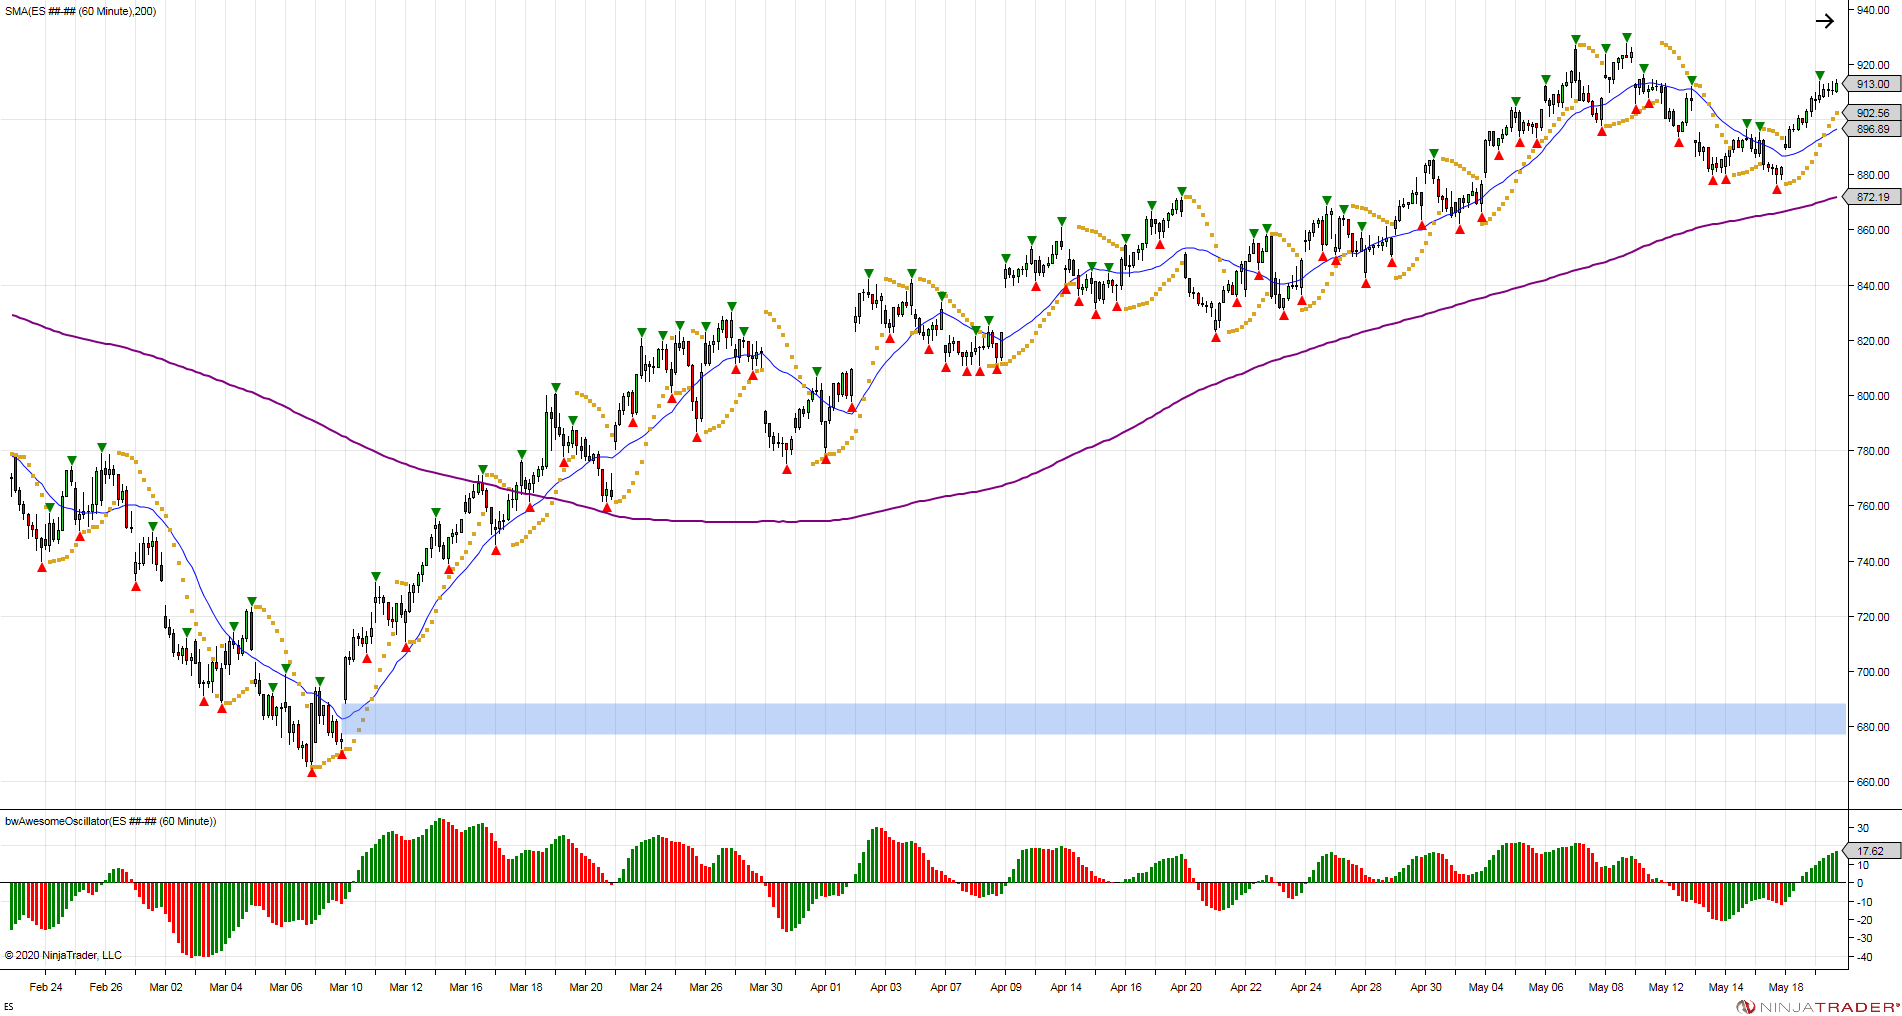
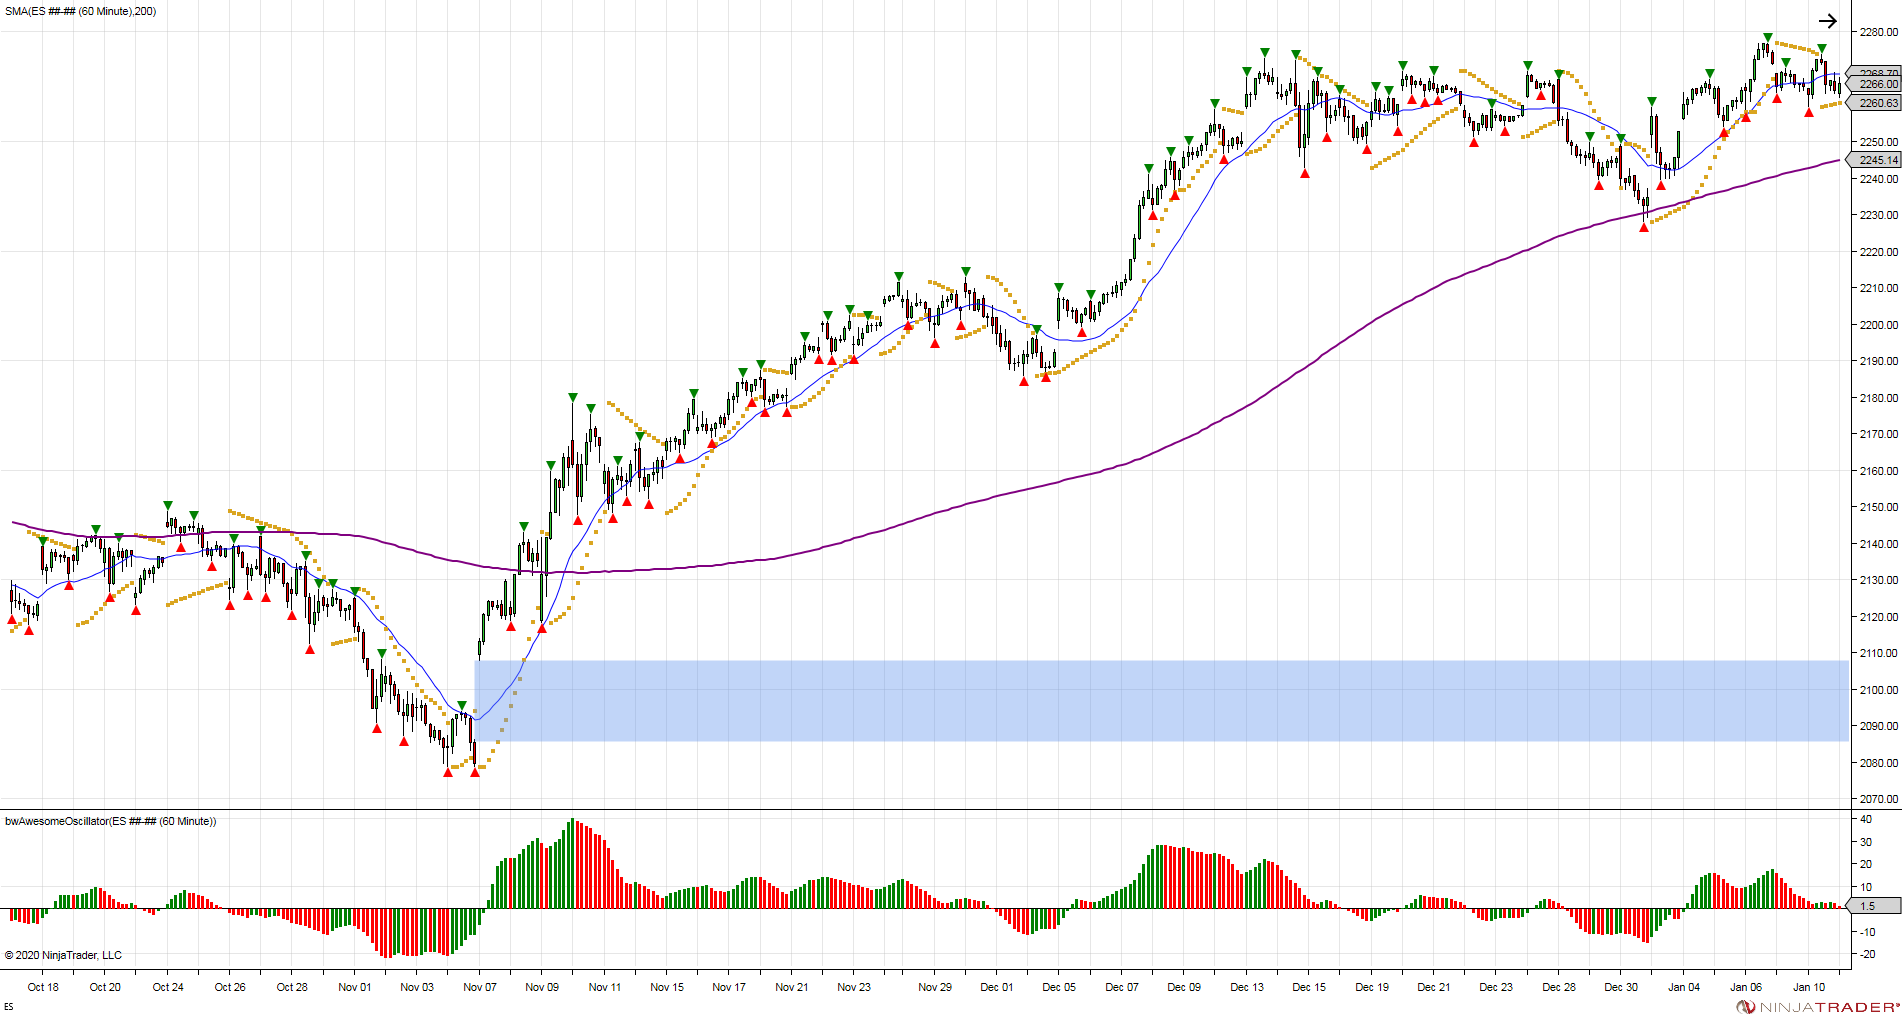
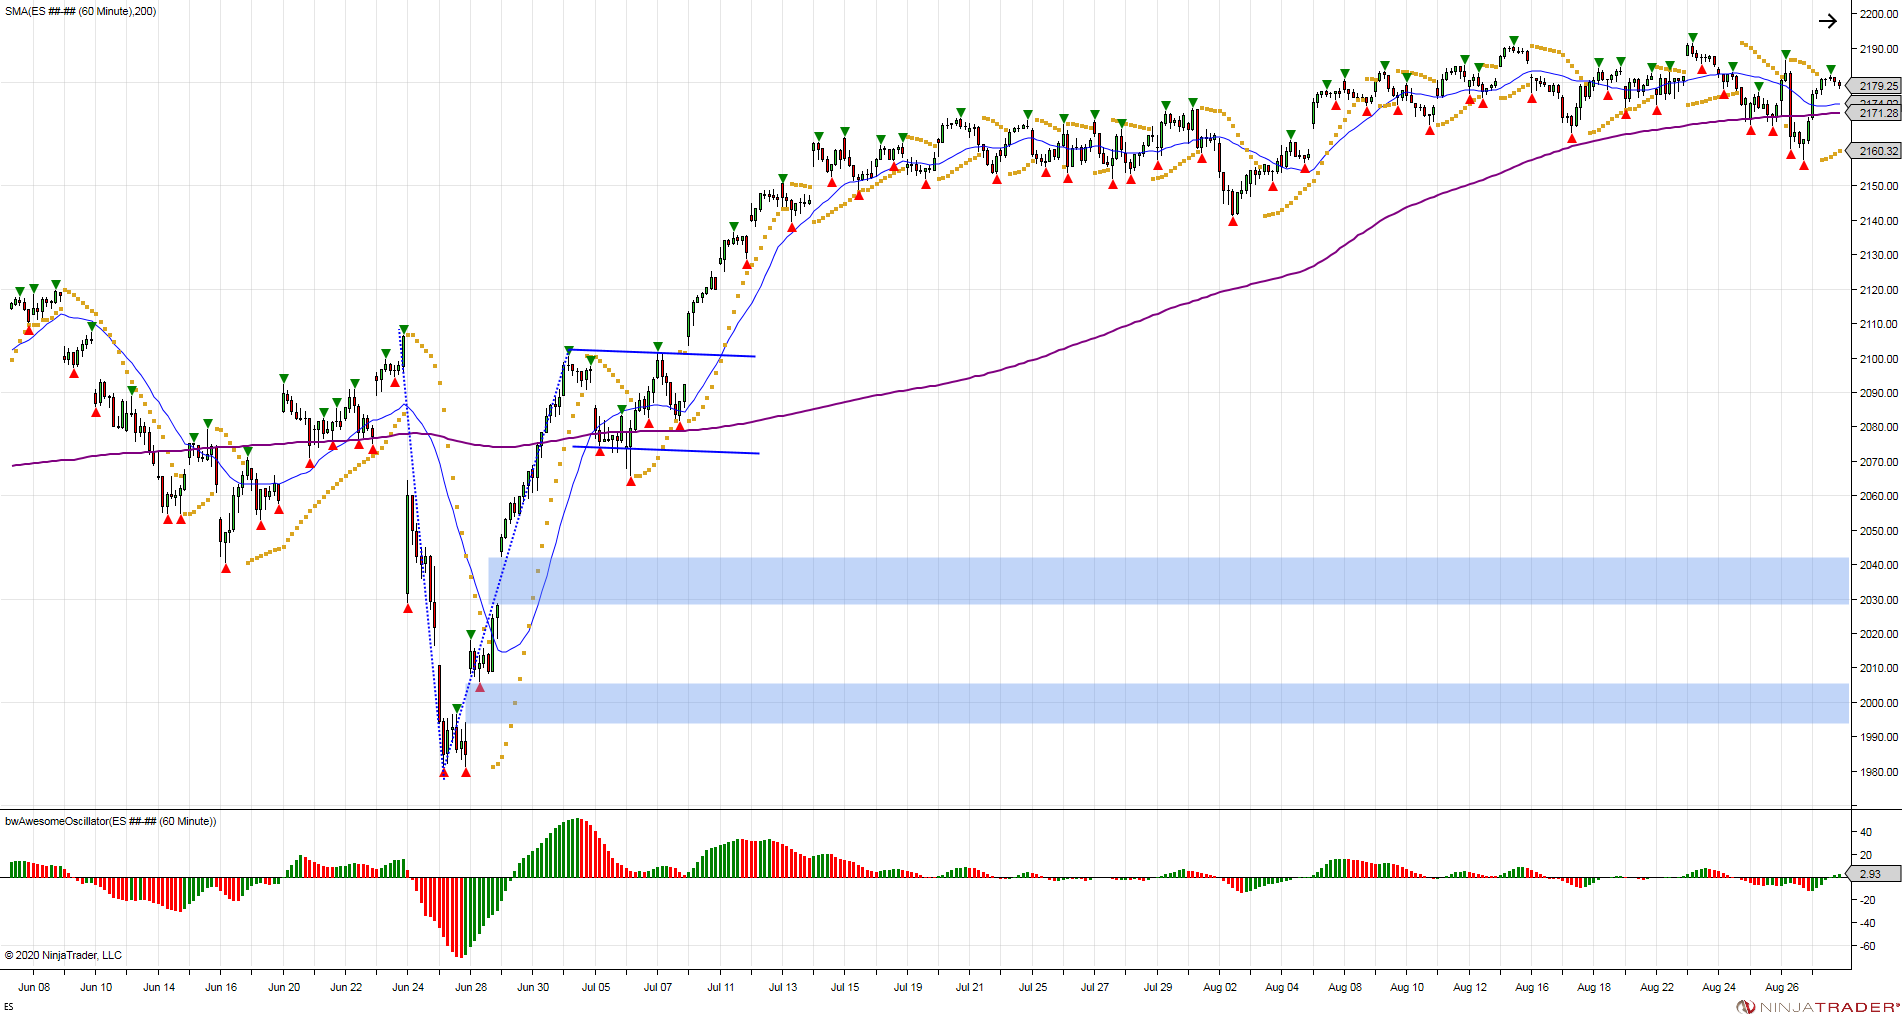
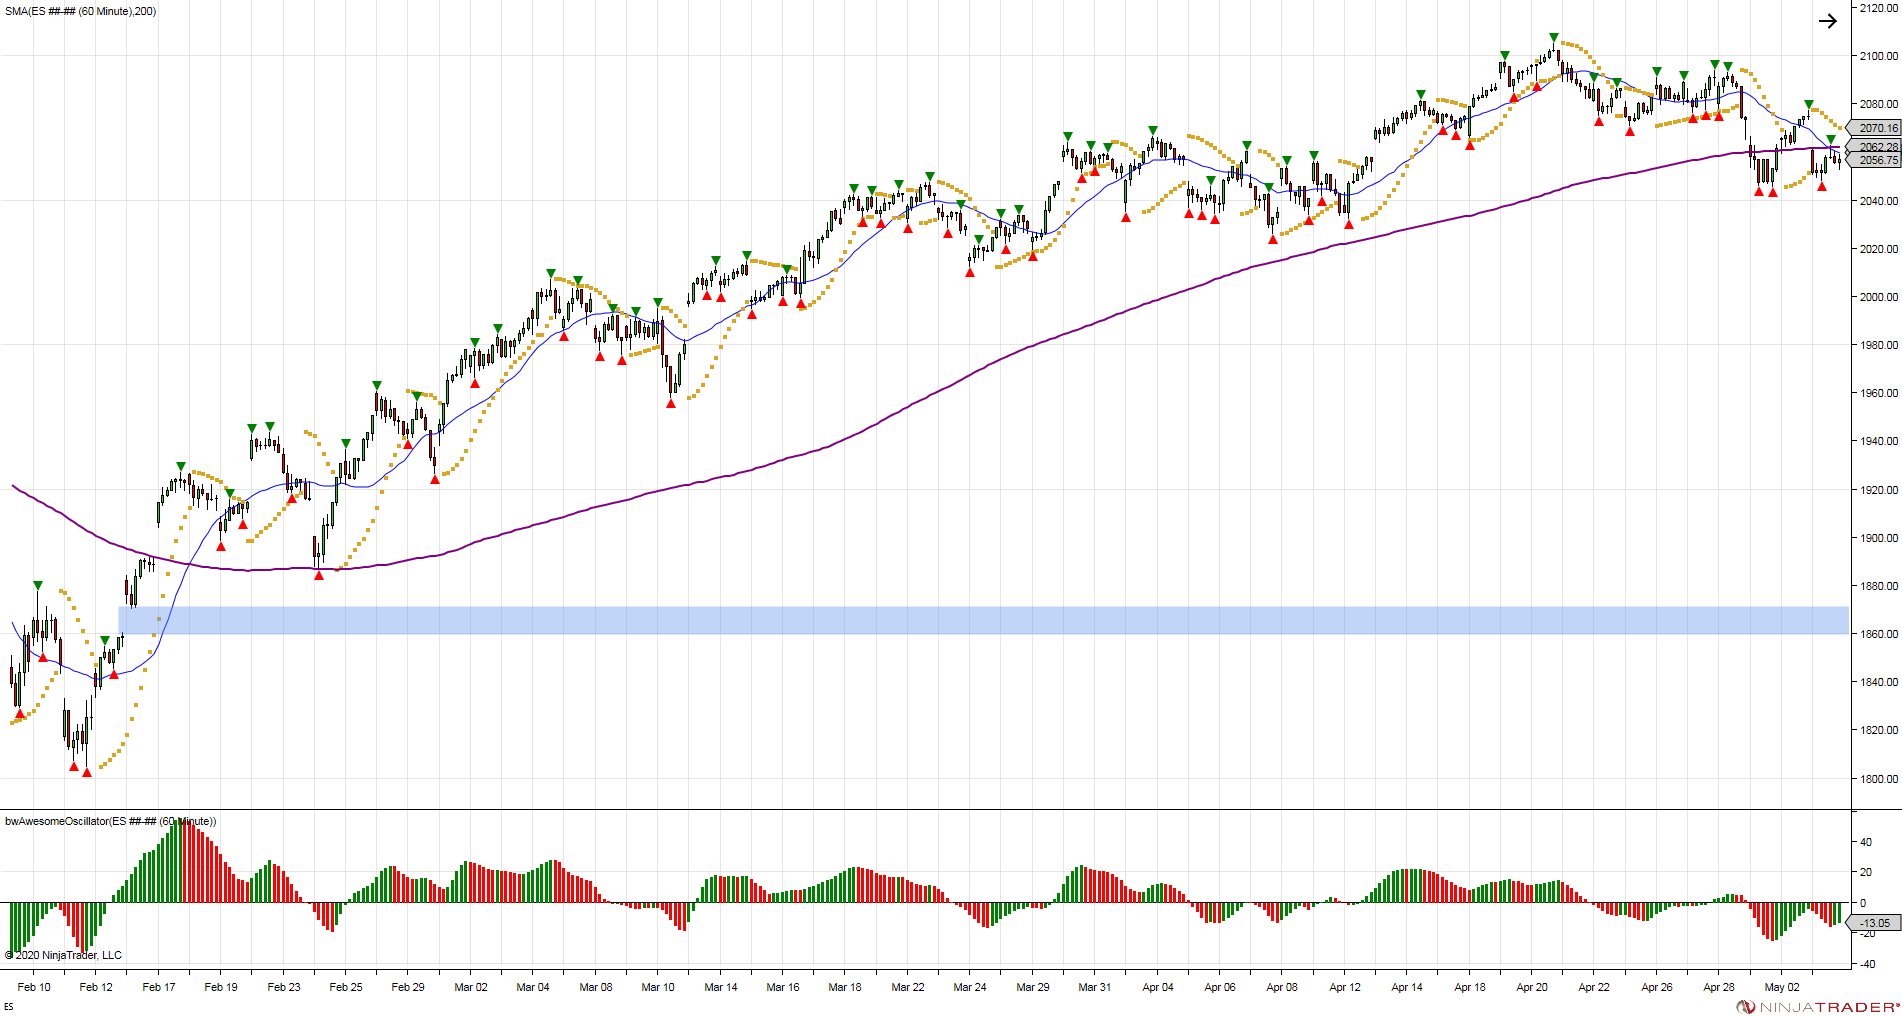
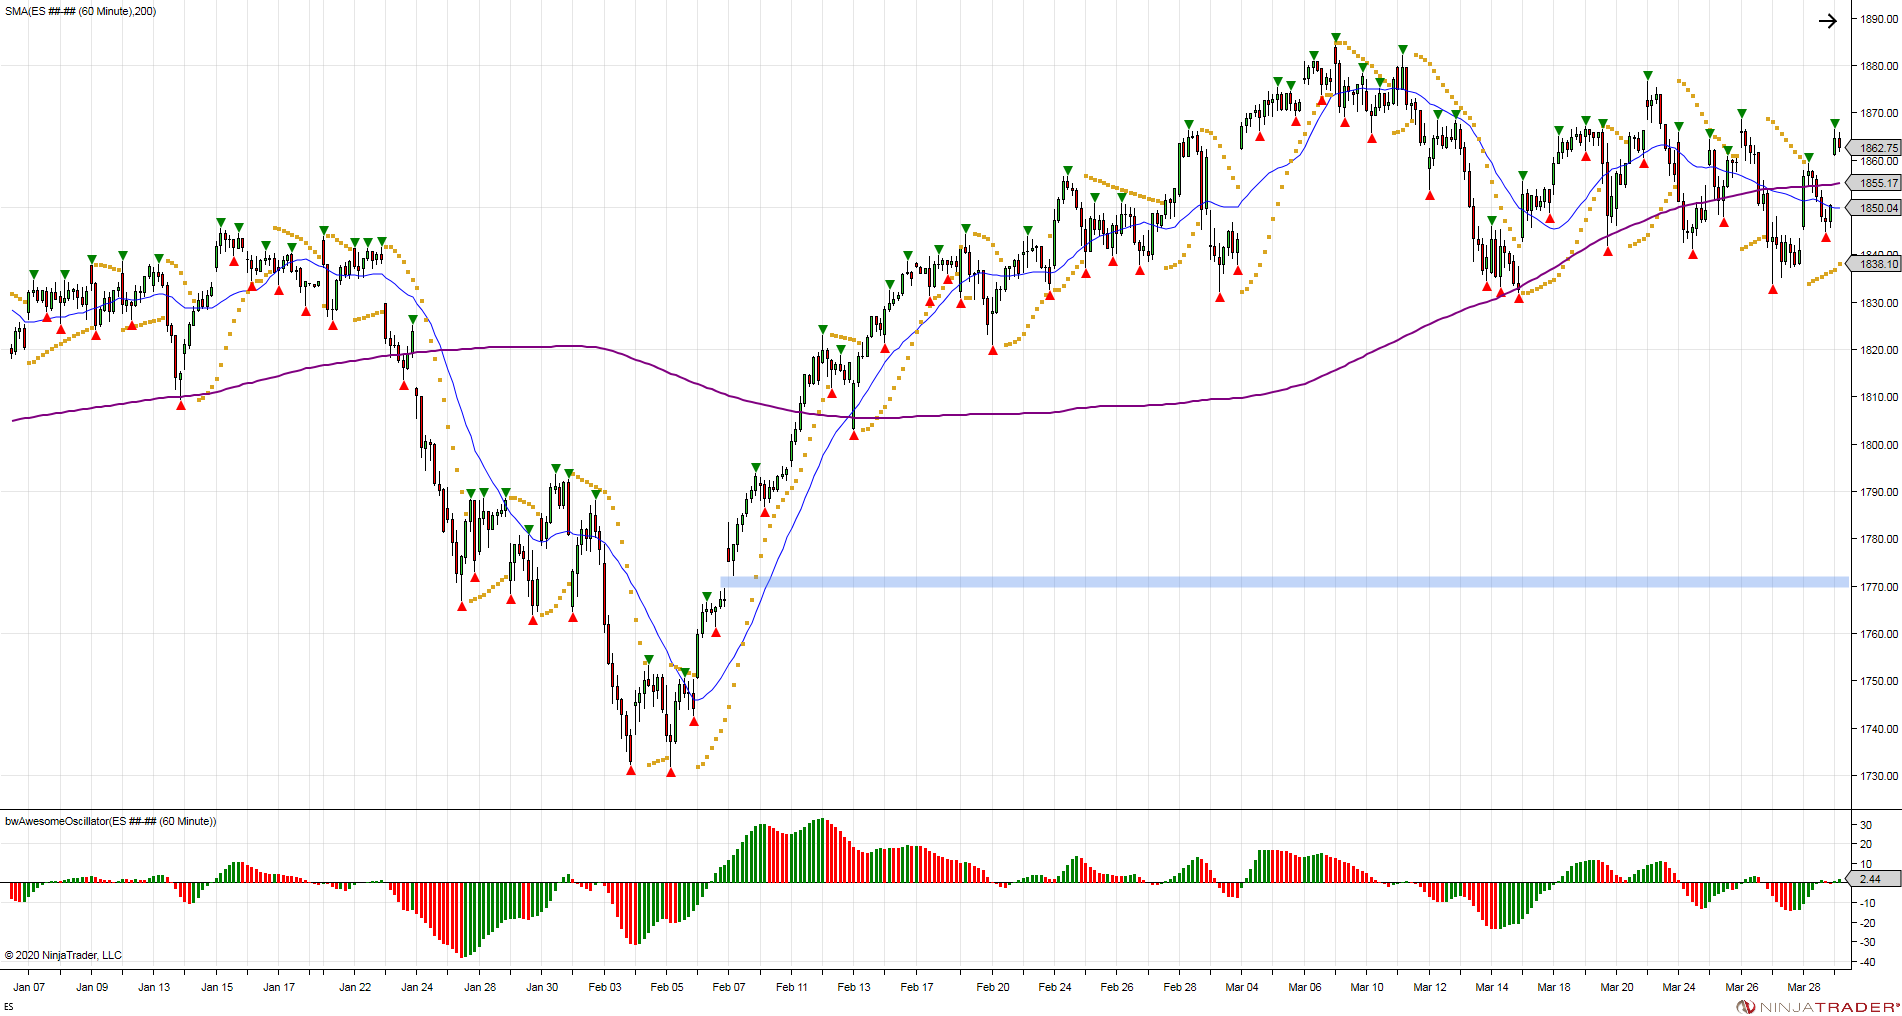
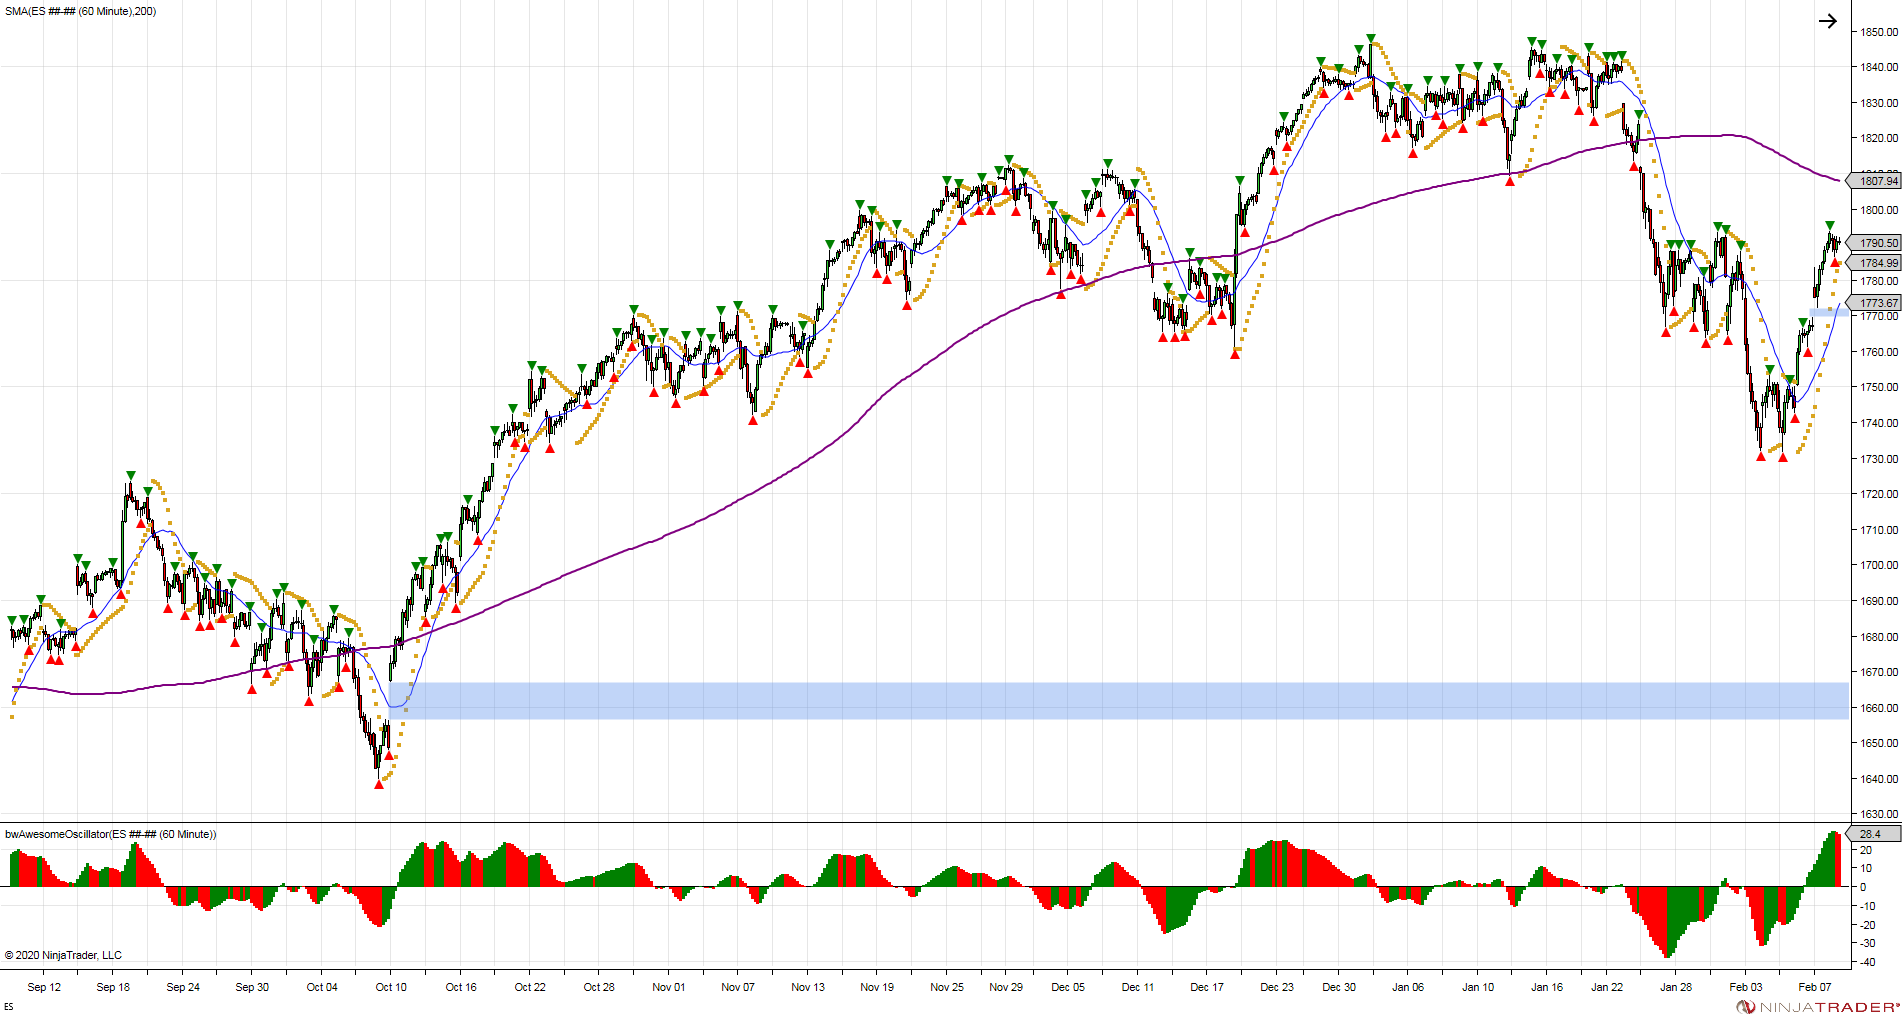
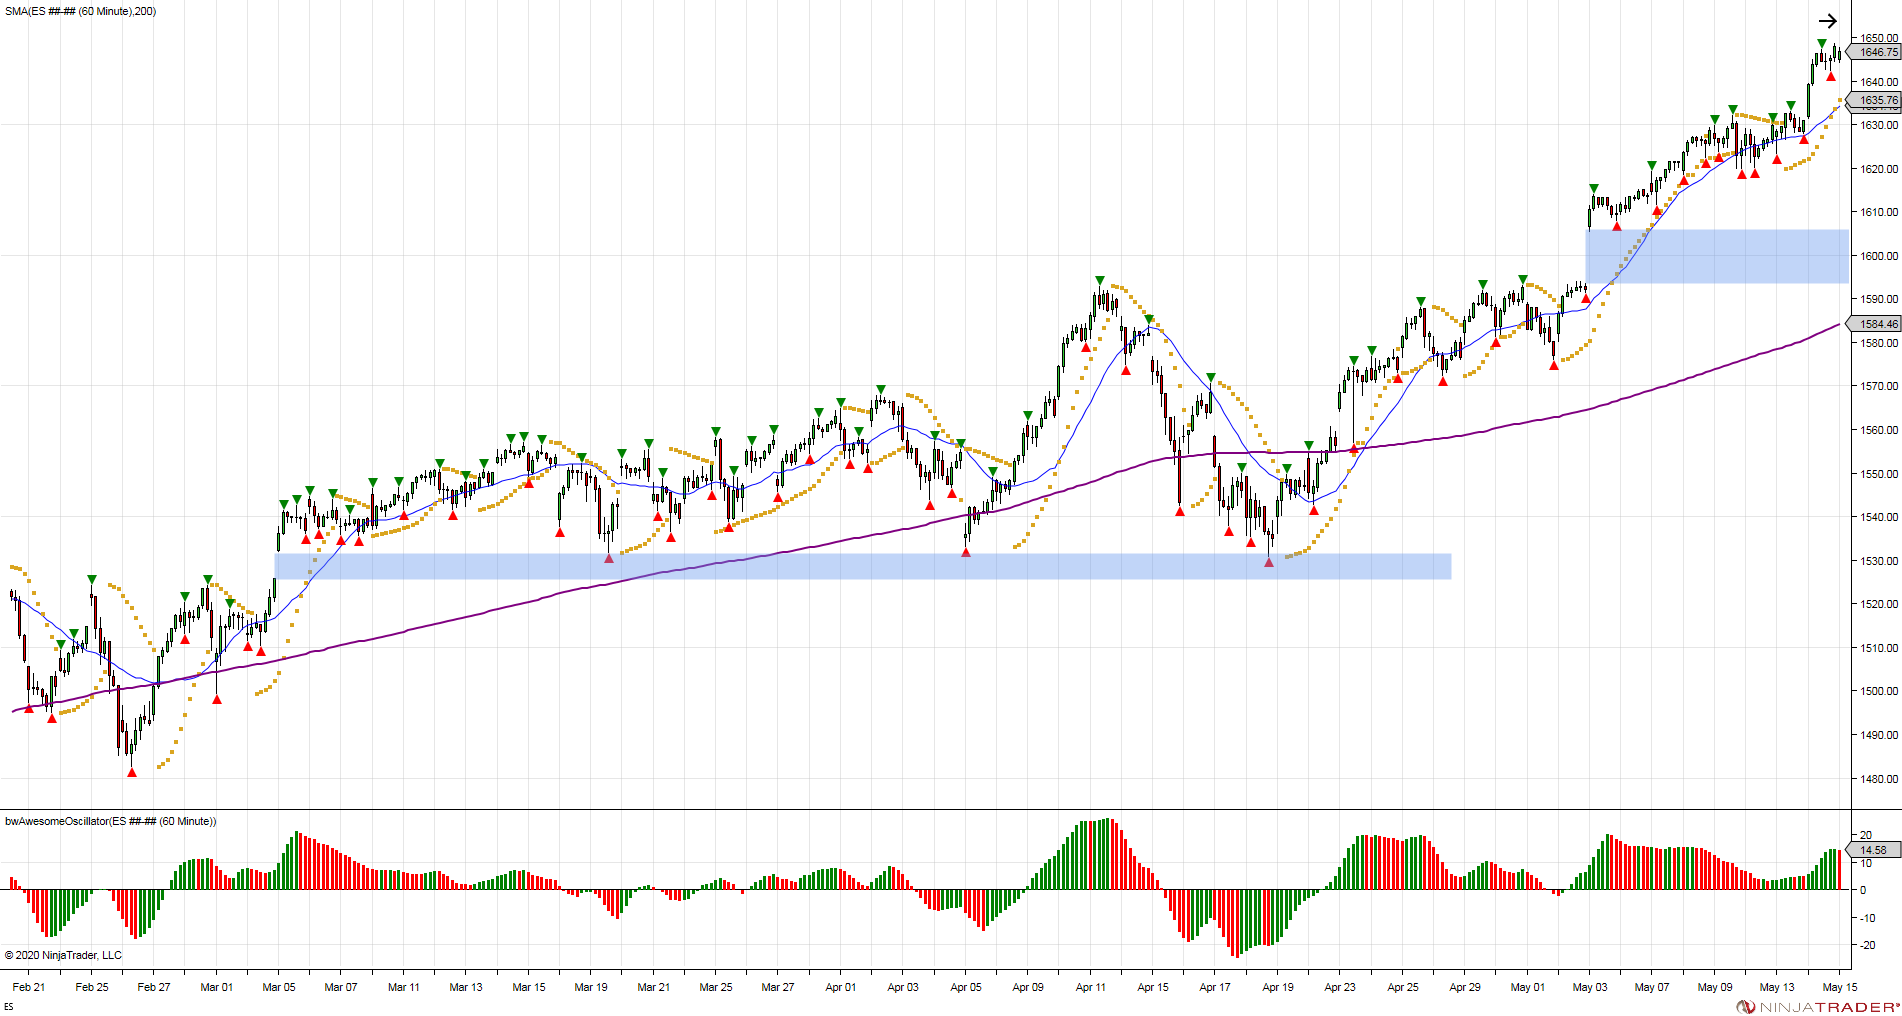
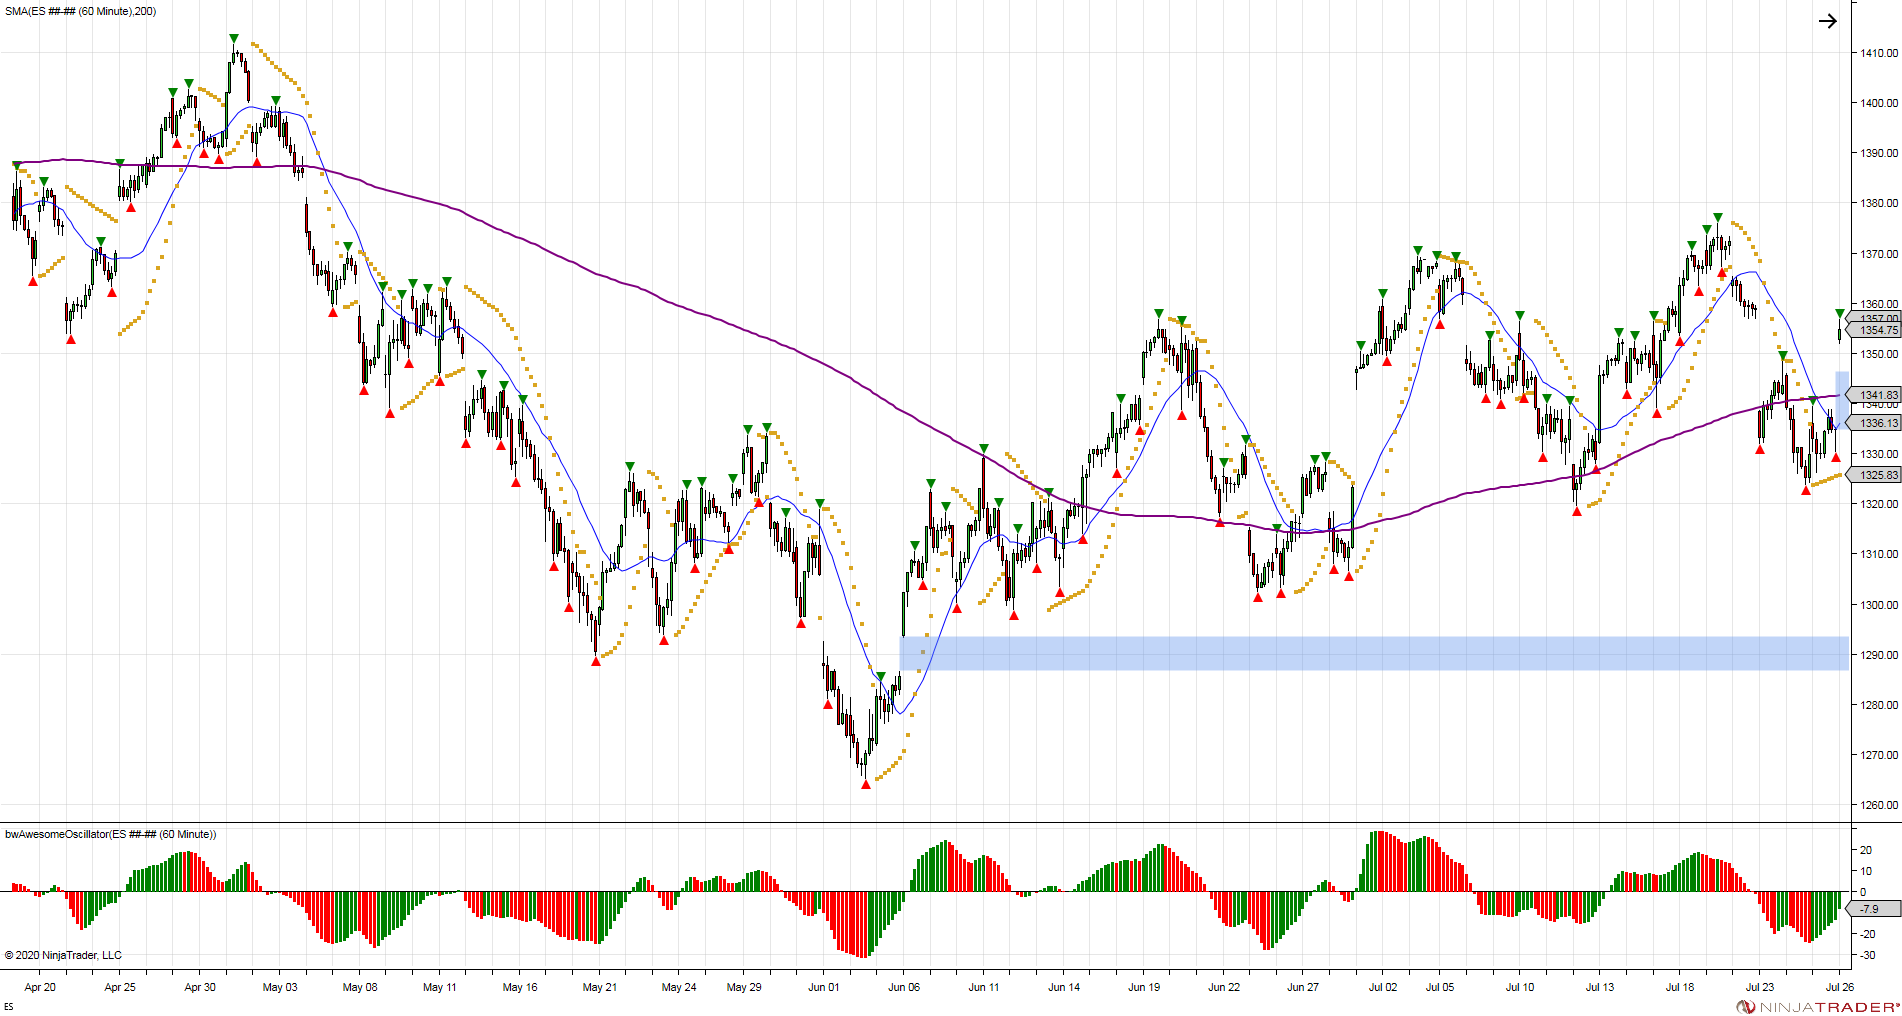
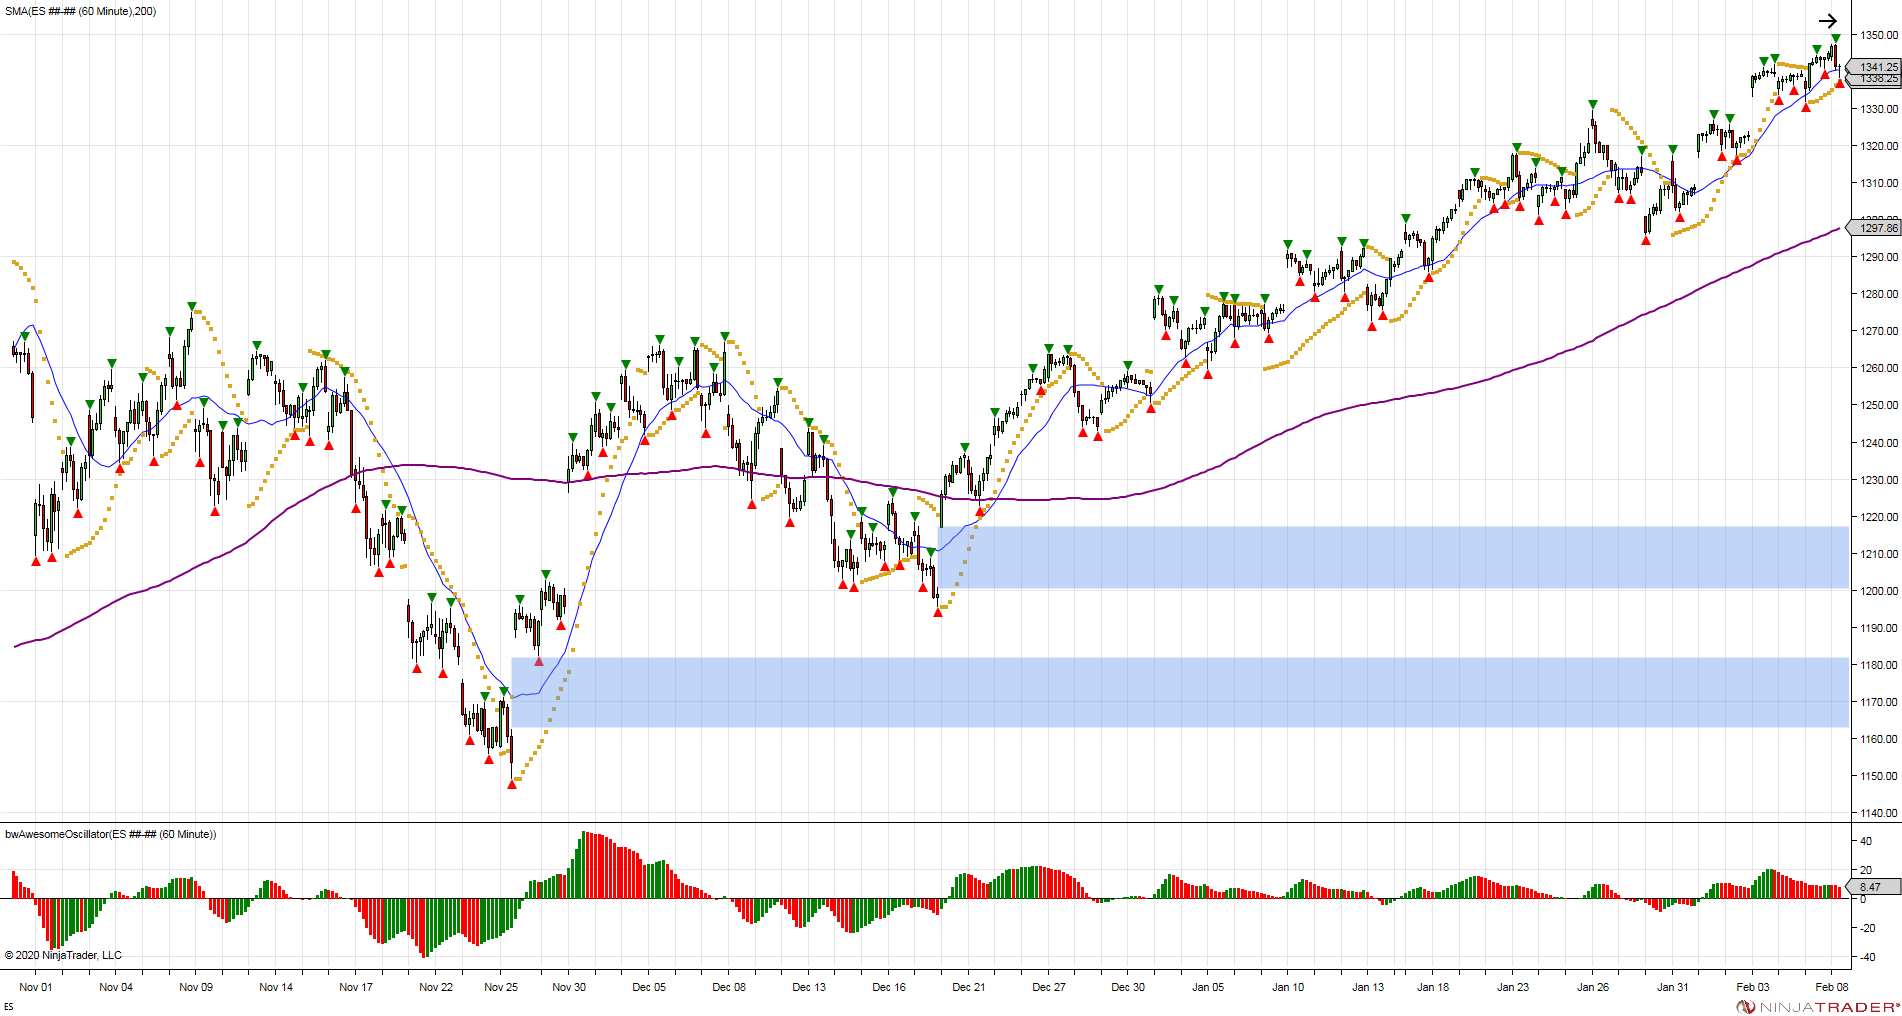
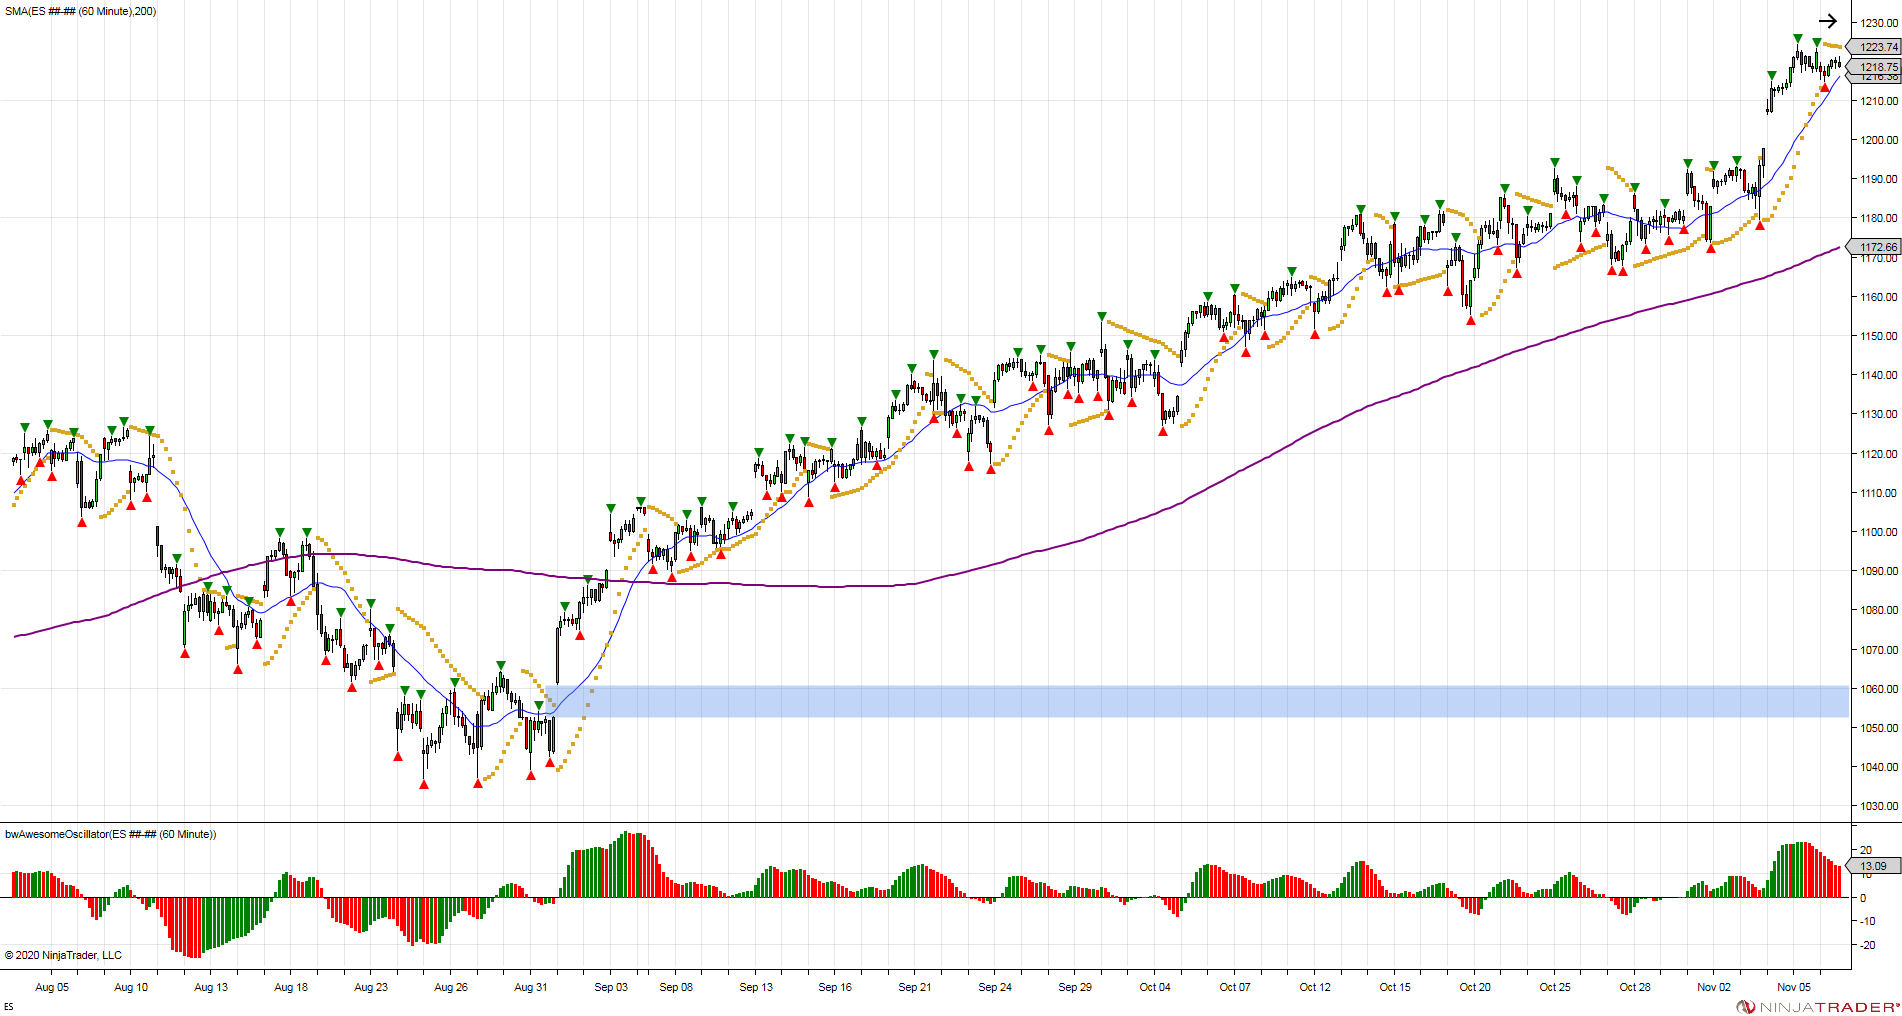
The following charts highlight the major downside gaps left open. Gaps are created when the market opens above or below its prior low or high. Fueled by easy and cheap money, the market did not fill these gaps during the time, forcing buyers to chase. These are key reference points for the “market”.
11/04/2016 Open Gap 2086.50
06/28/2016 Open Gap 2029
06/27/2016 Open Gap 1994.50
02/12/2016 Open Gap 1860.75
02/06/2014 Open Gap 1769.75
10/09/2013 Open Gap 1656.50
03/04/2013 Open Gap 1526
12/31/2012 Open Gap 1425.75
11/16/2012 Open Gap 1360.50
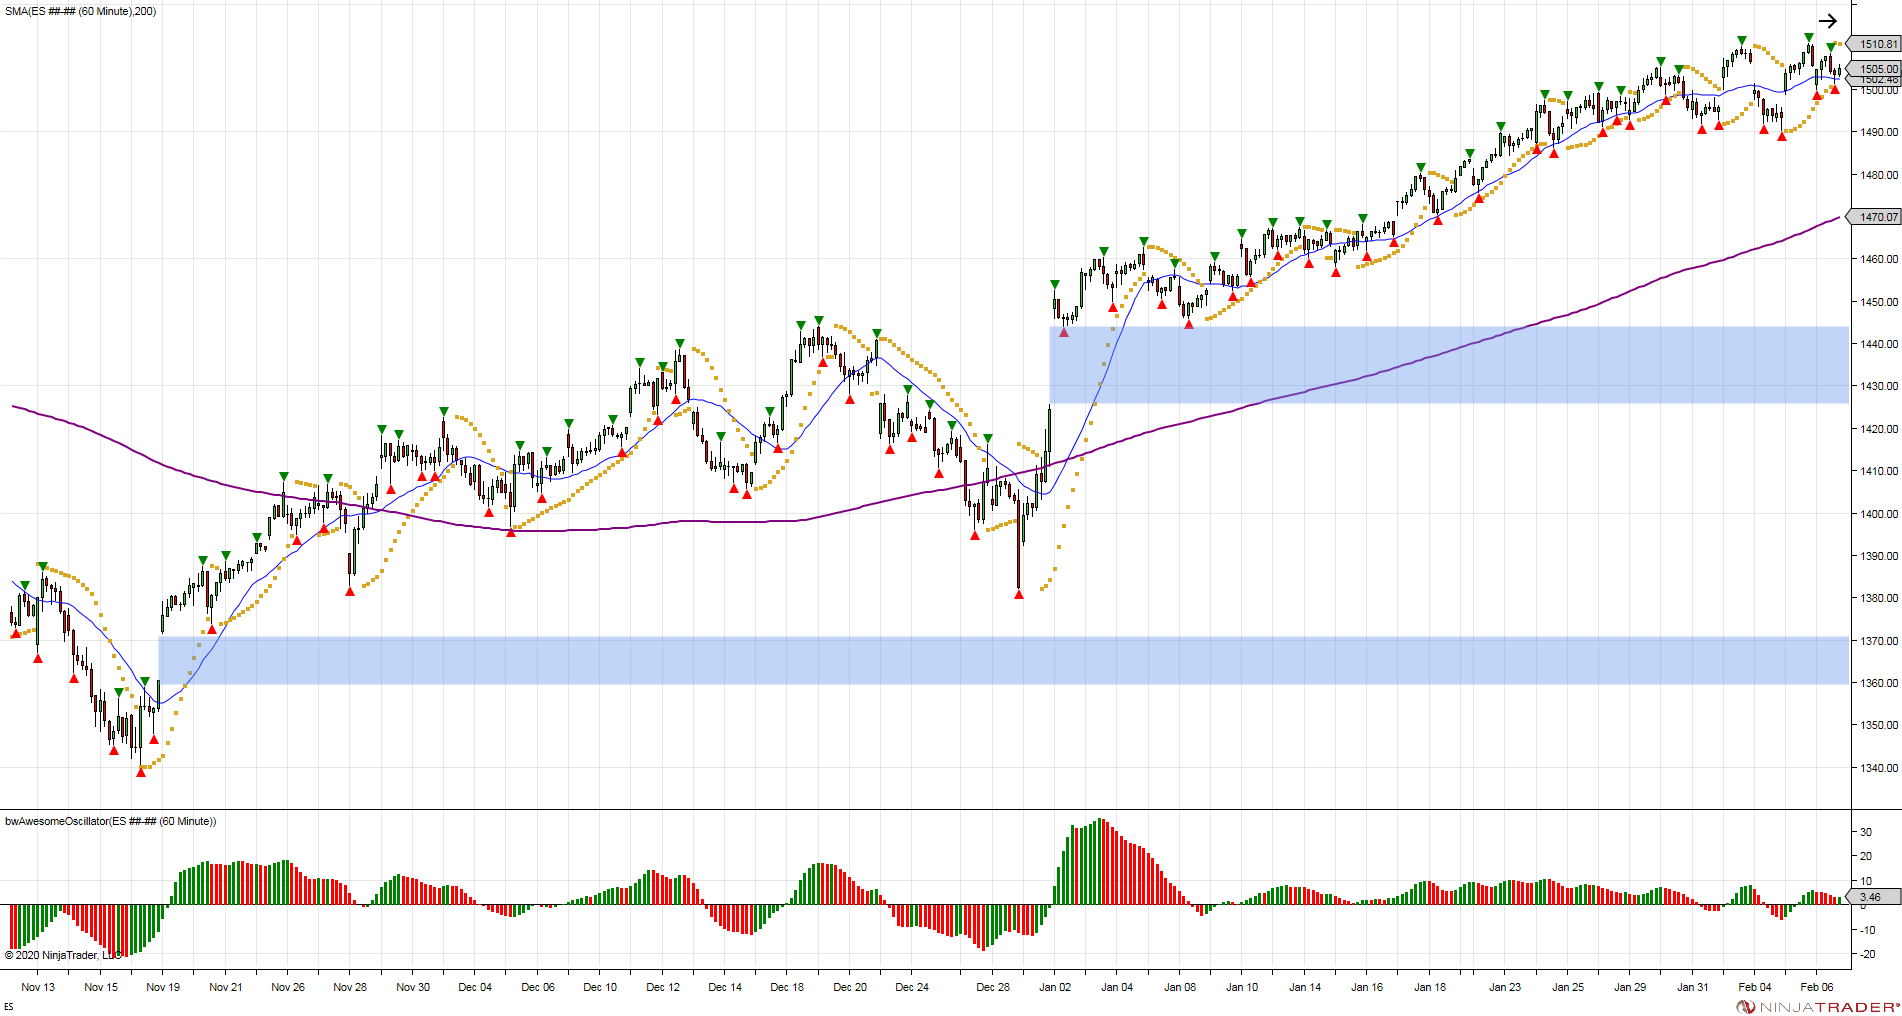
06/05/2012 Open Gap 1286.75
12/19/2011 Open Gap 1201.00
11/25/2011 Open Gap 1162.75
08/31/2010 Open Gap 1053
07/14/2009 Open Gap 903.50
03/09/2009 Open Gap 677.75