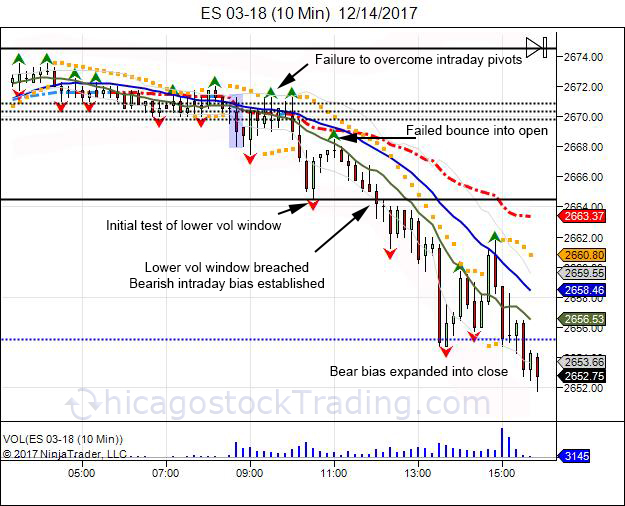
 On Thursday, the day after the FOMC statement, we review the intraday action in regards to Chicagostock's Volatility windows and pivots. The highlighted blue box, is the cash market open, NYSE 930 AM. After the open, the cash market had trouble overcoming the intraday pivots, seeing the range act as resistance. This led the market to fall into the lower Vol window which was met with a defensive bounce. The defensive bounce gave way for a retest of the open, giving sellers an area to defend and buyers major resistance to overcome. For buyers that picked up the initial test of the lower Vol window, this provided a bounce to take some profits into. Second or third attempt at the lower Vol window, increases the odds of seeing the level failing. After failing to overcome the opening range, the market drifted back toward the lower Vol window which was taken out. In order to establish a bearish intraday bias, a 5 minute hold below the lower Vol window needs to be seen. Sometimes the market can establish a bias, and bounce back to the open to again force sellers to defend their intraday trend. In this case, the second test of the lower Vol window saw the level taken out, establishing a bearish intraday bias. Since there was already an early bounce off the lower Vol window, there was not another one and sellers expanded the market lower, forcing longs to liquidate into the close.
