Chicagostock Trading

Chicagostock Trading

Treasury Charts

 ZB________Weekly___Week_47_2008___Week_23_2012.jpg

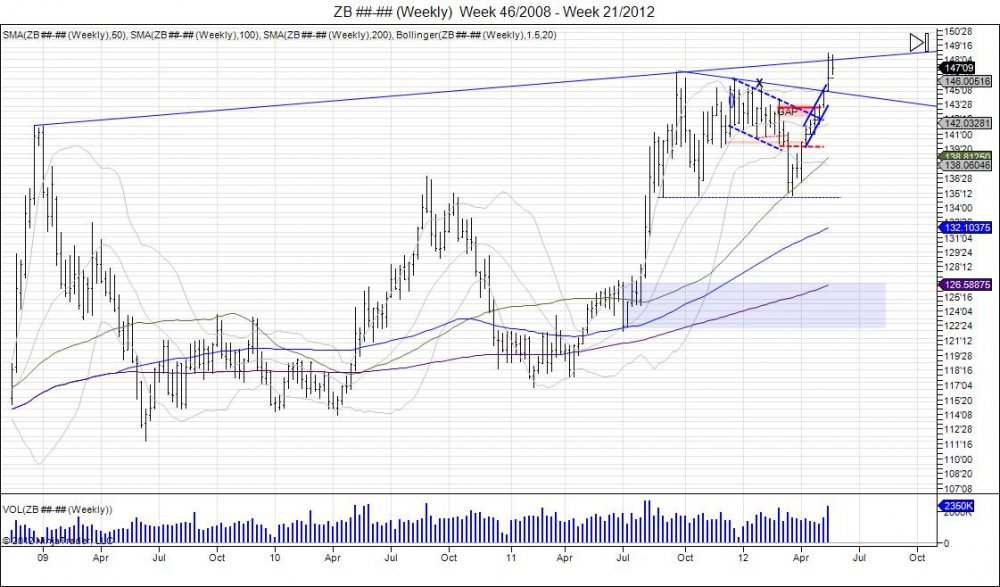
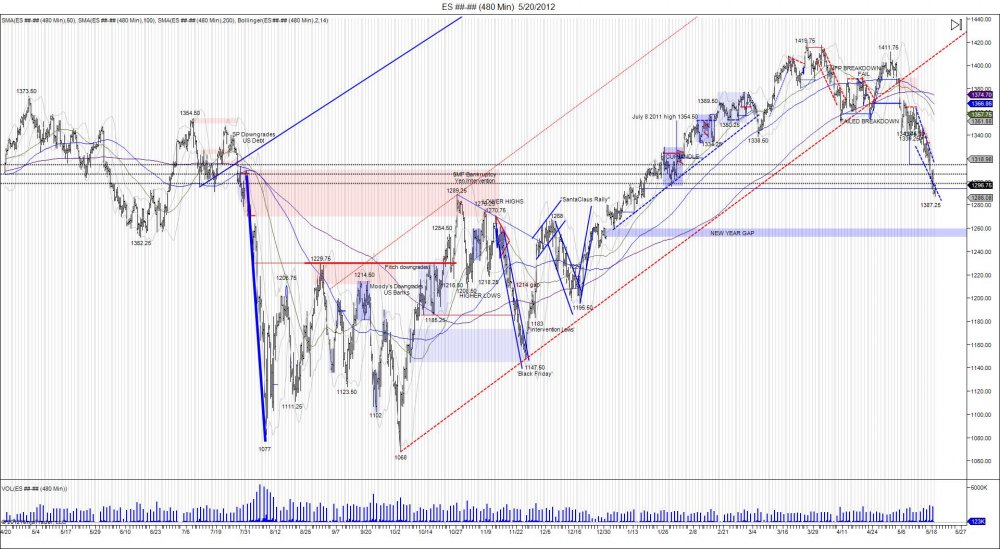
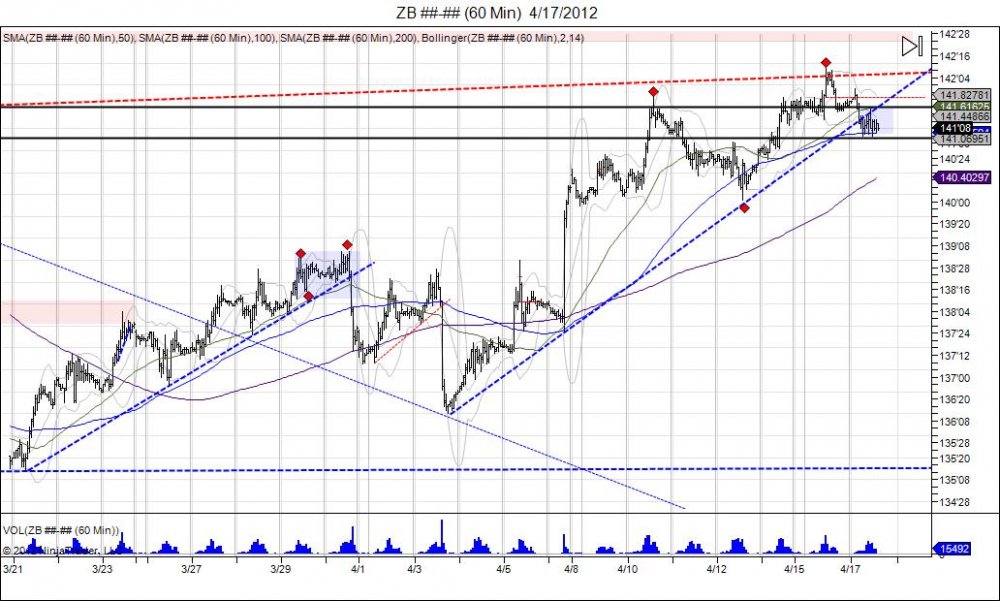
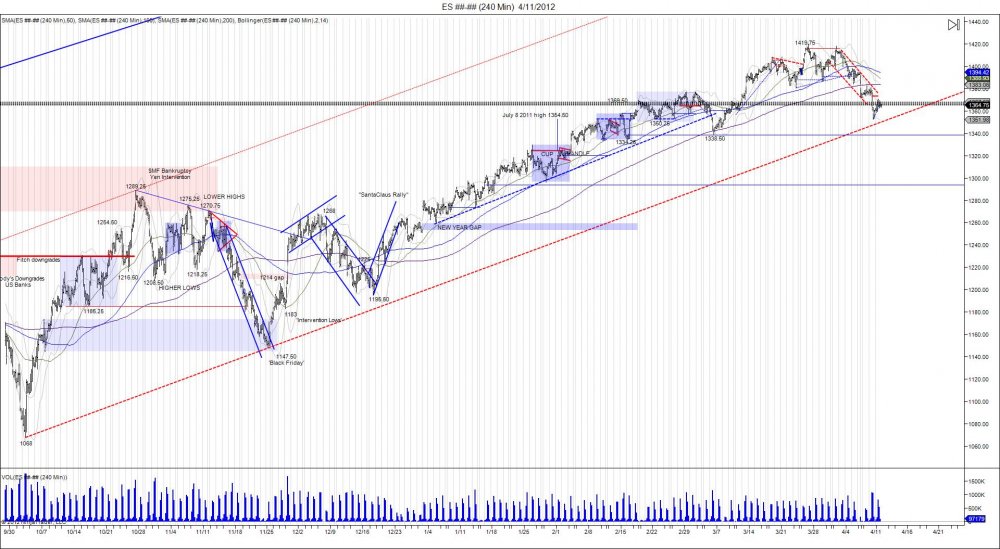
 Following the squeeze above its weekly resistance dating back from the 2009 highs, the market rallied to 15219 before reversing back to this trendline the market squeezed above.  Failure to hold this level turns this move higher into a failed breakout. Resistance comes in up to 15106 where sellers can look to defend these most recent highs with support at 14818-14622, 14508, 13804-13505.

ZN________Weekly___Week_45_2008___Week_23_2012.jpg

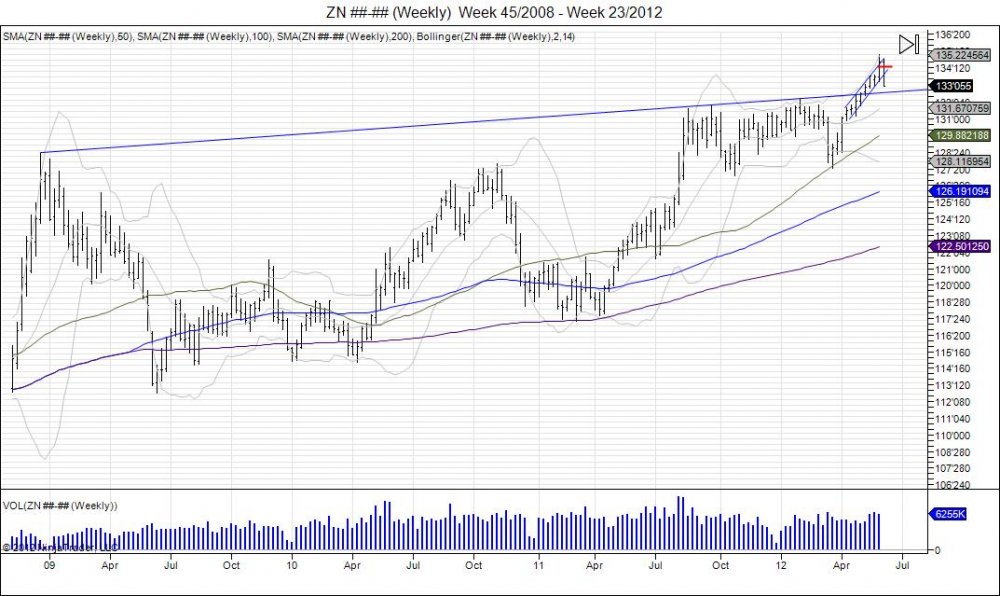
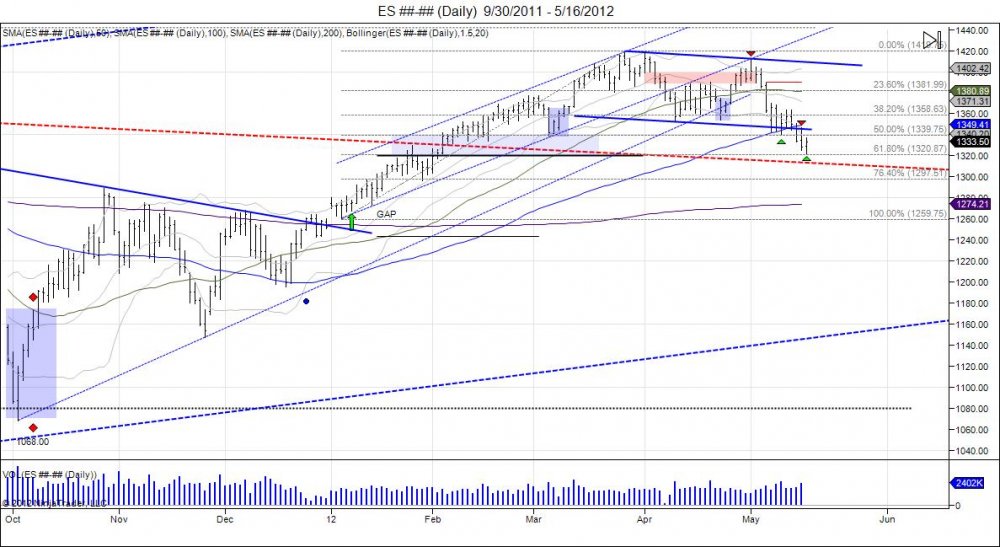
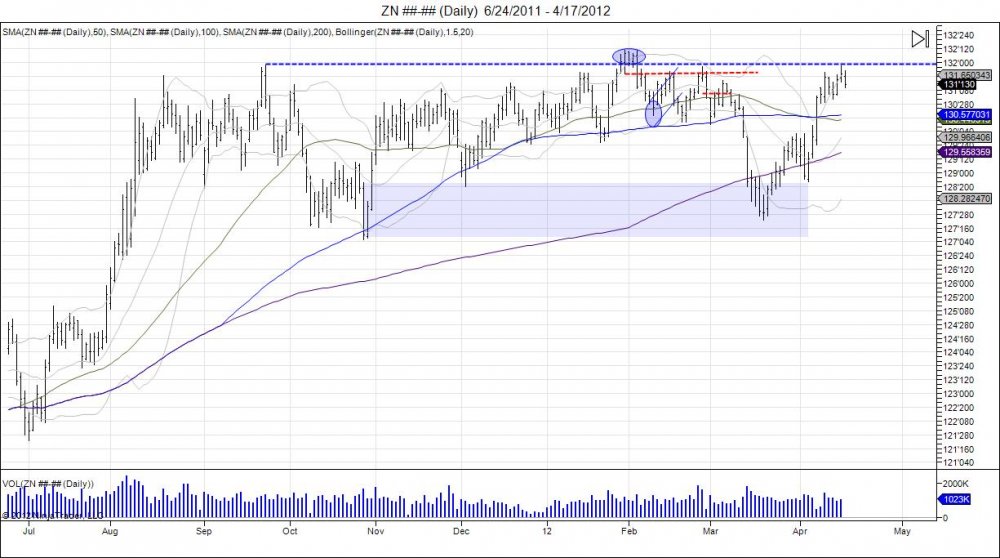
 The 10 year has reversed off its highs of 135085 and taken out the lows from this high at 133155.  In turn this has broken the rising channel the market has seen from early April.  A weekly close below 133155 is bearish and turns the level to resistance which gives potential for this latest squeeze to 135085 to become a failed breakout.  Support is seen at this resistance trendline from highs dating back in 2008 within 13217-13106, followed by next major support at 129095-127230 from where this market pivoted higher in March. 

ZF________Weekly___Week_50_2009___Week_23_2012.jpg

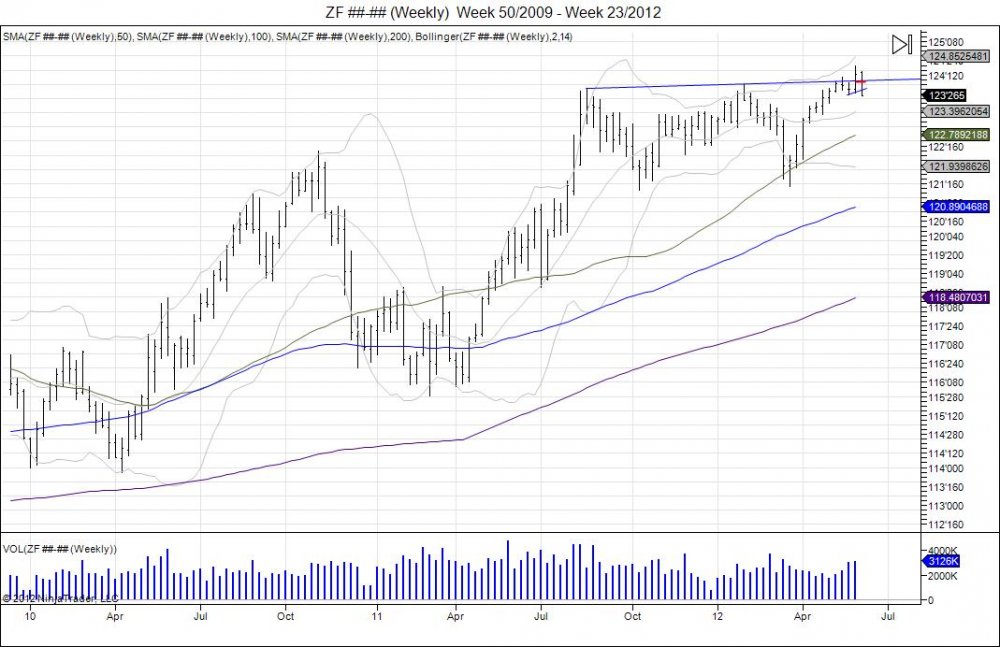
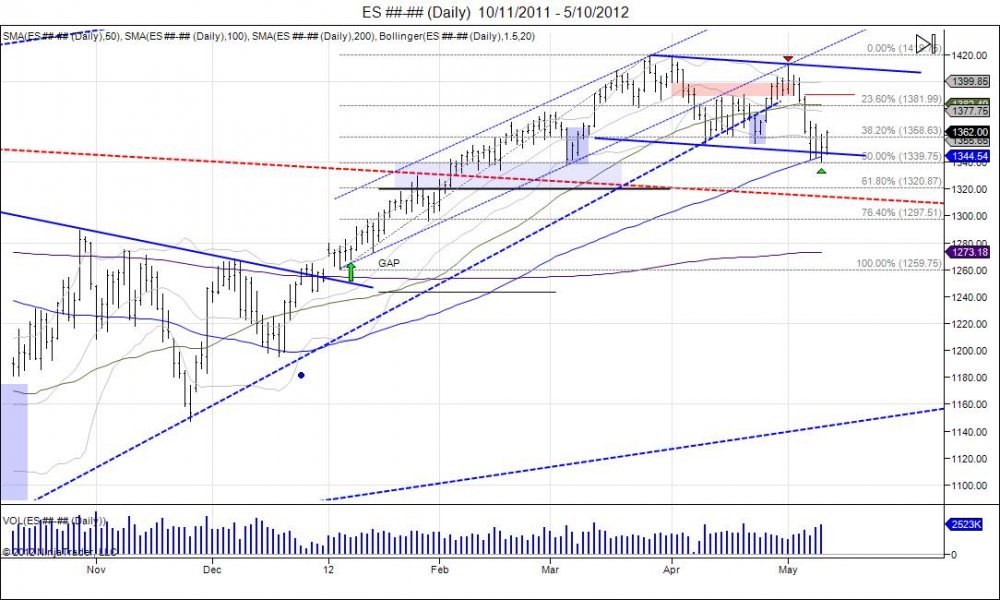
Same scenario in the 5 year, a break through resistance from the August 2011-February 2012 highs and a reversal lower to take out the weekly lows off this breakout.  A close below this weekly low of 123285 is bearish and should be used as resistance for sellers looking to defend this breakout.  This turns this breakout into a failed one, with next major support at 123195-123102 followed by 122080-121135 from the March pivot.


Continue reading
2797 Hits

Gold 61.8% and +$126

GC________240_Min___6_1_2012.jpg

 After gold tested its May lows of 1526.7 on the 30th, the market put in lows of 1532.1, holding those lows and reversing.  This showed signs of life and defense of these lows and the market most recently pulled into retest this 1532.1 level with support at 1548.  Today May 1st this was tested with a 1545.5 low and the market held to reverse and squeeze higher.  This move has caught sellers off guard and is retracing to test its major resistance of 1627-1672 of where the market failed in May.  This will be an area sellers must look to defend as a move past 1672 reclaims the ball for gold bulls.  

GC________Daily___11_7_2011___6_1_2012.jpg

GC_08_12__5_Min___6_1_2012.jpg

Buyers of 1548 level all out on this move for +126 in a day as squeeze has retraced 61.8% of breakdown.

Tags:
Continue reading
2702 Hits

Weekly 30 Year Bonds

ZB________Weekly___Week_46_2008___Week_21_2012.jpg 

Tags:
Continue reading
1987 Hits

Ultimate SP500 Chart 480

ES________480_Min___5_20_2012.jpg 

Tags:
Continue reading
2239 Hits

240 Minutes on Gold

 GC________240_Min___5_17_2012.jpg

Tags:
Continue reading
3556 Hits

SP500 61.8%

 ES________Daily___9_30_2011___5_16_2012.jpg


Tags:
Continue reading
1179 Hits

SP500 Daily Channel and 50% Retracement

 ES________Daily___10_11_2011___5_10_2012.jpg

Tags:
Continue reading
1131 Hits

US Dollar PPT

DX________Daily___8_17_2011___5_9_2012.jpg 


Continue reading
8782 Hits

Japanese Yen Back to its Neckline

 6J________Weekly___Week_37_2007___Week_19_2012.jpg

Continue reading
1243 Hits

Buy Silver

SI________Weekly___Week_8_2010___Week_19_2012.jpg 

Since silver's new low by a tick last year at 26145 in December, we saw the market squeeze into highs of 37580, retesting resistance from where the market broke down from in August.  This failed to hold and we have seen the market slowly drift back lower where it is now retesting where it broke out from in December being the 29000-26145 range.  This retracement offers bulls a level to defend within 29000 to the 26145 lows, using a break below 26000 as the exit.  The target for the move is 32, 35, 38. Failure to hold the 26000 and the market can see further downside room to 20 which would be testing the August 2010 breakout. 


Tags:
Continue reading
3586 Hits

SP500 Channel

 ES________Daily___9_15_2011___5_6_2012.jpg

Following the bounce seen the last week of April off the 1354 lows, the market rallied into retesting its daily channel that was broken on April 6th.  The bottom of this channel was hit on the tee as the market put in highs of 1411.75 and failed to move past the level, only to be rejected and turned lower.  Thus far we have seen the market break off this rejection and fall back down into taking out the stops below the 1354-1352.50 lows.  This has the market now testing the bottom of a newly created channel based off the March - May highs.  This test of this bottom channel also sees the market nearing a 50% retracement of the 1259.75-1419.75 rally at 1339.75.  Support should come into play at this bottom range to bounce this market back into retesting the market from where it broke down at 1390-1411.  Failure to hold these levels puts the next major support into play being the 1320 level from where the market broke out of in February, also a 61.8% retracement level.


Tags:
Continue reading
2615 Hits

SP500 Retraces NFP Breakdown

 ES________60_Min___4_26_2012.jpg

Tags:
Continue reading
2642 Hits

Euro's Failed Break and USD Head/Shoulder

6E________Daily___11_14_2011___4_26_2012.jpg

 click to maximize

Ever since the Euro broke out of its downtrend from November in January after reversing off lows of 12627 and trading through the first trading day of the year range of 13020-13085, this range has turned into support.  This is the market showing us that the breakdown in January has a head fake and the market is attempting to reverse its momentum as it climbed back above that first trading day of the year range.  Since then, the Euro squeezed into testing resistance from December however was unable to continue the push which was followed by a retest of the 13020-13085 support.  This led to another bounce that failed at the now new resistance from February levels, which was followed by another breakdown to retest its support level.  This failure at the February levels turned into a right shoulder as the market came down to test its neckline as many shorts were looking for a break to confirm a head/shoulders formation.  During the month of April the Euro pressed against this neckline and even clipped it to put in lows of 13000 however held its 12975 lows from February and reversed back higher.  This led to a major consolidation and struggle to hold this neckline as the Euro has fought with its back against the wall trying to chip away at sellers and get the market out of this downward pressure.  This is needed for the market to try and squeeze higher to have shorts in as fuel for an upside rally.  Currently the Euro has worked through its 13200 resistance and is testing its next major resistance from the failed March highs which also meets with a downward resistance from the Feb-Mar highs connected.  Buyers who defended the 13020-13085 support level have opportunity again to lock in profits and leave runners to let the market work itself out to try and squeeze through this resistance.  A move past the March highs squeezes out the shorts who were looking for the head/shoulder breakdown and targets the February highs.  Moving past this February high squeezes out the remaining shorts giving fuel for the next leg up to try and retrace into 138 from where the market broke down from in October.  This 138 is the ultimate resistance in Euro off the 14241 highs and sellers should be looking at this level to defend.  As stated before the Euro is in short covering mode ever since it climbed above the Jan 3rd levels and support is seen down to 12890.  A break below 13000 would shake out weak bulls however taking out the year lows of 12627 is needed to put the ball back in the bears hands. 

 read more...


Continue reading
4401 Hits

SP500 Market Update

 ES________Daily___9_9_2011___4_25_2012.jpg

 click to maximize

more...

Tags:
Continue reading
2213 Hits

138 Euro, 75 USD

6E________Daily___10_6_2011___4_23_2012.jpg

click to maximize

For the past 2 and half weeks, the Euro has consolidated and fought to hold its daily neckline stemming from the February - March lows.  This was breached on the 16th of March as the Euro hit lows of 13000, however quickly recovered and closed back above the trend line.  This shake out has seen the market continue to hold above its neckline, however meeting major resistance at the 13200 level.  Last Friday we saw the Euro close on highs hitting 13232, only to turn back lower on Monday and retest its breakout point.  This is at a critical level for the Euro as if this market is indeed ready to move higher, these Monday lows of 13107 should be supported for buyers to take out the  Monday highs of 13214 to show their strength of pushing back above 13200.  In turn the next major resistance comes within 13280-13387 from where the market broke down on April 2nd, as the range for buyers to squeeze through to target the February highs of 13488 and ultimately complete the retracement to 13800.  

more...


Continue reading
5543 Hits

30 Year Bond Hourly

 ZB________60_Min___4_17_2012.jpg


Continue reading
983 Hits

SP500 Targets NFP Breakdown 1395s

 ES________60_Min___4_17_2012.jpg

click to maximize

more...

Tags:
Continue reading
1942 Hits

10 Year Note Touches Ceiling Again

ZN________Daily___6_24_2011___4_17_2012.jpg

click to maximize 

Continue reading
1980 Hits

Going for the Gap

 ZB________Daily___6_28_2011___4_16_2012.jpg

more...

Tags:
Continue reading
2097 Hits

240 Minute SP500 Chart

 ES________240_Min___4_11_2012.jpg

click chart to maximize


Tags:
Continue reading
969 Hits