Chicagostock Trading

Chicagostock Trading

Where to Buy Gold

GC________Monthly___2_2007___4_2013.jpg


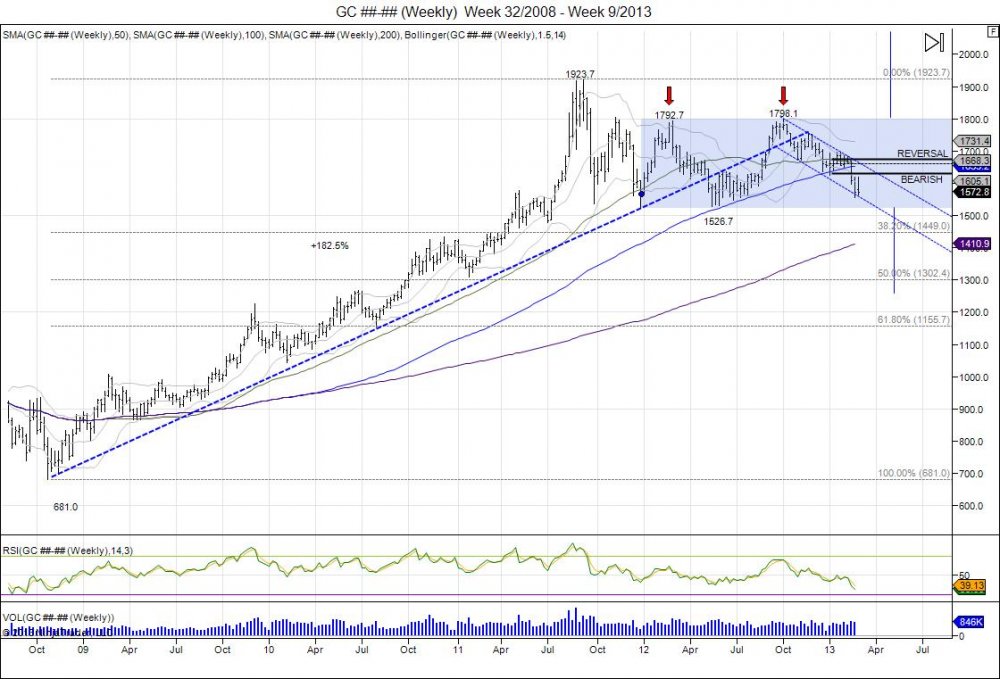
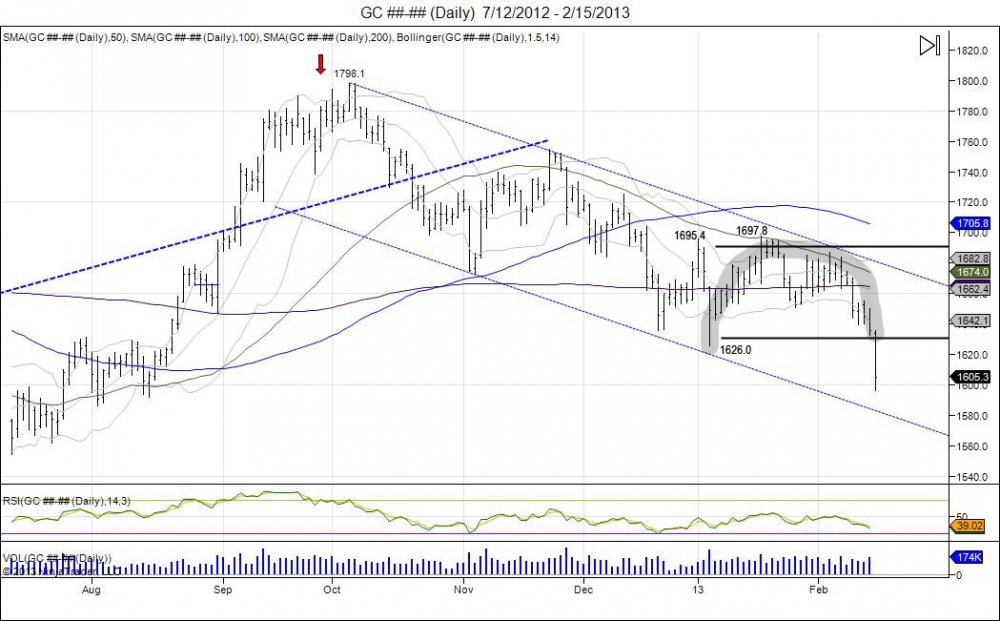
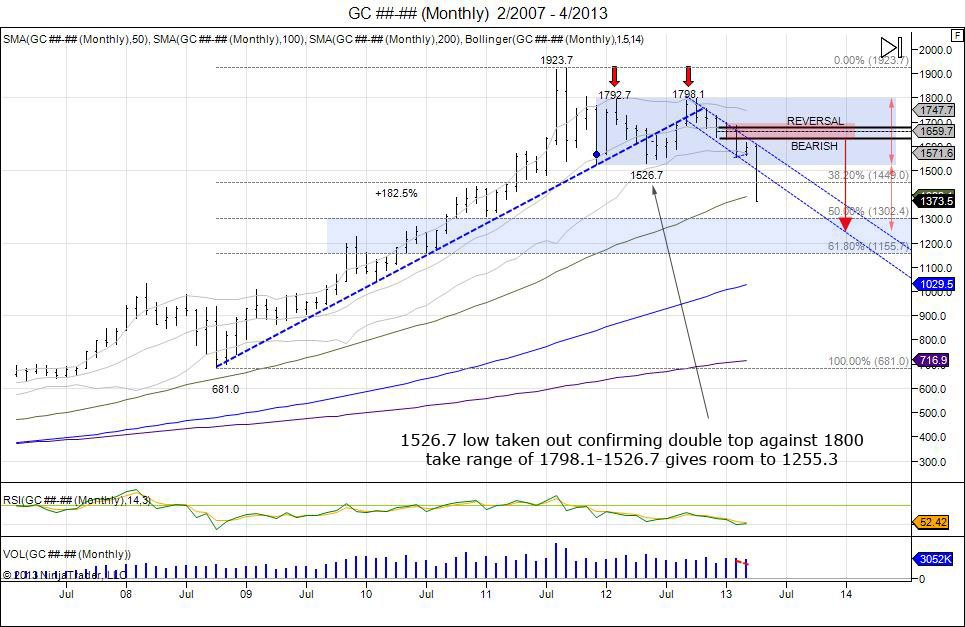
Since the December 2012 FOMC meeting that "Spooked the gold market" as the FOMC members attached a 6.5% unemployment for a target on rates, gold has fallen $362.6.  However since the failure to break above 1800 in 2012 and double topping at 1798.1, the market is down $442.8. So why the sudden crash over the past 2 days? As we know the market ran from 681-1923.7 as the FOMC cut their rates down to 0%.  The year of 2012 was all about consolidation.  It traded in a range of 1526.7-1798.1 which lured in a lot of late buyers betting on "hyperinflation".  As gold has most recently failed and broken below this 2012 low of 1526.7, it has confirmed the highs in 2012 as a double top.  This range of 271.4 (1798.1-1526.7) can now be subtracted below 1526.7 to give room to expand the market down to 1255.3.  This target when put out in December was looked at as a crazy and a lot of "gold bugs" were insulted. Today the market is bringing pain to these gold bugs as it shakes them out.  The current breakdown clears and shakes out buyers who came into the market above 1500.  The move is good for "smart" money who have been sitting on the sidelines awaiting for the market to go on sale. Completion of this move is seen at 1255 which also retraces the market 50% of its 681-1923 move. In the big picture, that would offer a 50% sale off the highs and bring the market back to where it broke out in 2010.  This range of 1200-1300 will offer an area of major support for the market to attempt to build a base for long term buyers to watch for to come in and buy the sale.  A break of 1150 would give room to test major support at 1000 being where the market broke out in 2009.  Failure to hold above sees the 681 low  targeted and at that point the long gold story would be all over. Short term yes the market is very over sold and the long community is in shell shock, the old lows of 1526 is now new major resistance with next level of sell stops below 1309.1 as the 2011 lows.


Continue reading
4410 Hits

SP500, Bonds, Yen, Euro Chart Updates

 SP500

ES________60_Min___3_27_2013b.jpg

Since the gap down two Sunday's ago on the Cyprus news and bouncing off the old highs from February at 1530, the market has gone into a major tug of war whipping short sellers who have tried to come in following the news.  The "plunge protection team" has managed to keep the momentum alive with higher lows.  Just 1 week after that gap down, the squeeze managed to print new highs on the year at 1560.50. Following this new high,  another pullback was seen to retest the prior low of 1535 only to see another higher low develop at 1539.  On Tuesday this led to a recovery that retested and pressed against resistance based off the Sunday high.  This has led to the market climbing back Tuesday night and retesting the 1560.50 level with the market tapping it again, however failing to breach.  Thus far this has led into another pullback, retesting the previous lows of 1539 with lows of 1545.75.  Higher low again as the range tightens and the market builds buy stops above the highs going into the holiday weekend. Sell stops also building below this trend of higher lows and they will be targeted eventually, question will be if momentum can stay alive into the holiday weekend as the range is now 154575-156050.  Resistance met against 1558 with stops above 1560.50.  Support  1548-1539. Bonds as shown below have continued to hold their bid following the Cyprus gap above 14200 and this has led to tap the March highs of 14429.  The squeeze eventually completes on a move past the February high of 14611 to confirm the break below 14200 as a failure.

Continue reading
3464 Hits

SP500 Double Top Caution

 ES________120_Min___3_25_2013.jpg


Last Sunday's breakdown to 1529.50 on the Cyprus news saw the market bounce off the old February highs of 1530 with lows of 1529.50.  This led to a roller coaster ride for the week as the market climbed back to 1552.50, fell down to 1531.75, squeezed back to 1555.75, fell back to 1535.00, and most recently completed the pattern of higher lows and higher highs by getting up to 1560.50.  This was a calculated attempt to defend those lows and make higher highs to squeeze out small sellers.  The latest high was done this Sunday night (one week after the gap down from 1544-1529.50), stopping out small shorts as the previous year high of 1558.75 was taken out.  The market has thus far rejected this new high and fallen down to where the it opened on Friday.  There is major risk now that this higher high turns into a failed breakout and a double top should buyers failed to defend the most recent pivot low of 1535.00.  Minor support off these lows are seen at 1539, however buyers should find it much harder to hold this trend and the lows of 1535 after new highs were set at 1560.50 which give much more pressure to take out these rising lows and squeeze out buyers.  This would confirm the new highs as a failure a double top with a breach of 1529.50. As discussed in the previous video, the market has been working on creating a head above 1530 for a head/shoulder topping pattern which confirms on a move below 1481.75.  


Continue reading
2531 Hits

Bond Market's Technical Signals Before Cyprus

 ZB 06-13 (60 Min)  3_15_2013_1.jpg

The bond market showed signs of reliance late last week as the SP500 printed new highs early Friday, yet bonds stabilized to create a base from those lows printed on Thursday at 14024.  Friday's action saw lows of 14105, testing and holding the range from Thursday's lows, and in turn building a right shoulder for an inverted head/shoulder pattern as aggressive buyers were using this as an entry with stops below Thursday's lows.  The move on Friday squeezing through the neckline of 14121 confirmed the inverted head/shoulder and rewarded buyers down to 14105. This range of 14121-14024 gave an upside target of 14223 to complete the expansion of the inverted head/shoulder. As the market held above this neckline on Friday, it consolidated after taking out the 14129 high made on NFP day and in turn this consolidation created a bull flag as seen in the hourly chart, also projecting 14223.  

All of this technical analysis confirmed Sunday night as the bond market opened higher at 14210 and squeezed to complete the target of 14223. The catalyst for this, 'news' out of Cyprus putting a tax on bank deposits.  Price action always precedes news as one cannot predict when news comes out, however they can use price action as the roadmap to guide where they can defend levels and where the market can go.  

ZB_06_13__60_Min___3_17_2013a.jpg

Continue reading
4065 Hits

Fear Turns to Greed at Breakeven.

2011 vs 2012 Patterns compared

ES________Weekly___Week_18_2008___Week_11_2013.jpg

Click charts to maximize.

The SP pattern from January of last year gapping open at 1259.75 above resistance just as the gap open at 1108 in September of 2010, is now mimicking the % move. The first breakout in September of 2010 at 1108 recall was just after the year of the Jackson hole QE start in August and the volatile period during that summer range to put in a bottom at 1002.75. The breakout in September squeezed a 24% rally leading the market into highs of 1373.50 to test the range from May of 2008 of where the fall out began. Last January this pattern was mimicked again with the market gapping higher at 1259.75 to start another breakout following another volatile period during the summer with lows of 1068. This gap at 1259.75 has held open and the wave has now squeezed the market up 23.1%, putting it right at the door steps of resistance from the range off all time highs of 1586.75. At this point the market is testing major resistance based off the all time highs and seeing a small pause. Whether the market can muster enough strength to squeeze through and stop out shorts to follow the Dow Jones average into new all time highs is yet to be known. The next major resistance would be the 1600 level as everyone sees, keyword everyone. The biggest risk is the SP500 not taking out the all time high, thus buyers remain complacent looking for new highs, buying pullbacks which gives way to setup bag holders.


Tags:
Continue reading
4148 Hits

Gold $98 Locked & Free Ride for Another $366

 GC________Weekly___Week_32_2008___Week_9_2013.jpg

Gold's double top from 2012's year of consolidation following the 182% gain from 681-1923.7 has seen the market channel lower since that high of 1798.1.  This year began with a early breakdown followed by a bounce up to 1697.8 where the market failed to push through, leading the market to breach the year lows of 1626 in contrast to the US dollar reversed to take out its year highs.  Going forward, the market is now testing its last level of support based off its 1526.7 lows made in 2012.  This week has been a major failure as the market rallied to take out last week's highs of 1618.8, only to fail and turn back lower to where the week opened at 1579.7.  The downside chase continues and the 2012 lows are being targeted by bears.  A breach of thsi 1526.7 low confirms the 2012 double top and gives room to expand that $271.4 range which gives a downside target of 1255.3.  This would retrace the makret 50% of its 681-1923.7 move and offer long term investors a big area to buy.  Move back above 1676 reverses the bearish bias to give room to retest year highs.

Continue reading
3431 Hits

Reversals of the Year

 dx3_1.jpg

Continue reading
3448 Hits

How We Played This SP correction and Setting Runners for Homeruns

 ES2_26.jpg


With the SP500 squeezing the December 2007 high of 1527 and running into 1530, the rug was pulled underneath as bids lifted and sellers came in to take profits.  This led the market to correct down to 1495.00, testing its 1498 support level it broke out of in January.  This setup an aggressive attempt to sell any retracements retesting the 1530 level.  On Monday, the retracement was seen.  Our signal was offered at 1515 and using the 1530 highs as the exit.  The market came close up to 1524.50 before reversing lower to complete target 1 at 1498, locking in 1 times the risk for 17 handles.  Target 2 was 2 times risk at 1481, however with the market falling so quickly the same day, we were happy to lock in 1483 for another 32 handles to total 49 locked in. What is left is "running" positions where only profits are risked.  The runners should double the 49 handles locked in to turn the trade into a home run.  These don't always happen, but this is how we like to position trades for big moves, by scaling out to reduce exposure and leaving only runners to go after big targets.  Target on these runners are currently 1420. This is not to say the market will go straight there, however this would be a breach of MAJOR support within 1455-1465 and would fill last year's gap down to 1423.  Doing so, will pay 95 handles just on the runner positions.

Continue reading
2977 Hits

Major USD Reversal No One is Talking About


US DOLLAR:

DX2_25.jpg

The US dollar is one of the most important, yet least discussed chart of the year.  Noticing the dollar's break below 79600 late January, early February, only to establish a bearish bias and lure in shorts before turning around higher. The market has held above its reversal window, thus reversing the bearish bias which has led the market to take out its year highs of 8100 set early January.  This U turn is having a major effect and pressure on commodity markets as the USD failed to break lower and is trading on new highs for the year. Take note of the gold chart how it is completely opposite of the dollar chart and is an upside down "U" from the beginning of the year.


ES________Daily___3_14_2012___2_25_2013.jpg


Click charts to maximize

Continue reading
2715 Hits

Gold Breaks Year Lows, Whats Next?

 GC________Daily___7_12_2012___2_15_2013.jpg

Gold broke its year low of 1626 today after it bounced off the level early January only to take out the early year high of 1695.4 by a few points at 1697.8.  The market failed holding above the year highs in mid January and fell lower to retest the lows later in the month and beginning of February.  After 2 weeks of consolidation above 1650 exhuasting daytraders selling, the market finally broke below 1651 on the 11th of February.  This killed the attempt to build an inverted head/shoulder bottom and regained the bearish momentum as the market held below 1650 to keep buyers above trapped. Trapping these buyers led to the move today in breaking the year lows to run stops and fall down to 1596.7, 101.1 off the year highs.  This has the market now testing major support off last year's lows of 1526.7.  As seen on the daily chart, the market has created a upside down U turn. Meaning gold started at 1626, moved to 1697 and now back below 1626.  Going forward, a 5 day hold below 1630 establishes a bearish bias for the first half of the year and gives room to continue the move lower.

Continue reading
3368 Hits

UPDATE SP500, Crude Oil, Gold

SP500 120 MINUTE:ES________120_Min___2_13_2013.jpg


OIL 120 MINUTE: 

CL________120_Min___2_13_2013.jpg

Continue reading
881 Hits

Yen Gets Down to Tgt Zone

 6J________Weekly___Week_49_2009___Week_42_2012.jpg


6J________Weekly___Week_8_2010___Week_6_2013.jpg


The Japanese Yen has come a long way since putting in it's right shoulder of 12967 in September of 2012 and breaking its neckline of 11879 in December.  This this breach of the neckline, the market has been in a downside chase in a hurry to complete its h/s target of 10494. Target is used by taking range 13264-11879=1385 and subtracting this from 11879 to give 10494.  Lows of 10633 were made this week as the Yen has retraced back to the flash crash levels of 2010.  The opening in May was 10650 which has provided some support at this time with lows of 10532 as seen on the weekly chart. An attempt to bottom out is being made here however major stops remain below this 10532 low from May of 2010 so any buying at these levels is aggressive and most likely short covering.  First level of support comes within 10730-10760 as a range aggressive buyers can defend with small stops below these most recent lows of 10630. First level of upside resistance met within 10960-11075, followed by 11090-11396.


Continue reading
2602 Hits

SP500/Crude Oil Chart UPDATES

OIL HOURLY: CL________60_Min___2_4_2013.jpg


SP500 HOURLY:

ES________60_Min___2_4_2013.jpg


SP500 DAILY: 

ES________Daily___3_14_2012___2_4_2013.jpg

Click charts to maximize.

Continue reading
1209 Hits

Moment of Truth

 ES________120_Min___1_30_2013.jpg


 ES________Daily___3_23_2012___1_30_2013.jpg


Tags:
Continue reading
3266 Hits

Key Levels SP500

 ES________Daily___3_6_2012___1_22_2013.jpg


ES________60_Min___1_22_2013.jpg

Tags:
Continue reading
2377 Hits

Apple's Room to 650

 AAPL__Monthly___12_2008___1_2013.jpg

Since putting in highs of 705.07 as the iPhone 5 was announced in September of 2012, doubling from the August 2011 lows of 350, Apple saw a reversal in October that broke the September lows of 656.  This turned into a major failure and sell the news catalyst as the market quickly reversed lower.  This reversal led the market to fall into its 100day moving average on the daily chart, making lows of 623.55 to test where the market broke out in August.  Just as the market was on these lows at 623, Apple bulls were relentless in thinking to just buy the dip. An Apple event was scheduled for October 23 that had these bulls giddy for a move higher. Warning about how this event was what the bulls were hanging their hopes on, a mini ipad.  


Continue reading
3622 Hits

SP500 1385-1423 Cup/Handle Completed


ES________60_Min___11_20_2012.jpgES_12_12__60_Min___12_4_2012.jpg

Continue reading
3321 Hits

SP500, Nasdaq, and Apple Video Analysis

Continue reading
3911 Hits

The Ultimate Short Squeeze 665-1441 & Accurately Predicting Every Correction Using Technical Analysis


Since the all time highs of 1586.75 set October of 2007, the SP500 corrected into lows of 1255.50 early 2008 with Bear Stearns bankruptcy.  A short squeeze was seen up to 1441 in May of 2008, only to reverse and fall into lows of 1373.50.  This reversal led to a summer decline that took out the years and set up a shaky market going into the fall. As September began, the SP500 made highs of 1303.50 only to reverse and cause a spike in the Volatility Index.  This reversal ultimately led to the crash as the market fell into lows of 665.75, March of 2009.  Since this low, the market has channeled higher on glass stairs as it has gone through few major shakedowns however managed to continue the squeeze and retrace 100% of the breakdown from 1441.  Below are the corrections seen during this move.

Click charts to maximize. 

SP500 sets highs of 1216.75 before stalling to create a head/shoulder topping pattern projecting 1136.75. Ultimately seeing a flash crash with a quick move to 1056 before coming back to the 1130 level. 


2010 SP500 Head/Shoulder Topping Pattern Completes 1136.75 and sees Flash Crash to 1060s:

Continue reading
17935 Hits

Nasdaq Market Update

 NQ________1440_Min___11_8_2012.jpg


Non Farm Payroll Dates:
09/07/12 - Highs 2836.25
10/05/12 - Highs 2840.75
11/02/12 - Highs 2694.00

The daily Nasdaq chart above shows the importance of the last 3 Non farm payroll dates.  The September NFP number marked the left shoulder that was created with highs of 2836.25.  A small pullback was seen off that high down to 2777.75. The market early sellers by taking out this NFP high and ran into 2871.75.  The move into this level failed as a flat top was made and the market fell to take out the previous low of 2777.75 that led into that high.  The breakdown shook longs as the market was digesting the latest QE news.  Not quite ready to break down, another squeeze was seen to retest the 2871.75 highs where the market hit 2840.75 on the October NFP number.  The test of the highs created a right shoulder for a head/shoulder topping pattern as the market broke lower to take out the neckline of 2762.25.  From this level the market moved to expand and complete this head/shoulder pattern by falling into the 2650-2600 range.  Since falling into this the market went into consolidation in attempt to hold this support as the move was digested.  This led to highs of 2694.00 on Novembers NFP number just before the election.  As the election passed, this high was tested and failed, and the downside momentum and chase has continued int he market. This chase is taking place as buyers who missed the August rally higher are coming in to buy the dips only to see the market fail to give an uptick and press down which uses these buyers to sell into as well as squeeze out.  

Looking at the monthly chart below we see this correcting 10% thus far of the 1017.75-2871.75 rally over the past 4 years.  This correction since the failed highs in September and reversal in October has the market now testing the breakout range in June within 2433.75-2628.25.  This is major support for the upside momentum. A target of these lows squeezes shorts and attempts a head/shoulder top formation based off the reversal off the highs and down through these lows. This gives an area of major support as it retraces the market 23.6% and an area to see short covering as well as buyers step in to attempt a retest of the September range. Failure to push the September range sees a right shoulder build followed by a target of the 23.6% neckline again. Breach of the neckline then gives room to expand this range which gives room to the 50% retracement level down to the July 2011 lows of 1972.25.  This is all premature, and what we are seeing now is the chase trade that is targeting the 2433.75 lows from June of 2012.  Breach of these lows confirms weakness in the market and an area for buyers to step in as well as sellers to await a retest of the September range.


Click charts to maximizeNQ________Monthly___2_2003___11_2012.jpg


Nasdaq's 2012 Daily Head/Shoulder Creation

Tags:
Continue reading
4224 Hits