Chicagostock Trading

Chicagostock Trading

Summer Capitulation or Summer Bummer

1-8-12b_1.jpg


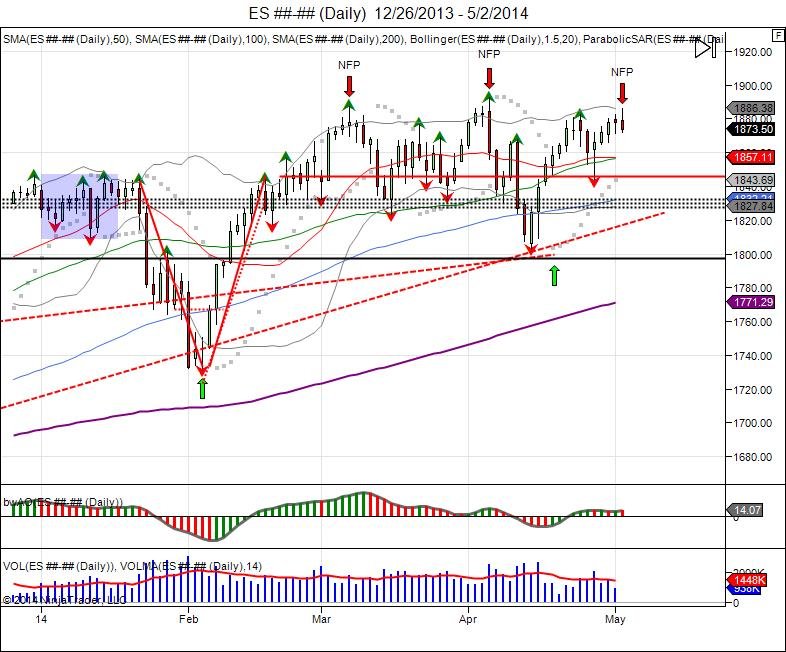
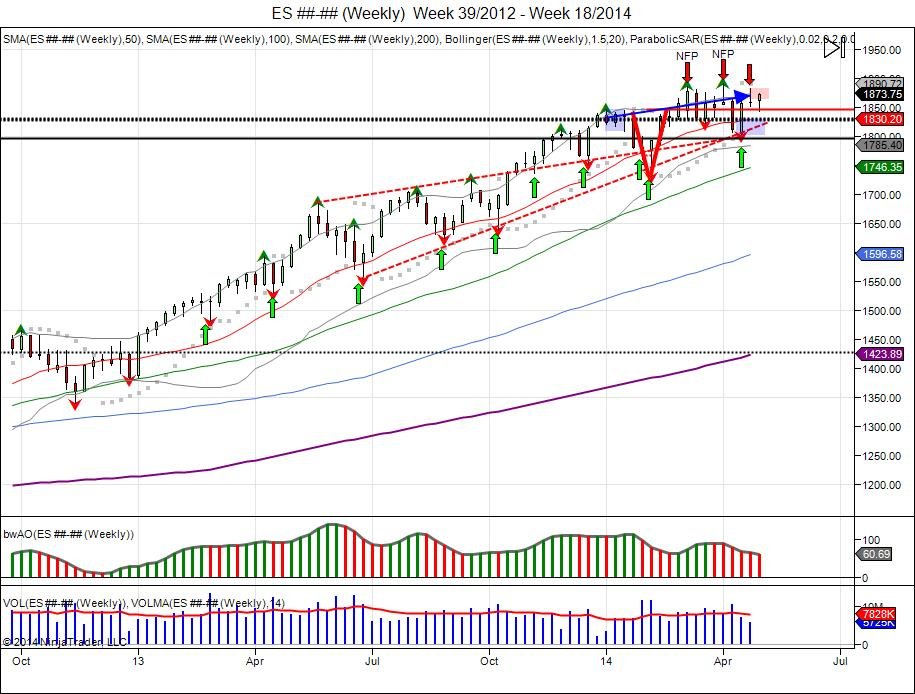
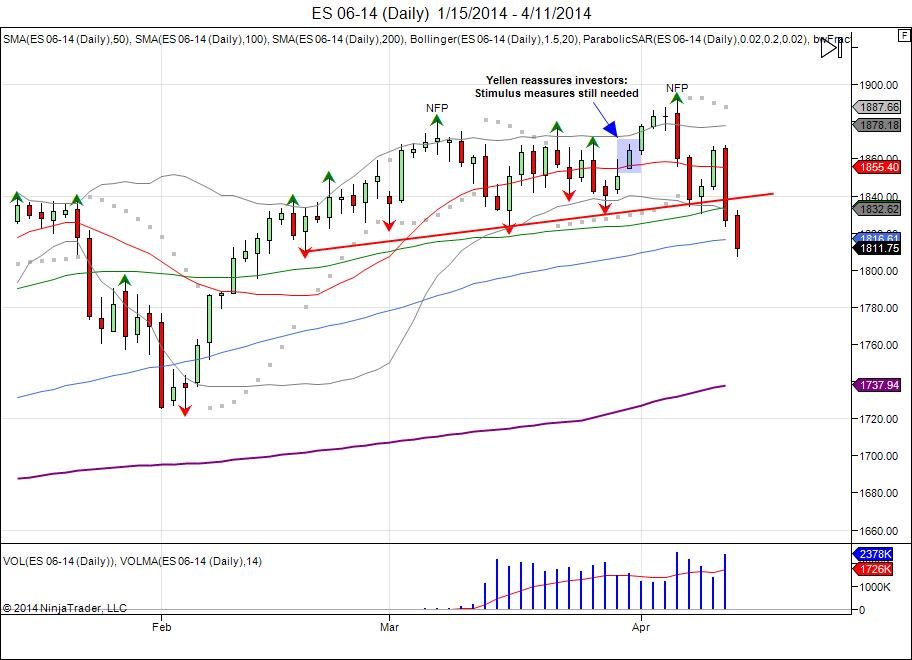
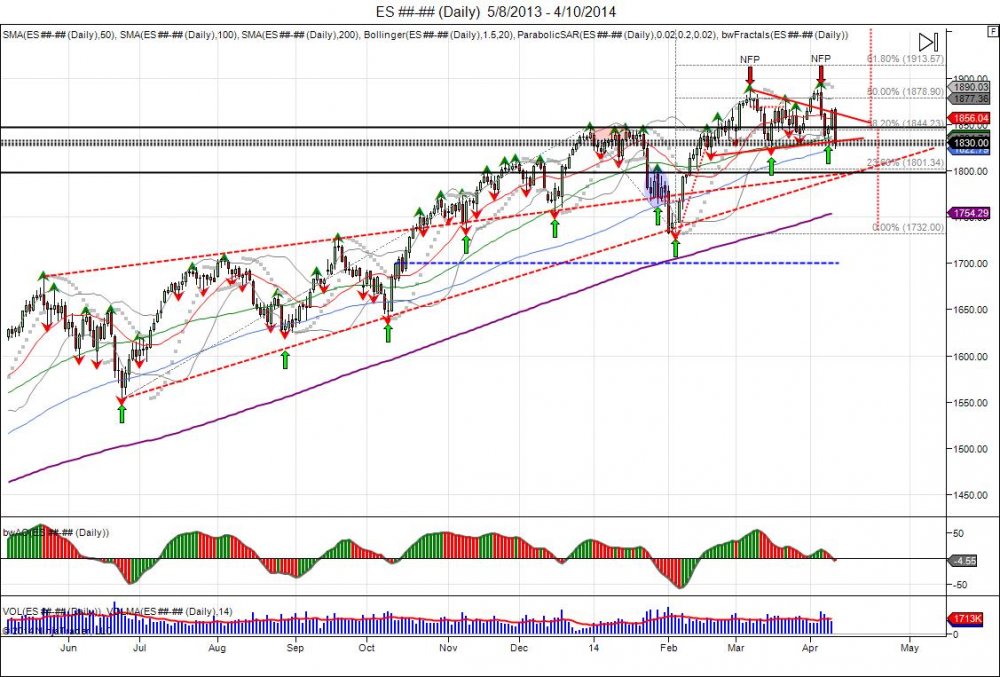
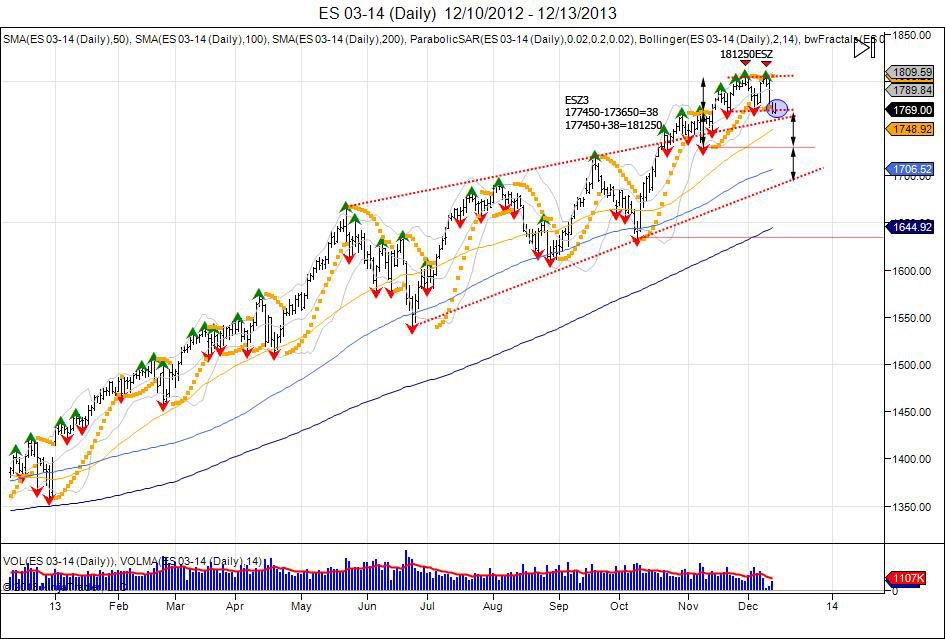
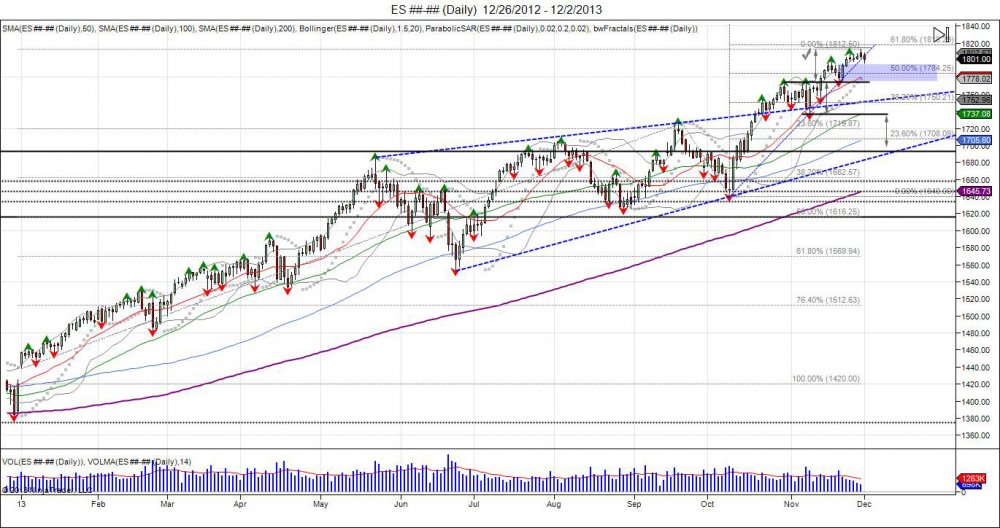
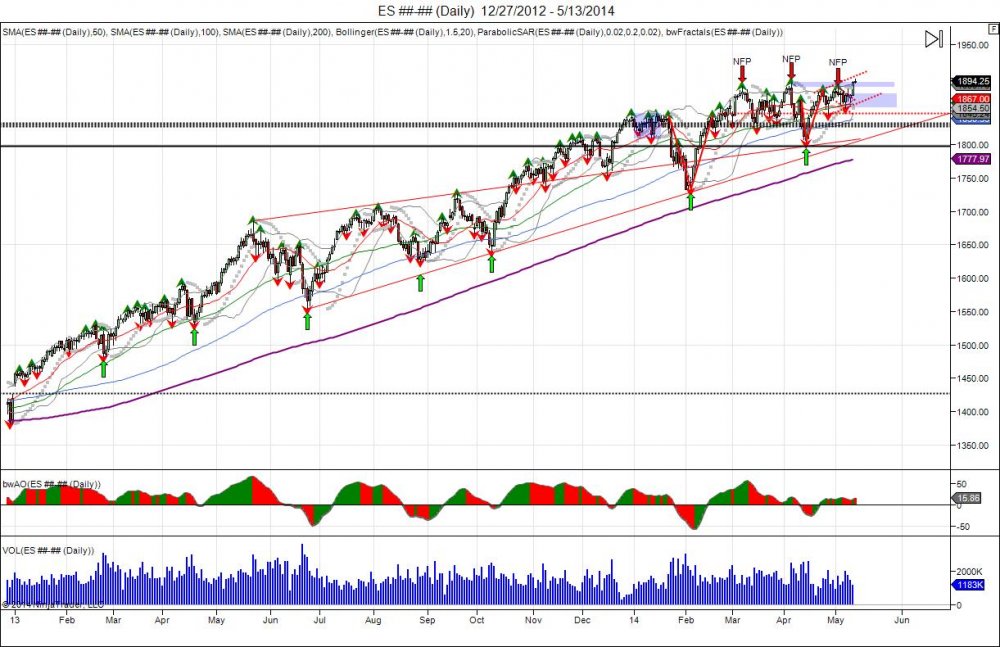
Notice long term 2013 trend from the breakout gap and go above 1440 to start the year see a setup of higher lows strongly defended.  Early 2014 low held right against this trendline to put in another higher low and see new highs made. Latest higher low comes in at the April lows of 1803.  Uptrend line caught up to the market forcing buyers to defend even as market has gone into sideways distribution. The sideways consolidation has been a fight to hold the uptrend. Latest bounce coming from the April low and break out above recent 3 month range is looking for capitulation of shorts and new longs to be forced above new highs. The April low is now a major pivot level as a breach below breaks reveres the uptrend of higher lows.

Continue reading
3047 Hits

Long Silver

Tags:
Continue reading
2620 Hits

Stocks Strike Out , Cash Takes Profits

1-8-12b_1.jpg


The SP500 for the 3rd time in the last 3 months sold off on NFP numbers.  The last two, were both peak highs. March 7th the SP hit highs of 188750 before turning down to 182350. The FRB chair gave the markets a push on the 31st of March reassuring stimulus measures. This gave way for new highs going into the April 4th report at 189250, only to see these highs once again rejected after the NFP numbers were released that morning.  This higher high and failure led the market to break March lows and fall down to 1803 in April to shake out the long side and lure in shorts. This has led into a short squeeze leading into today's job number as the market retested the failed April highs to give buy side another chance to push through.  Third time was not the charm, as the NFP failed to breach old highs of 189250 and the cash open saw profit taking to hold the NFP high of 1886, setting up a LOWER high, as opposed to the last 2 NFP peaks. 

This selling on the Jobs report over the last 3 month period comes as the market nears the old 6.5% unemployment target the FRB established in December of 2012.  The SP closed 2012 at 1420, 30 year bonds at 147, gold at 1675, and the Yen at 115.  With the unemployment rate now at 6.3% below the 6.5% target that was pulled, we are seeing the 30 year bonds, gold, and the Yen all reverse their trends and show a strong 2014 in contrast to last year.  This is putting major pressure against the market as the 3 of these instruments all started on the lows of the year and grinded up to show a reversal and underlying bid by short covering.  The consolidation in bonds, gold, and the yen over the last 2 months is the markets way of keeping shorts trapped as the year lows hold and market stabilizes to force them to cover into what is now being seen.  The SP500 in contrast, has not changed its 2013 trend as of yet. The year of 2014 started weak with a move down to 1732 only to shake out longs and attract shorts in what turned into a reversal.  This setup a V bottom as the 2013 highs were taken out, and clearing the cache of shorts. now it was time to find new buyers to stabilize prices, and this is where we have been the last 3 months, in search of these buyers, which has led the market to consolidate sideways. Throughout this period, all peak highs that attempted to break higher were used as opportunities to take profits into by the market.  This shows that the long side is already heavy handed thus finding trouble getting new longs into the boat, giving way for the boat to be tipped for the majority to feel the pain.


Continue reading
1196 Hits

Pulling the 6.5% NFP Target

Since the December 2012 FOMC statement adding the 6.5% unemployment target to the fed funds rate:

1-8-12b_1.jpg

Bonds, Gold, and the Yen (BGY), all front ran the FRB NFP target, moving down heavily for the year 2013, while the SP500 moved up 33%.


In 2014, just as the NFP target reached 6.7% to near the 6.5% target, it was pulled.

Year to date for 2014:

Bonds, Gold, and the Yen, working against a major downward trend last year falling an average of 20.3%, all started the year of 2014 on the lows and grinded higher. This reversal for 2014 is counter to the 2013 trend, however is the way of the market completing its front run into 6.5% target.  The SP on other hand, coming off a +33% move in 2013, has held flat for 2014, threading on the highs, fighting to hold its trend versus what bonds/gold/yen are doing.  The SP is also needing to take a lot of juicing at these levels as the FRB chair came out on the 31st of March to reassure investors of continued support, WHILE THE MARKET WAS AT ALL TIME HIGHS! Seems to be the last leg of longs are being lured into the market and we did see since March 31st the market ran 20 handles higher into 189250 only to fall 90 lower.


1-8-12b_1.jpg

Thus far both of the last 2 NFP reports turned out to be the peak highs of the year and provided great trading opportunities. Join us for next NFP report by subscribing today.

Continue reading
872 Hits

DAYTRADING SP500, CRUDE, GOLD WITH CHICAGOSTOCK MONDAY 04/28/14

1-8-12b_1.jpg

1-8-12b_1.jpg


1-8-12b_1.jpg

Continue reading
908 Hits

DONE BEFORE THE OPEN

1-8-12b_1.jpg


Coming into this week, tax day and a shortened holiday week was tricky. We had FRB chair pump the markets end of March into new highs reassuring investors of continued stimulus, only to see the NFP numbers double top the market and the rally get sold into.  The selling picked up with the March lows taken out, confirming a short term double top as it shook out longs and left buyers from the "stimulus" talk trapped.  This led to a breakdown on Friday with lows of 180725 going into the weekend.


On Friday our systems triggered many buy signals which gave opportunity to collect up to 32 handles from base hits during the day, however the market remained weak on Friday. Settling near the lows, this put pressure for a flush to take place going into Sunday. This was seen Sunday night with new lows down to 180325 before reversing higher. This triggered new buy signals at 180650 with a 5 handle stop for aggressive buyers.  Going into the cash open, the market had retraced up to 182375 allowing to lock in majority of profits and allow runners to work for a day on cruise control. The cash open was followed by profit taking seeing the market fall into lows of 181550 to allow intraday buyers an area to defend, which they did and pushed the market up to highs of 182800 to test the upper vol window. Profit taking led the market to run out of gas and see a shake down into the afternoon, falling down to 180825 to retest the overnight lows before seeing a squeeze up to settle at 182450.  Flushing intraday buyers, luring in shorts sub 1815 and squeezing 10 higher.


Monday 04/14/14 reversal off lows:

1-8-12b_1.jpg

CST aggressive long signal @ 180650.

Target 1 181150, Target 2 181650 completed prior to the open to lock in 15 handles with runners. Target 3 was scaled at 182650 to lock in 20 handles and leave 1 contract on with a 1814 stop. Afternoon attempted to buy 4 more at 1818 only to see the market dance at the level too long, in turn scratching the position at 1818. Flush kicked out the overnight 180650 runner at 181400. On 6 contracts, 57.5 handles locked in. If one only bought 3 contracts @ 250 risk each total risk of 750, would have allowed to take tgt 1 181150, 2 181650, and 3 at 182650 to lock in 35 handles.

Tags:
Continue reading
2470 Hits

DAY TRADING TODAY'S DOWN TAPE

1-8-12b_1.jpg


Buying the SP500 today with the market breaching the March 182350 lows to open at 1816 was not an easy task, nor was it impossible. The market provided opportunities intraday for longs to defend. The cash opened at 1816, followed by a squeeze through 1821 to establish a bullish intraday bias which was followed by a shakedown to the reversal window at 181275, offering buyers an opportunity to defend.  This new low and test of reversal window failed to continue lower, seeing a squeeze back through session highs and up to 182850 to test major resistance off the overnight highs of 1832. Failing to get through, the market retraced lower to retest the 181275 session lows which was followed by a small bounce up to 181950. This bounce failed to push through resistance and regain above 1822, seeing sellers take control (read post: Running out of buyers?) and take out the session lows to fall into 180725, squeezing out session longs and luring in late sellers below 181275.  This new low was followed by a bounce up to 181650, once again failing to push through resistance before falling back to 180950 into the close and settling at 181175.


With the market settling 15.50 handles from Thursday's close, actively day trading the SP still allowed to collect 32 handles on all LONG trades.  It is always more aggressive to go against the tape, however if risk is defined and reward opportunity is healthy, a day trader can trade any tape long or short.

Below is the AIM feed sent out to Chicagostock members.

1-8-12b_1.jpg

Tags:
Continue reading
964 Hits

DAY TRADING SP500'S DOUBLE TOP

Both peak highs in 2014 were made on NFP days and only 1 month apart. 

Below are videos on Chicagostock's day trading signals


Trading March 7th Non Farm Payroll Number:


Trading April 4th Non Farm Payroll Number:

Continue reading
3040 Hits

RUNNING OUT OF BUYERS?

1-8-12b_1.jpg

Since reversing off the year lows of 1732 and through December's high to squeeze shorts, the SP coiled in a sideways range in attempt to find new buyers following that V shaped short squeeze.  The first peak high was made at 188750 in March on Non Farm Payroll numbers.  This was followed by a reversal down to 182350 mid March, before climbing back up to 1877 as the pullback was bought and the 6 month pivots turned into support.  Breakout attempt was seen early April, having to take the FRB chair to say stimulus is still needed to in order to trigger new buying to run the market into new highs setting up a jump ball on the NFP numbers that were released early April. New all time high were made by 5 points up to 189250, again on Non Farm Payroll numbers and was followed by profit taking and sellers pressing the market post NFP release. Both peak highs being made going into the jobs numbers that were both followed by immediate profit taking. The last high is more troublesome as new highs were made only to fail to continue higher, seeing a reversal back down to press and retest the March lows of 182350.  First test of this led to a bounce this week on the FOMC release the 6.5% unemployment target for the fed funds rate would be removed.  The initial reaction was an embracement by the market, seeing a bounce up to 1867 before running out of gas and reversing back down to close below the recent low of 183075 prior to that FOMC release.  Once again the market brushing off stimulus promises and a pull of the 6.5% unemployment rate that suggests rates can remain low longer. 

Going forward, pressure is being put now against the prior low of 182350 made in March to shake out longs and confirm a short term double top.  A weekly close below 1850 is bearish and creates a new range of resistance within 1850-189250.  Looking at the action made in 2014, with the early sell followed by the V shaped recovery that was fueled by shorts being squeezed, the market traded above those prior highs for 2 months in attempt to build a base and attract new buyers following the short squeeze. Failure to build the base and hold above the 2013 highs, suggests enough new buyers are not coming in to sustain the V reversal to expand higher.  If new buyers are not coming in, then the bus may be too full and this gives room to expand lower to target the year lows and confirm a failed breakout with major support at 1700 based off the October low.  Failure to hold the 2014 low of 1732, breaks the series of higher lows the market has enjoyed since the last major low of 1553 in 2013 when investors feared tapering before being squeezed up 300 points.  By taking out the last major low at 1732, this breaks the upward momentum, and gives room to move down into testing levels from 2013 and attempting a gap fill down to 1420.  Support off the year lows is seen down to 1750 for buyers to defend.

VIDEO: Watch Chicagostock's day trading signals on both peak highs.

Continue reading
4203 Hits

CAPITULATION LEVELS

Nasdaq futures are staging the ultimate retest as the market is now 500 points from testing major resistance of where the market failed during the dot com bubble. By taking the low of the last major correction at 281775 (May 2013), using the January high of 362525, and the last recent low of 3412 made February of this year as the market’s attempted to breakdown only to fail, this gives upside fib extension levels of where the market can lead to. Thus far we have seen the market extend 38.2% at 3724, being where and what the market is working on now. Continuation of holding above the early 2014 high of 3635, this gives room to continue the squeeze higher as shorts capitulate. A 50% fib extension is met at 3821, followed by 3858 to complete the range expansion from 3635-3412 up to 3858. MAJOR resistance is met within 3900-4230 as the top level of the fib extension, being a 100% extension of the failed breakdown this year from last year’s move up. The first test of this range, should be sold with both hands forward, as this is the first test of the dot com bubble.


Continue reading
3632 Hits

Trading Pivots


Pivots are used to determine areas of reference for support/resistance.  Pivots are calculated by adding the high, low, and close of the determined time period, and subtracting by 3.  This gives a "mean" of the market from that past data. Pivots themselves are not always enough. By adding ranges to the pivot (above and below), this gives an area of cushion around the pivot.  The tighter the range, the more indecisive the previous data was, giving room for expansion of volatility.  In the above examples, the intraday pivots are derived from the previous day's session.  The three day pivots are derived from the last 3 trading sessions.

Continue reading
4101 Hits

Bonds, Gold, and the Fed

1-8-12b_1.jpg


Just a little over a year ago, in December of 2012, the Fed for the first time during its low interest rate policy, attatched a 6.5% unemployment rate to its fed funds rate.  As highlighted in December of 2012, this spooked the gold market, which at that time was trading 1655 with a range of 1526-1798 in 2013.  Bonds on the other hand closed the month of December at 148.  Since this new FOMC policy, both gold and the 30 year bond market front ran the unemployment rate target, seeing gold break its 2012 range of 1526-1798 to expand lower, making lows of 1179 in 2013, and lows of 12723 in the 30 year in January.  On January 10th, 2014, the BLS reported an unemployment rate of 6.7%, down 1.2% from Dec of 2012, and only .2% from the Fed's 6.5% threshold.  So with gold and bonds moving ahead of this target, and now the target coming into play, it only makes sense to see gold and bonds recover and turn the other way.


1-8-12b_1.jpg


30 Year bonds put in a failed breakdown early January as the lows from 2013 of 12801 were taken out down to 12723, and failed to hold.  This has thus far led to a reversal and short squeeze, seeing the market recover above 13100.  Overall trend remains down as seen in longer term weekly chart with major resistance for this trend coming within 13320-13524. Breach of this range will change trend and momentum in the 30 year, confirming the weekly double botom and giving room to retest the March 2013 lows at 14014.

1-8-12b_1.jpg

Gold's 2012 range of 1526-1798 (272), was expanded (272) lower into 1254.  This did not stop as panic selling came in and gold saw a flush down to 1179 before quickly recovering up to 1434. For the next few week's, gold's downside pressure from its new found downtrend below 1526, forced the market to retest the 1179 lows. Tax selling also put pressure into the end of year 2013 as investors sold gold to lock in losses and balance some of their stock gains.  In January, just as the bond market made a new low, gold also made a new low down to 1181.4, however managed to hold the 2013 low of 1179.4 by $2.  This has thus far led to a small bounce, retesting resistance from the prior high of 1267.5 made in December.  Today gold ran into these highs but has fallen short in taking them out by .5.  A move through the December 1267.5 high confirms a short term double bottom and gives room to retest next major resistance up to 1380s based off the 1434 high in mid 2013 before falling back below 1200.  This 1380-1434 level will be huge for the change in momentum and trend. As a break above this confirms a double bottom and gives way to retrace back up to and retest the 1526 level from where the market failed. 

Just as in December of 2012 with gold at 1655 and 90% of community being bullish after 90% was bearish sub 1000, this did prove correct and we did see a correction down to 1179. So at 1179, down $744 off the highs and unemp rate reaching 6.5%, is this the time to be short gold? Opposite as majority of community is back to being bearish metals, this is the time to start looking back into gold, and picking up physicals.  A flush below 1179 can still be seen, but should provide opportunity for longs as a reversal after the flush would be expected.

Continue reading
3950 Hits

Copper VS SP500 UPDATE / Equity Tops

1-8-12b_1.jpg


The spread between copper and the SP500 is now down to 5410 after hitting highs of 5679 in November.  This high marked a 25+% move higher in the SP500 and a 13-% move down in copper for the year of 2013.  Copper, known to be bell weather of economy as it shows industrial demand, tends to be a leader for the equity markets.  The fact that it was down this year as the SP500 diverged higher shows the move in equities was fueled only by QE as opposed to underlying macro.  Going forward, a breach of the August low in this spread confirms a failed break out with reversal attempt to cover/buy copper and sell the SP500.


 1-8-12b_1.jpg

After breaking through the daily pennant created after the May correction that was followed by higher lows and higher highs, the SP500 traded in a tight range of 173650-177450.  This range of (38) was expanded higher as market broke above and turned 177450 into support, completing its target of 181250 to the tee with highs of 181250.  This was followed by a pullback to retest the 177450 level that held at 177775, followed by another retest of highs.  The retest was seen on the December release of the November NFP # that fueled the market to retest highs.  This retest fell short at 181150, seeing a rejection to take out the 177775 low, confirming a short term double top.  Market is now ont he edge fighting to hold above 1760 as this 1774 level becomes new resistance with the double top trapping longs and putting pressure lower.  Continued weakness below 1774 gives way to target the bottom of  old range at 173650 for stops.  Failure to hold 17360 can see the 1774--1736 range expanded down to 1698, into the bottom of the daily pennant and a test of the 100 day moving average which has not ben touched since October.


Continue reading
913 Hits

SP500 & VIX

1-8-12b_1.jpg

The SP500 completed its 181250 melt up target after breaking out of its 177450-173650 trading range.  This range of 38 handles was expanded to the upside, giving the 181250 target after the SP broke through the top of the channel at 177450, followed by turning the level into support on November 20th.  Since touching 181250, the SP started the month of December on a softer note.  These highs were retested, only to fall short at 1809 before reversing to take out last week's lows.  Melt up continues with support at 1794-177450 holding.  New resistance based off most recent highs comes in at 1802 with buy stops above 181250 to give way into next fib extension at 1818.29.  Breach below 177450 confirms a short term top to give way and target the bottom of the range at 173650 to shake out the long side.  Breach of 173650 gives way to then expand 38 handles the opposite way, giving room down to 169850.  As of current, the SP500 is up 392.5 for the year, or 27.6%, with 9 months in 2013 as green months, and only 2 months of corrections.  Last month of the year, we will find out if Santa Claus looks to book some profits.


1-8-12b_1.jpg


Volatility index giving some warning signs.  After taking out a long term support trend line from the March lows, falling down to 11.99 last month, this quickly turned into a head fake as volatility squeezed back to 13.94.  This first attempt to squeeze 14 resistance failed as volatility retreated to retest the 11.99 lows, finding support which has led volatility to now break out of 4 week highs, confirming the 11.99 low as a failure. New support now seen down to 1330, followed by 1290. Weekly close above 1436 gives way to expand 1436-1199 (237) up to 1674. For the year of 2013, the VIX has a trading range of 11.05-21.91 and 18.00 to be flat for the year.

Continue reading
932 Hits

DAILY EQUITY CHARTS FOR NOV 18 2013

(click chart to maximize)

1-8-12b_1.jpg

Continue reading
2524 Hits

2013: SP500 +25.6%, Copper -13.7%

1-8-12b_1.jpg

Copper VS SP500 spread breakout above 40 to start 2013 now up 45%.

For 2013, the SP500 is up 25.6% with copper down 13.7%.

Continue reading
3663 Hits

SP500 & Yen

1-8-12b_1.jpg

As seen above, the SP500 has enjoyed higher lows and higher highs ever since its biggest correction of the year.  This correction attempt started in May, dropping the SP from 168575-155325, 7.9. Since then, we have been in this trend where higher lows have been made as pullbacks become shallower with buyers chasing the market up, and higher highs as shorts have been squeezed with the market taking out the previous highs.  Anytime someone is forced to chase a market, it never ends well. The latest squeeze came as the market pivoted off 1640 and ran in the face of a government shutdown and the constant debt ceiling debate.  With the September highs taken out, highs of 175450 were made this week on the NFP number release, pushing the market above its rising wedge, and testing fib extensions of 1740-1749.  Wednesday attempted to see a pullback only to see the market saved as it held 1736 which has the market back to pressing the highs of the week.  This is consolidation taking place as the market attempts to take a breather, yet continues the pressure against shorts and forces buyers to pay up.  Push through the weekly high sees the next major resistance levels coming in at 1776 as a 100% fib extension, along with 1783 as a 50% fib extension based off the year low to the September high and October low.  Falling below 1736 as a healthy market should, would give way to retest old resistance at 1710 and attempt to build new support. Without this happening, it forces buyers to continue to pay up, which gives way for them to chase these highs and next fib levels to be tested.  The trend of higher lows and higher highs since the May correction has not only seen buyers desperate to buy every dip, but also brought major pain to short sellers in attempt to clear them out of the market before the carpet is pulled from underneath.  The second half of the year remains in a "bullish bias" and any pullbacks down to 1620 would give buyers a major area to support this bias and keep the momentum. The question is if there will be any buyers left after the market has forced them in with this rising wedge.  It will take a period of 7 closes below 1620 to reverse the bull bias and give way to target the June lows for the rug pull and move to fill the gap that began this year down to 1420s.


1-8-12b_1.jpg


As the SP500 hit a top in May and pulled back, the Japanese Yen in contrast hit a low and squeezed 10 handles off the low.  This was followed by a pullback to retest the lows, and ever since then, as equities have gone higher, the Yen has traded sideways and compressed as the 200day moving average on the daily chart has caught up.  Since the Yen's original move was from 126 - 96, it is in a bear trend and this sideways action is consolidation of the trend and an attempt to reverse or see continuation of the trend.  Currently, the Yen is retesting the October highs of 10357 that rejected the test of the August high.  As this spring is compressed, a move above the October high gives way to reclaim 104 and force shorts to cover, giving way for a retest of the June highs at 10663.  Reclaiming these highs gives confirmation of a reversal in this bear trend and sees room up to 118 to fill the gap created in November of 2012, just as the SP500 has it's gap of 1420 from December of 2012.  Recall the Yen attempted to bottom out at 10340 in March, only to see the Bank of Japan come out with new stimulus that derailed the reversal attempt and slammed the market into new lows down to 9640 printed in May.  The squeeze in June led to the BOJ announcement levels which was rejected. This is a major level as a recovery above this is a recovery in the Japanese Yen. Bottom line, for the week, need to see buyers sustain current bid to see new buyers step in next week and close above 104 to squeeze shorts. Failure to hold above 104 and break of 100 sees a retest of the May lows.

Continue reading
3019 Hits

The American Revolution and the SP500

1-8-12b_1.jpg


The SP500 is back at pressing last month's, keeping the rising wedge of higher lows and higher highs since the May correction.  Putting the market back in the hands of sellers to defend just as a deal on the debt ceiling is made.

The last high at 172675 capitulated shorts above its previous high of 1705 as the Fed surprised the market with no taper and no Larry Summers.  This was followed by a pullback which failed to see buyers materialize inside 1680s as the gap was filled post shorts being squeezed.  Establishing a weekly bearish engulfment and eventually grinding down into lows of 1640 to test last and major support based off the 162475 August low.  Sure enough this held to see the market develop a reversal that was fueled by talks of a deal taking place on the debt ceiling. Shooting the SP 60 points back to retesting major resistance within 1710-1715 from the failed high in September.  Just as the SP tests this major resistance, Congress has struck a deal with less then 14 hours before the debt ceiling was to be breached.  Many are looking for sell the news to take place, and the test of the September highs here is the true tell as to whether buyers can continue to support prices to push through sellers now coming into defend this resistance. For the market to reject this test of the September high, a quick reversal needs to be seen to fall back below 1690 to give way to test support at 1658 based off the 1640 lows.  The longer buyers can support prices at these levels, the more pressure to squeeze out the September high and put in another higher high.  Should this take place, we see next major resistance levels coming in at 1740 as a 76.4% fib extension, and ultimately 1776 as a 100% fib extension.  Keeping in mind the May high at 1685 that led to the biggest correction of the year was also a 100% fib extension.  This would be ironic to see the market reach for this number, the year of revolution/America's birth, just as Congress' approval ratings drop to all time lows and they continue to kick the can down the road with no real solutions on cutting spending or the debt.

Continue reading
2700 Hits

How the 30 Year Front Ran QE2-QE3-Taper

1-8-12b_1.jpg


As seen in the above chart, every move regarding QE was front run by the bond market, with the exception of the 1st QE in 2008 that pumped bonds from 112 to 141. When QE2 was announced the market moved lower, from 135s to 116s. September 2011 "operation twist" was announced, with the market having front ran the news 30 points higher to 147.  This eventually led to a period of consolidation as the market dropped to 136 before running up to new highs of 152 just in time for the announcement of QE3.  Another pullback was seen, down to 140 as the news was sold.  With talks and rumors of tapering QE in 2013, this accelerated the downfall into lows of 128, below its 200day weekly moving average.  In September 2013 the Fed surprised the market by not tapering QE.  This led bonds to unwind and squeeze shorts, reversing from 128-133, back to retesting major resistance at the 200day moving average.  The reversal and squeeze of shorts gives new buyers an area to defend down using the lows below 128 as the exit.  Objective would be to retrace 50% back to 13900. If the bond market did get oversold as it got ahead of itself expecting no tapering, then the retracement seems reasonable, maybe even to front run another meeting of no taper or even increase of purchases.


1-8-12b_1.jpg


As seen in chart above the 30 year recovered its highs of 13316 from August 27th, rounding out a bottom.  This reversal back through this high was done by the surprise of no taper and shorts being squeezed. Over the past 2 weeks the market traded sideways in attempt to consolidate the reversal and build a base for new buyers to step in.  The longer the market holds above 133 the more of a base it builds and shorts it lures to force a squeeze.  New buyers have to step in to build this base for a breakout to expand the 133-128 range.  This expansion of 128-133 that shorts were squeezed from, gives room for new buyers to target 138-138, also a 50% retracement of the bond market from the May 2013 break down. First downside support seen at 13130 based off 12812 lows. Failure to hold lows shows a failure by buyers to step in with next major support at 12630, 12100.

Continue reading
2843 Hits

Knock-Knock

1-8-12b_1.jpg


As seen in the above chart, since the biggest correction of the year - 1685-1553, the SP500 has made higher lows and higher highs.  These higher lows have come as the pullbacks became more shallow with buyers desperate to get in the market.  After putting in a flat top at 1705 in July and falling down to 162475, this was the second higher low after June's lows, and ultimately led to another higher high.  The new highs were made as the Fed surprised the market with no taper and no Summers, capitulating shorts as the SP500 briefly took out the top of this pennant up to 172675.  Since then, the SP failed to sustain the move, reversing to fall back to where it broke out into those highs at 1682.  Coming back to this level gave new buyers an area to defend the pullback after seeing shorts squeezed up to 172675.  Thus far, buyers have had a hard time turning the market back up.  This has led the market to fall into its rising trend line from the June lows, giving another attempt at "higher lows".  This time around, this trend line should not hold.  Why? Because not only did we have a failure to sustain the move into 172675 to create a bearish weekly engulfment which have given bears an area to defend up to 1690s, but we also have bulls who are attempting to buy this dip in front of politicians attempting to come up with a deal on the government shutdown.  Politics and markets never make a good combination. The bull buying the market now has to factor in this risk.  Friday saw the market close on its highs as algos squeezed shorts and bulls hoped for a weekend deal on the government shutdown. When this did not happen, the SP opened 8 handles lower on Sunday, putting in the 2nd Sunday in a row where the market gapped lower.  This has led the market to once again knock on its support trend line where bears are looking to breach the level and chase down to take out the June lows of 162475. Once this takes place, buyers from these levels will be shaken out and the market will confirm the move up to 172675 was a failed higher high.  From here the projection can be seen for a retest at 1690 to develop a right shoulder for a head/shoulder topping pattern. For this to take place again, the market must confirm weakness by taking out the August lows and breaking this trend of higher lows and higher highs.  For shorts to squeeze, 1692s must be taken out, which can then give way for a test of major resistance into 1710s.  A strong bear in control will not allow this to take place. The market now has someone to blame when moving lower, and that will be the GOP, while "no taper" decision will look smart, when in fact, thus far it has marked the highs.


Tags:
Continue reading
2528 Hits