Chicagostock Trading

Chicagostock Trading

SP500 Market Update

 ES________Daily___12_23_2011___6_26_2012_copyA.jpg

click chart to enlarge

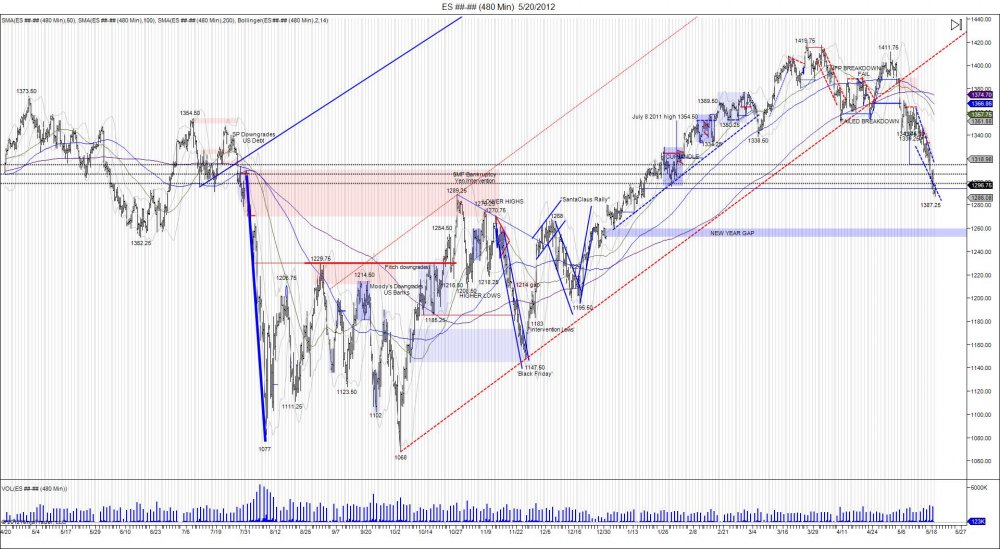
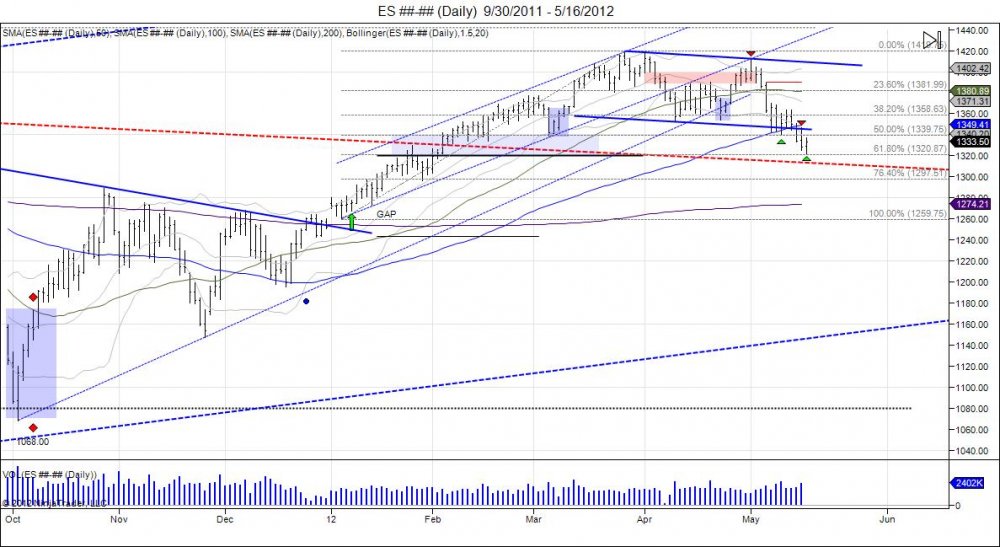
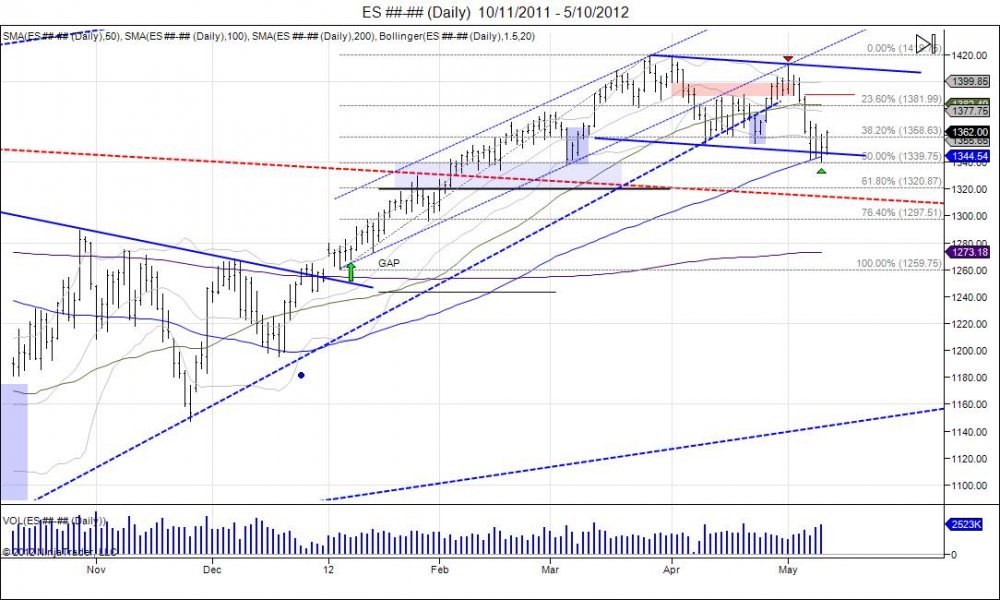
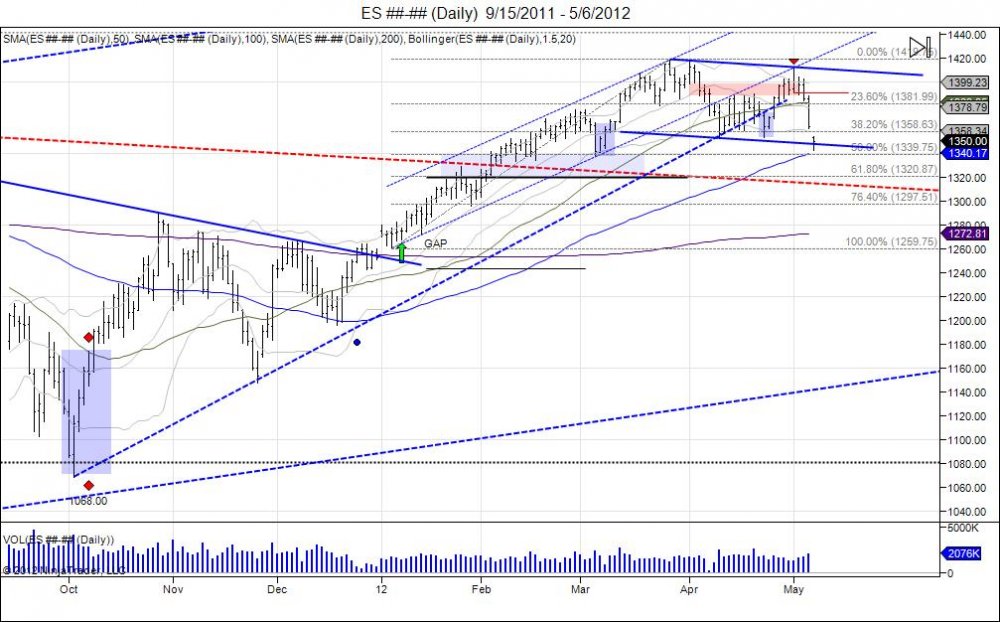
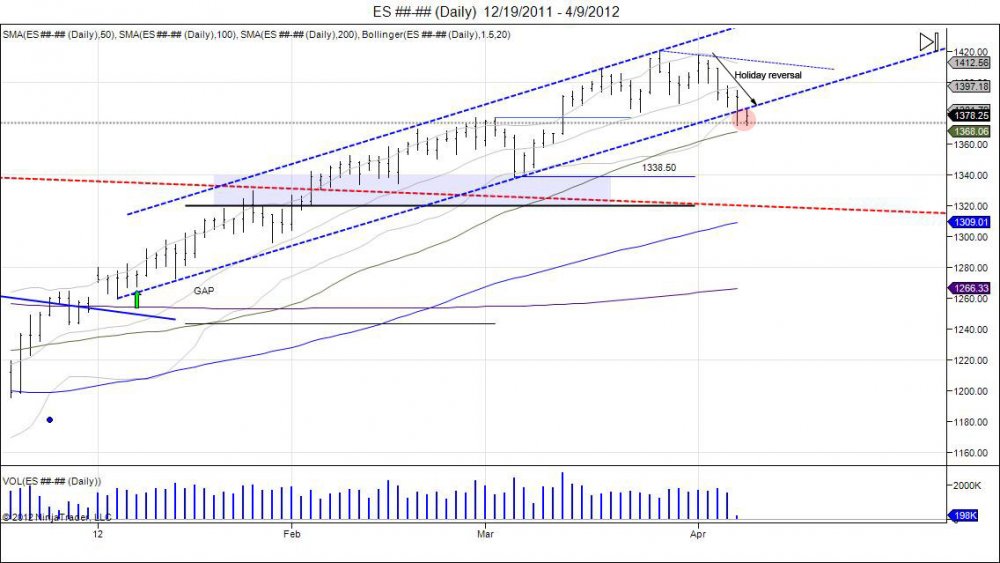
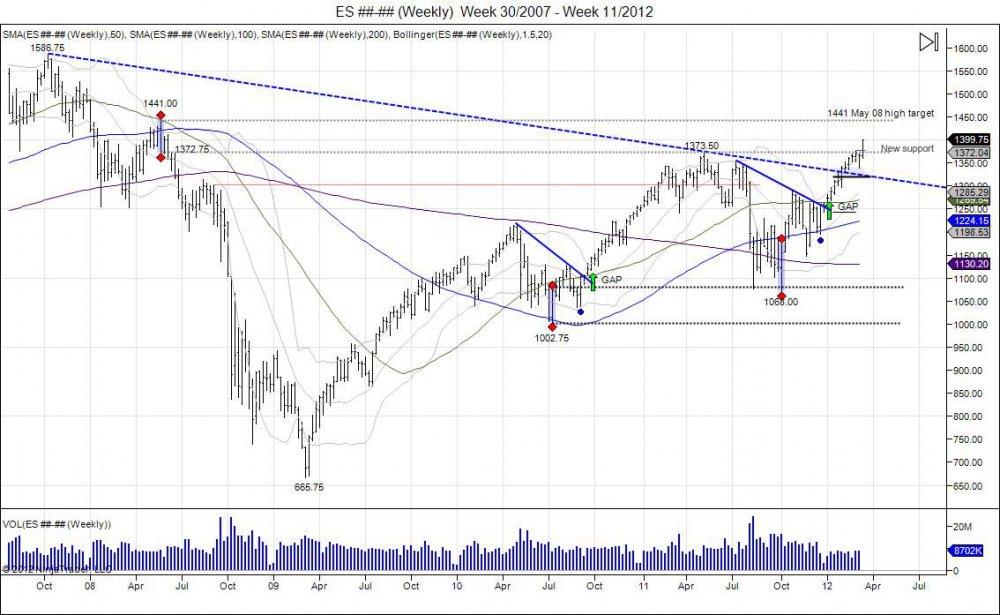
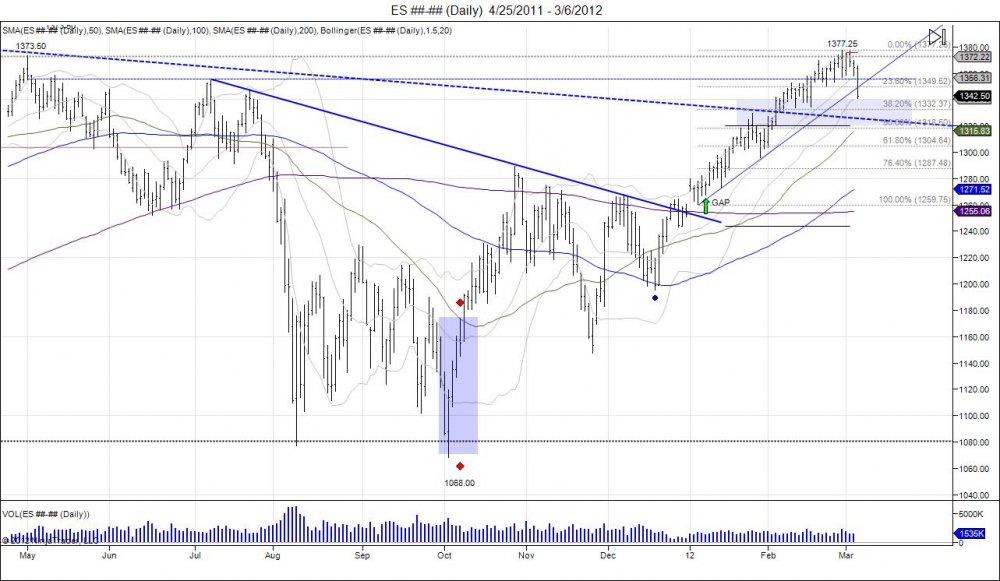
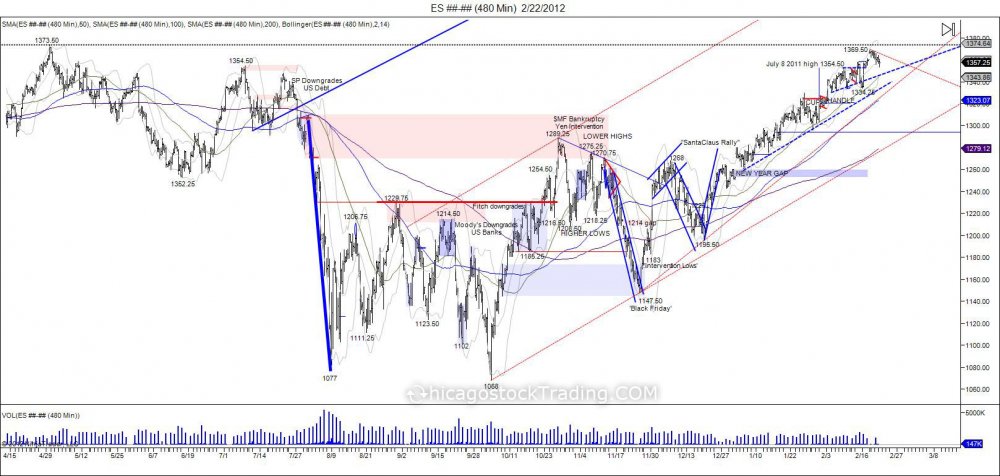
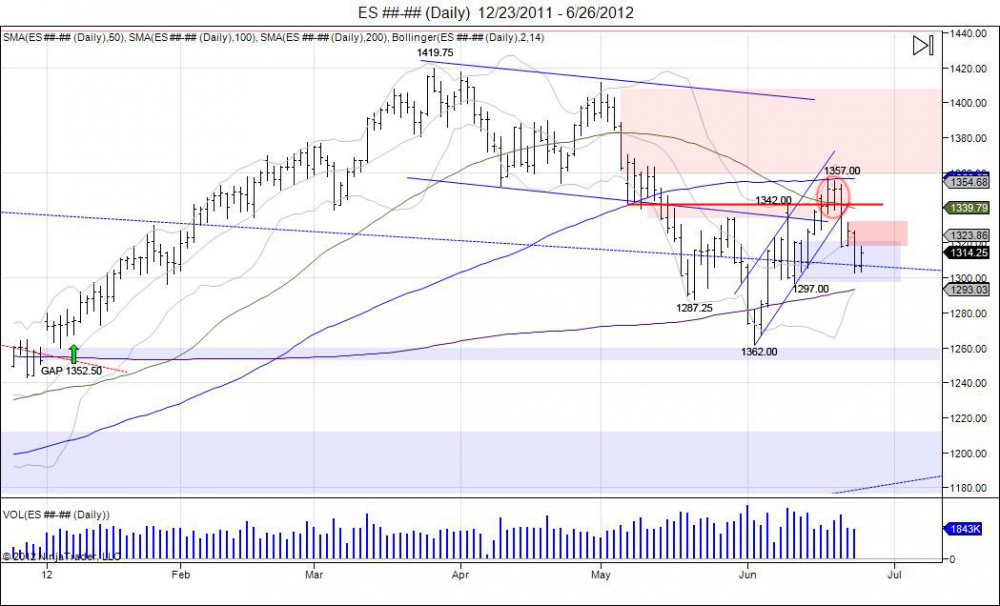
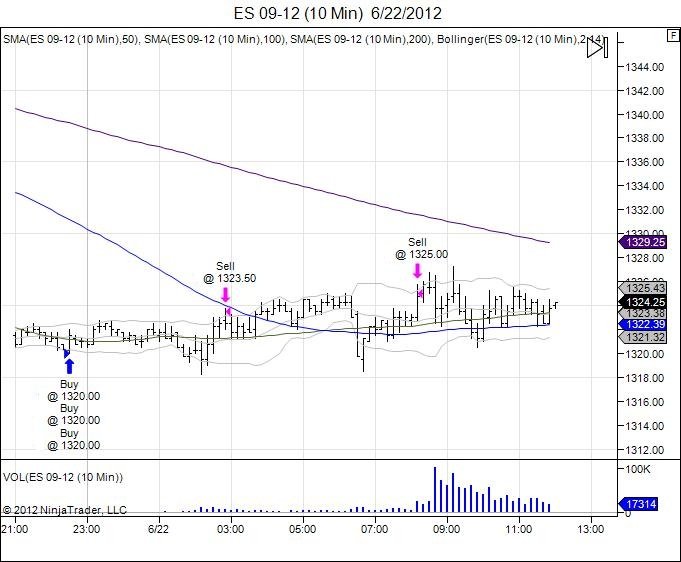
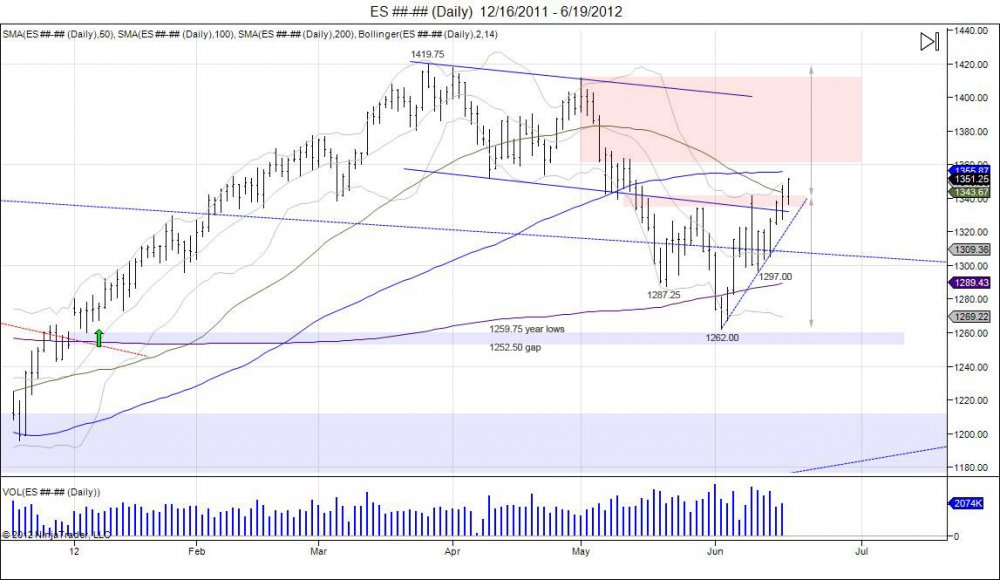
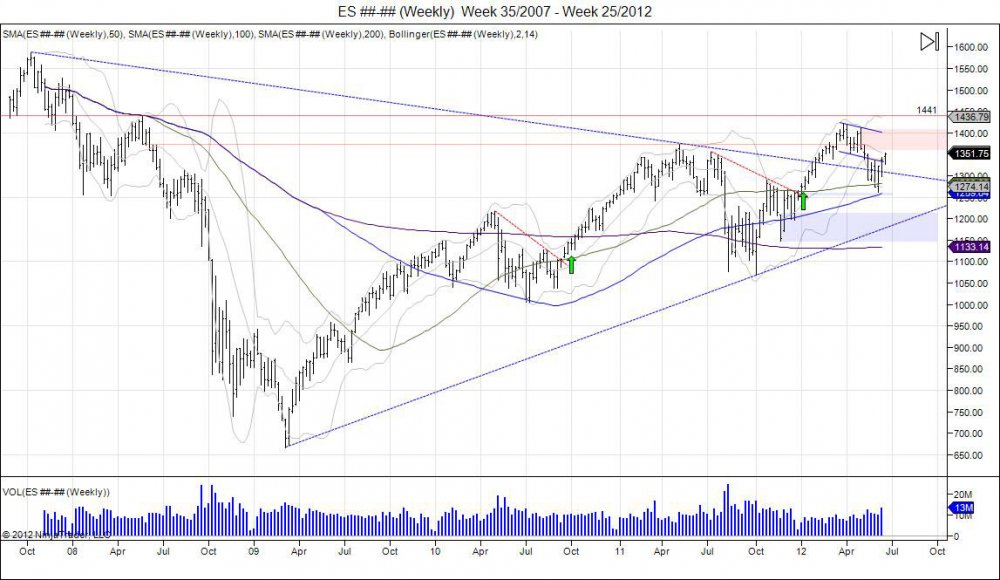
On Tuesday the SP500 worked its way higher after a test of the week low 1302.50 held, catching shorts off guard which led to a short squeeze right into testing Friday's lows of 1318.25. This is where the market paused following last Thursday's break lower below the rising channel which was followed by a brief pause seen on Friday as the market held and traded higher causing shorts to cover into the weekend.  On Monday the move down was continued and sellers chased the market lower. Tuesday we saw once again a hold and a trade higher causing shorts to cover, only to lead right into where the market failed on Friday within 1318.25-1331.75.  This is a major range for buyers to squeeze through to show strength and attempt to retest where the market failed at 1336.50-1357.00 as the market tested its 100day moving average which kept a lid on prices and has the market now pressuring against retesting the 200day moving average along with the right shoulder of 1297 built on June 12.  Tuesday the market did show potential as sellers were unable to put in a new low for the week, causing a intraday U turn which built a handle and pushed into highs of 1318.  This push into 1318 is knocking on the door of resistance and is giving sellers their area to defend. Buyers have Tuesday's lows as their reference point to defend pullbacks and use this turn around to attempt to swim against these trends and squeeze through these resistance levels of 1318, 1327, 1336, 1390. Downside support is seen at 1310, break below 1297 gives room to retest the June lows with support at 1282. In the big picture, this is a retest of the inverted head/shoulders that was created mid May into mid June, offering buyers their levels to defend. Failure to do so and a break of the June lows sees room down to next major support at 1209.  We believe this pullback offers opportunity for buyers to step up and trade the long side, scaling out against upside resistance levels and adjusting stops accordingly. The inverted head/shoulders within 1342-1262 offers a 80 point range, if added to 1342, this targets 1422 which is a retest of the year highs at 1419.75.  Ultimately this will give room to run stops against the main May 2008 highs of 1441 which was the reversal that led into the lows of 665.75.  Failure to hold the 1297 level gives the room into retesting those 1262 lows where a break of this gives room to fill the gap from last year down to 1252.50 which puts the sellers into control. The 2nd half of the year begins in July, and how the market trades in the first two weeks will set the tone for the remainder of the year. 


Tags:
Continue reading
3938 Hits

Today's ES Trade

ES_09_12__10_Min___6_22_2012a.jpg 

Update: Runners see 1329.75 upside objective met. Adding 9.75 on top of 8.50 locked in. Total of +18.25. Runners don't always play out, but objective is to reduce exposure, take profits along the way, and allow runners to work where if they do, they pay as much as the first and second target combined.

_________________________________________________

ES_09_12__10_Min___6_22_2012.jpg

Yesterday's market action dropped into the 1320 support level with an intraday low of 1317.50 as the market squeezed out the downside. Overnight the trade was a long at 1320 and we have seen Thursday's lows hold providing oppurtunity to lock in intraday objectives on the top side at 1323.50 and 1325.00.  Two thirds of the trade is out and the runner is now doing the heavy lifting with a risk free stop at 1320 and an objective of 1329.75 on the upside. The market is trading very narrow as buyers are swimming upstream and sellers are fighting to break the market lower to close out shorts and lock in profits. 

Tags:
Continue reading
2722 Hits

SP500 Market Update

 ES________Daily___12_16_2011___6_19_2012.jpg

The SP500 is back at trading the levels from where it broke down early May around 1350.  The market broke its channel at that point and fell into lows of 1287.25 May 21st, before seeing a small bounce that failed to regain the broken channel and was pushed back down to a new low.  Lows of 1362 were made, holding the year lows of 1259.75, and keeping the gap from last year down to 1352.50 OPEN.  This caught another bounce into 1342 on June 11th which was followed by another pullback that retested the lows.  The market came down to 1297.00 and found support, in turn building a right shoulder as it retested the 1262 low and has built an inverted h/s formation.  Since this right shoulder low the market has grinded higher and is now trading through its neckline of 1342, putting the market back within the channel it broke early May.  Taking this range of 1342-1262 gives us a range of 80 handles, adding this to the neckline of 1342 sees an upside target of 1422 which targets the year highs of 1419.75.  Recalling the upside target of 1441 being the May 2008 highs, the market stopped right at its last level of defense against this high which put in the highs this year at 1419.75.  We went into correction off the level and retested the lows of the year, however keeping the gap open has kept the potential to retake 1441 still there.  With a new target of 1422 now the market is working its way through heavy resistance and sellers. Doing so will give room to finally complete that May 08 high of 1441.  The bounce here is retracing the market to where it failed in May, so this will be an uphill battle as it comes back to where we failed within 1361-1411.75 as the range for sellers to defend. Failing to continue this move higher and falling back below 1297 puts the lows of 1262 in sight followed by the year lows of 1259.75 and the gap of 1252.50 to derail this bull.

ES________Weekly___Week_35_2007___Week_25_2012.jpg


Continue reading
3217 Hits

Day Trading into Swing

ES 06-12 (60 Min)  6_6_2012_1.jpg 

On Tuesday there was a buy recommendation of 1271 with targets of 1278, 1285, and 1308.  The first 2 targets were completed intraday which allowed to take money and risk off the table by then moving stops to breakeven at 1271 for the last runner target of 1308 to be ran.  The third target or runners are always the gravy or cherry on top of everything as these give profits larger then the first two targets combined. Sometimes they work out, sometimes they don't. However to take out the greed, thought of "should I hold on, should I get out", taking money off the table along the way eliminates this and leaves a position that can continue to gain should the market continue to move in that direction.  On Wednesday the market ran up to 1299 and this was good enough to take off that 3rd target for a gain of 28 handles, totalling 44.5 handles.  Sure enough the market ran to 1308, however no complaints. 


Continue reading
3598 Hits

Ultimate SP500 Chart 480

ES________480_Min___5_20_2012.jpg 

Tags:
Continue reading
2239 Hits

SP500 61.8%

 ES________Daily___9_30_2011___5_16_2012.jpg


Tags:
Continue reading
1179 Hits

SP500 Daily Channel and 50% Retracement

 ES________Daily___10_11_2011___5_10_2012.jpg

Tags:
Continue reading
1131 Hits

SP500 Channel

 ES________Daily___9_15_2011___5_6_2012.jpg

Following the bounce seen the last week of April off the 1354 lows, the market rallied into retesting its daily channel that was broken on April 6th.  The bottom of this channel was hit on the tee as the market put in highs of 1411.75 and failed to move past the level, only to be rejected and turned lower.  Thus far we have seen the market break off this rejection and fall back down into taking out the stops below the 1354-1352.50 lows.  This has the market now testing the bottom of a newly created channel based off the March - May highs.  This test of this bottom channel also sees the market nearing a 50% retracement of the 1259.75-1419.75 rally at 1339.75.  Support should come into play at this bottom range to bounce this market back into retesting the market from where it broke down at 1390-1411.  Failure to hold these levels puts the next major support into play being the 1320 level from where the market broke out of in February, also a 61.8% retracement level.


Tags:
Continue reading
2617 Hits

SP500 Retraces NFP Breakdown

 ES________60_Min___4_26_2012.jpg

Tags:
Continue reading
2645 Hits

SP500 Market Update

 ES________Daily___9_9_2011___4_25_2012.jpg

 click to maximize

more...

Tags:
Continue reading
2217 Hits

SP500 Targets NFP Breakdown 1395s

 ES________60_Min___4_17_2012.jpg

click to maximize

more...

Tags:
Continue reading
1945 Hits

240 Minute SP500 Chart

 ES________240_Min___4_11_2012.jpg

click chart to maximize


Tags:
Continue reading
969 Hits

SP500 Daily Channel Jeopardy

ES________Daily___12_19_2011___4_9_2012.jpg

click chart to maximize

more...


Tags:
Continue reading
2461 Hits

SP500 2011 & 2012 Breakout Compared Again

 ES________Weekly___Week_30_2007___Week_11_2012.jpg

click chart to maximize

more...

Tags:
Continue reading
3485 Hits

SP500 Levels

 ES________Daily___4_25_2011___3_6_2012.jpg

more...

Tags:
Continue reading
2406 Hits

SP500 Chart May11-Feb12 480 Minute

 ES________480_Min___2_22_2012.jpg

Click chart to maximize


Tags:
Continue reading
2553 Hits

SP500 Video @ Nasdaq with notes

Click chart below to maximize.                                                        

  more...

Continue reading
8731 Hits

Positive NFP # and +19 overnight daytrade

ES________5_Min___2_3_2012.jpg


Non Farm payroll numbers released this morning showing an increase of 243k jobs and unemployment rate of 8.3%.  This let the market to rip through 1330 into highs of 1336.75. Rewarding overnight buyers:

more...

Continue reading
1615 Hits

Bounce off 50% retracement- Emini SP500 Daily

 ES________Daily___6_13_2011___1_30_2012.jpg

more...

Tags:
Continue reading
3611 Hits

SP500 Chart 1/12/2012

1_8_12.jpg

Tags:
Continue reading
2898 Hits