Chicagostock Trading

Chicagostock Trading

SP500 6 Month Vol Windows & Pivots

 05_22_jpg.jpg

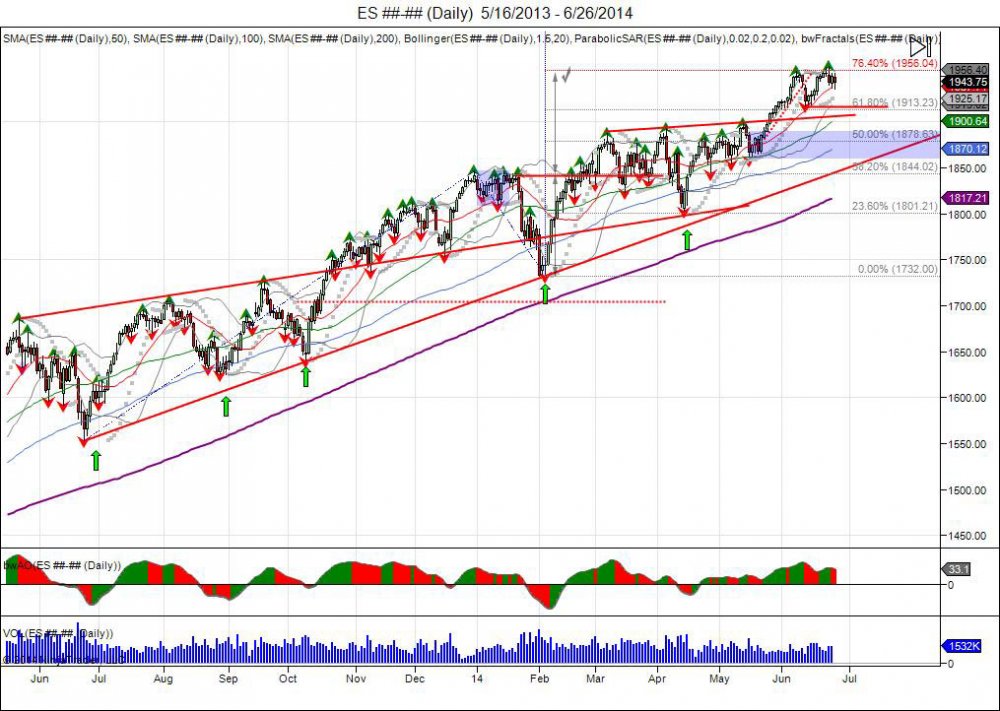
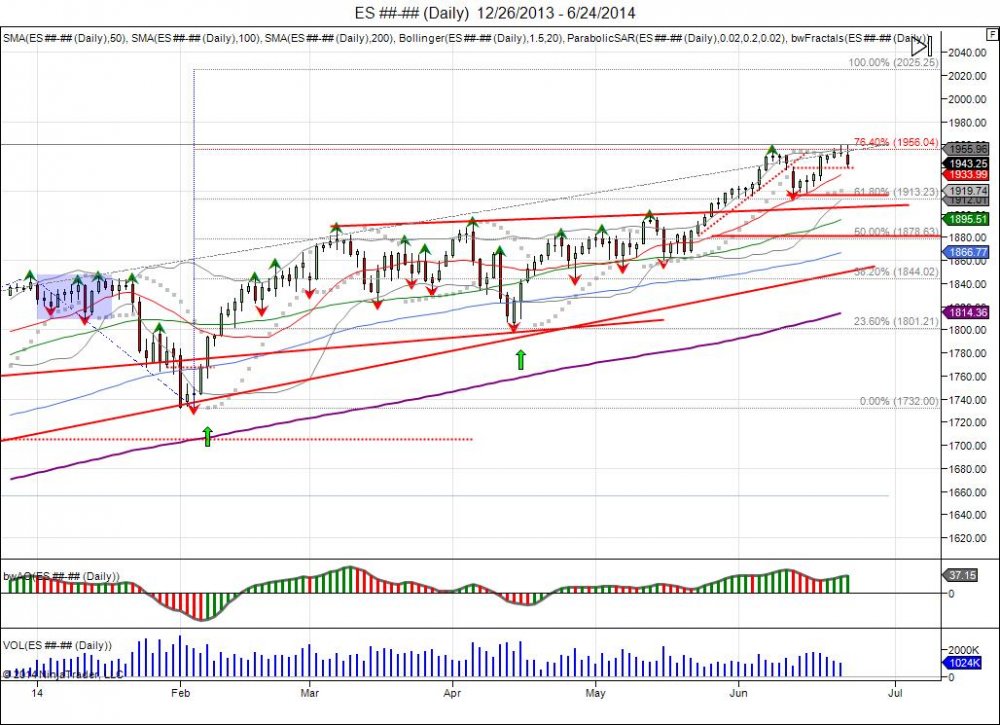
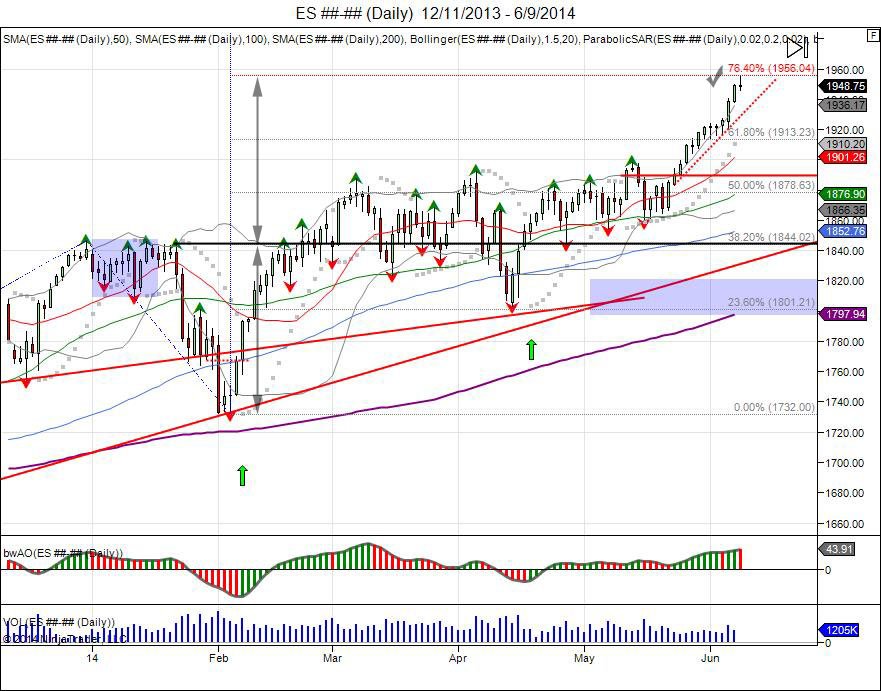
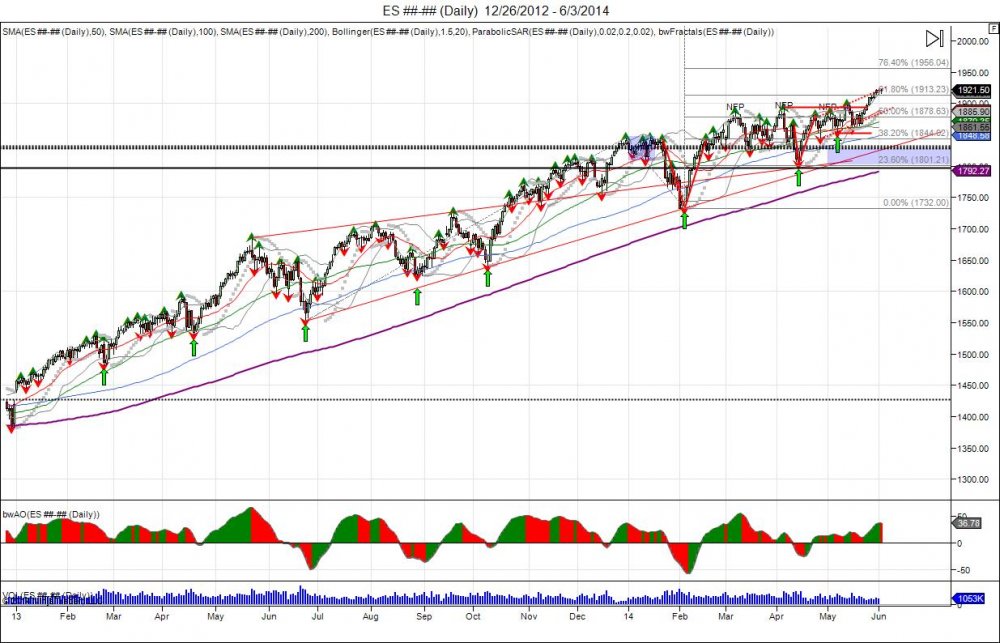
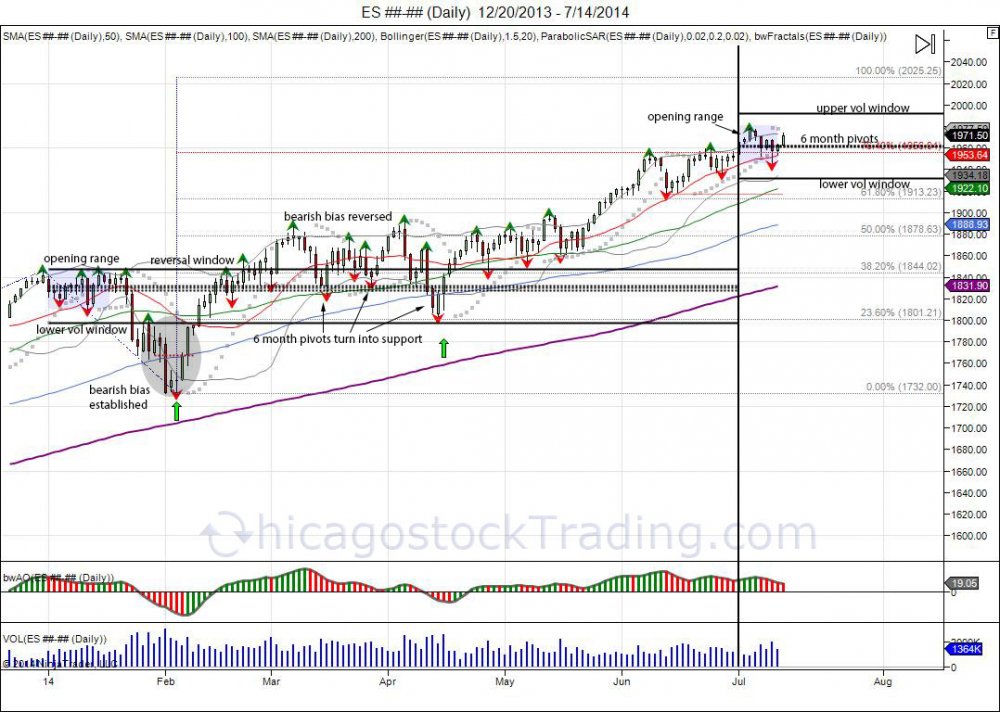
The second half of the year kicked off this month with the SP500 seeing a spillover effect from the 1st half’s close in June with the market printing a new high of 1978 during the July 4th holiday.  The first half of the year began with the market liquidating to breach its lower 6 month vol window at 1797 to establish a bearish bias, enough to lure in shorts, making new lows on the year down to 1732.  The breach of the vol window was used as a bear trap as the market put in a V bottom with lows of 1732 and squeezed through its 6 month reversal window of 1847 after establishing the bearish bias below 1797.  By holding above 1847, the market reversed its 6 month bearish bias for the 1st half of the year, and forced shorts to have to cover as the 6 month pivots turned into support and the market stabilized above 1800.  Going into the close of the 1st half any shorts that were left were forced to through in the towel which led the market to squeeze out of its 3 month range and breakout through 1900 and into 1978.  With the 2nd half of the year beginning, the SP has traded in a very narrow range, within 1978- 1945.  This has established a new set of volatility windows and 6 month pivots for the 2nd half of the year.  The upper vol window coincides just below the psychological 2000 level which if breached, can establish a bullish bias to lure in longs and attempt to complete a 100% fib extension from 2013 low of 1553 and this year’s low of 1732, up to 2025.  The lower vol window coincides with the late June lows of 1936, just before breaking above 1956 and setting new highs.  Failure to hold the lower vol window shows the breakout above 1955 as a failure and gives room to retest next low down to 1917, followed by old resistance at 1900 in search of new support.  The 6 month pivot for July-December is extremely tight due to the opening range’s indecision, giving way to break out of this range and for volatility to expand. 


Tags:
Continue reading
982 Hits

Stocks and Volatility Shorts on Tight Rope

05_22_jpg.jpg 

SP500 futures have been in limbo after completing the 1955 target based off the January-February range expansion (1844-1732 = 112, 1844+112=1956).  This level has also coinciding with a major fib extension at 76.4% based off the May 2013 low (1553) to the December 2013 high (1846) and the February 2014 low (1732).

We know this year started off sideways from last years close, which was followed by a massive liquidation from 1844 down to 1732.  This selloff was reversed, with the market recovering above 1844 to squeeze out shorts.  The reversal above 1844 created the plateau to allow new buyers to come in and support prices to attempt and expand the 112 point move down up into 1956.  After 3 months of sideways consolidation and bear traps, the market printed new highs in May at 189850 followed by a low of 1859 that barely held its May low of 185450.  By holding this low, the market managed to reverse and squeeze through 1898, giving way to breaking outside of the 3 month range and expanding up to complete the target as shorts once again were squeezed.  The ECB came out on the 5th of June to cut rates to negative, giving the boost in the SP to hit 1940.  The following day was the Jobs report on the 6th of June which continued the move into highs of 184975. Spilling over into Monday, highs of 195475 were made completing the range expansion and meeting the 76.4% fib, give or take a point.  The futures rollover from June into September saw prices rollover with, falling down into 1917 to test the June lows and hold, before reversing back up as the September contract became the front month and went toward to meet with its 76.4% fib as well. 

Highs of 195975 were made during last Sunday's Globex session that further squeezed shorts after September took out the continuous highs. Since this Globex high, the cash market opened lower only to rally back and retest this high, making a new one by a tick at 1960 before going offered down to 1936.  Over the past 2 trading days the SP has fought to hold above 1940 as it attempts to defend the reversal off the 1917 lows and develop a base to squeeze shorts through 1960.  Buyers at the 1940 level need a move through 1960 to be rewarded based on their risk of defending the 1917 low.  Doing so, gives way to the next major fib level of 100% at 2025.  Failure to hold 1940, gives way down to target the 1917 low made last week.  Failure to hold 1917 confirms the new highs as a failed breakout with buyers that will be forced to liquidate which gives way down to retracing into the May breakout at 1890 to allow buyers to defend.  This would be alot healthier to the market as it would allow buyers a opportunity to buy a dip and use a break of the May lows as their exit, as opposed to forcing buyers to chase above 1960 in which will continue the capitulation of shorts and parabolic squeeze. It is the struggle to accept 1950.


unemp1_7.jpg


It is important to pay attention to VIX futures here.  After taking out multi year lows and falling below its trend line from the 2013 lows, VIX fell into 1073 early June, before bouncing up to 1289 in an attempt to come back.  This early attempt was rejected and VIX was sold down to make new lows (as the SP made new highs), falling down to 1034 before seeing a push back to highs of 1233 on the 25th of June.  It is interesting to note the take of the Volatility Sonar report from Optionmonster TV that highlights July call sellers in the VIX futures and an absent of what they call the "call stupid buyer" that has been buying premium in VIX not show up on that particular weakness from the 25th.  Jamie Tyrell explains how VIX can turn higher toward the end of the video.  Thursday saw VIX press against highs of 1251, nearing that 1289 June high, before backing away. Shorts in Vol should be concerned as a squeeze through the June highs forces shorts to cover as the June lows setup a failed breakdown, giving way for a move to retest the April range of 16-18.  

This was our projection of VIX just a little over a month ago: http://stks.co/p0M9e


Continue reading
3693 Hits

What Tuesday's Reversal Means

 05_22_jpg.jpg


On Tuesday, the SP500 put in whats called an "outside reversal bar". What this means is the market took out its prior high, however failed to hold and reversed to close below the lows.  This comes after seeing last week the contract rollover from June into September, see the market sell off down to 191750 after the June contract reached its 76.4% fib extension and 1955 target with its 1954.75 high.  The market recovered after the rollover lows of 191750 last week and ended the week with the market taking out the continuous 195475 high up to 195675. This allowed the September contract to meet its 76.4% fib. Monday saw a continuation of this squeeze overnight with the Sunday globex trading seeing a squeeze up to 195975 and Monday's cash open lower. Tuesday saw the market retest this globex high, take it out by a tick at 1960.00, and fail to hold, falling down to take out the cash open to reverse the market, falling into major support at 1941.  Going forward, this reversal not only caught longs off guard, but has also left some shorts on the sidelines with Tuesday's retest of Sunday night's short squeeze.  The close below 1950 has turned the level into new resistance with pressure against 1941 based off the 1917 low made last week. The reversal down to 1941 allows buyers a retest of major support to defend and prevent the 1917 lows from failing.  Bulls must now get through 1950 resistance and recover the failed 1960 high to regain momentum.  Failure to hold 1941 support gives way to target last week's 191750 low to squeeze longs and confirm the daily new high as a failed breakout. This would be a front run ahead of next week's NFP report with the downside chase to squeeze longs and lure in shorts below 1917.  Failure to hold 1917 gives way to break the June 191375 low and put in a reversal for the month, giving room down to retest major support within 1890-1880 based off the May breakout. 


Continue reading
2535 Hits

SP500 Completes 1955 Objective

05_22_jpg.jpg

The SP500's breakout in May has expanded its January correction from 1844-1732 of 112 points with highs of 195475 missing the marker by 1.25 (1844+112=1956).  This comes after the correction in January setup a bear trap which was followed by a V shaped bottom, squeezing out those shorts. For the months of March through April, the market made peak highs on job reports, however remained below 1900 and held above 1800.  This range tightened in May with the jobs number failing to take out the previous high, putting in a lower low at 1886 on May 2nd.  This lower low for the first in 3 jobs releases lured in shorts as it setup a failed retest and breakout of the April highs at 1892.50.  A correction was attempted following this lower high, only to hold at 1859, holding the May low of 1854.50 and preventing a reversal on the month to confirm the short side. This failure to take out the monthly low caught shorts trapped as the market gapped open on the 21st at 1874 from its prior day close of 1868 and pressed to take out the May 2nd jobs number high of 1886. With this jobs number taken out, the short side was forced to cover, using this as fuel to break through 1900 and take out the 3 month range which gave way to expand the 1844-1732 V bottom up to 1956, as well as meeting the 76.4% fib extension at 1956.  This level completes the short squeeze objective and the range expansion objective, however the pressure remains to the upside as the breakout is in a parabolic period.  The latest leg from 1924 up to 1941 was sparked on high volume with the news of ECB going to negative interest rates. The jobs report gave the last spark into 1950 on Friday and this created a spillover effect, seeing Monday continue the rally into 195475, meeting its objective, before going into profit taking.

Going forward, a daily close below 1945 gives way to back and fill last week's ECB squeeze with lows of 1921 to retest the breakout point and major support down in the 1920s with sell stops below 1913. Failure to hold 1913 gives way to shake out the long side and retrace back to the range highs down to 1900-1890 from the original breakout point in May.  This provides buyers an area to buy on a pullback as opposed to chasing the market on the highs.  The pivot for the rally comes at the May lows as a breach below the May low reverses the upside momentum. Above 195650 sees the 100% fib extension up to 2025.


Tags:
Continue reading
3510 Hits

SP500 DAILY VIDEO ANALYSIS


Futures, foreign currency and options trading contains substantial risk and is not for every investor. An investor could potentially lose all or more than the initial investment. Risk capital is money that can be lost without jeopardizing ones financial security or lifestyle. Only risk capital should be used for trading and only those with sufficient risk capital should consider trading. Past performance is not necessarily indicative of future results. Video content hosted by third party.


05_22_jpg.jpg


Tags:
Continue reading
2265 Hits

Why Stocks are Lagging

05_22_jpg.jpg


As the NFP rate creeped toward the Fed's 6.5% target, the bond market acted ahead and as it closed 2013 on the lows, it started 2014 on the lows, only to fail in moving lower and squeeze higher during the month of January. This upside reversal caught shorts by surprise as it squeezed the market from 12723 to 13503 to stop against major resistance from October of 2013.  The reversal into this resistance squeezed out the short side, however for the next 3 months the bond market stabilized sideways to consolidate the reversal and in turn develop a base or in technical terms an inverted head/shoulder pattern from February to April. With April's low retesting March lows and holding, this saw a push back to breach the 3 month highs and confirm the inverted h/s pattern. The coiled pattern once again left shorts selling the market trapped and with the breakout above the 3 month high, this gave fuel to expand this inverted h/s target and squeeze out October 2013 highs. This was done in May, confirming the lows of 2014 as a failed breakdown and a reversal in trend. So far since the October highs being taken out, this has led the bond market to further squeeze another 4 handles as late buyers now come in after the confirmation and chase the market up.  Going forward, major resistance is being tested from June of 2013 in the bond market with new buyers chasing prices above last October's highs. A move through 14028 squeezes this resistance level and retraces the bond market 50% from its 2012 high to its 2014 low. A break below 13606 reverses short term upside momentum to shake out longs chasing the market and give way to test downside support at old resistance 134, followed by 129 as major support off the year lows.


05_22_jpg.jpg


The Yen also started the year on the lows and reversed higher during the first month of 2014. This caught the market off guard again, squeezing out the short side with the move from 9486-9926.  Since this January upside squeeze, the Yen, as the bond market, went into a sideways consolidation period as it turned lower, however held above the January lows to keep shorts trapped. The consolidation and coiling led to an inverted head/shoulder pattern just as the bond market, with a squeeze in May to break above the neckline of 9870 and reach its 200day moving average for the first time since November of 2013. In contrast to the bond market, the Yen has had much more difficulty in expanding this range and seeing new buyers chase the market at these levels. For now investors are favoring the hedge of stocks into the bond market. Eventually this should rotate from bonds into yen and gold. Short term, the Yen remains in an uptrend with a target of 10150 to expand its 3 month range. Failure to hold the May low gives way to retest the April lows.

Continue reading
2669 Hits

Summer Capitulation or Summer Bummer

1-8-12b_1.jpg


Notice long term 2013 trend from the breakout gap and go above 1440 to start the year see a setup of higher lows strongly defended.  Early 2014 low held right against this trendline to put in another higher low and see new highs made. Latest higher low comes in at the April lows of 1803.  Uptrend line caught up to the market forcing buyers to defend even as market has gone into sideways distribution. The sideways consolidation has been a fight to hold the uptrend. Latest bounce coming from the April low and break out above recent 3 month range is looking for capitulation of shorts and new longs to be forced above new highs. The April low is now a major pivot level as a breach below breaks reveres the uptrend of higher lows.

Continue reading
3047 Hits

Stocks Strike Out , Cash Takes Profits

1-8-12b_1.jpg


The SP500 for the 3rd time in the last 3 months sold off on NFP numbers.  The last two, were both peak highs. March 7th the SP hit highs of 188750 before turning down to 182350. The FRB chair gave the markets a push on the 31st of March reassuring stimulus measures. This gave way for new highs going into the April 4th report at 189250, only to see these highs once again rejected after the NFP numbers were released that morning.  This higher high and failure led the market to break March lows and fall down to 1803 in April to shake out the long side and lure in shorts. This has led into a short squeeze leading into today's job number as the market retested the failed April highs to give buy side another chance to push through.  Third time was not the charm, as the NFP failed to breach old highs of 189250 and the cash open saw profit taking to hold the NFP high of 1886, setting up a LOWER high, as opposed to the last 2 NFP peaks. 

This selling on the Jobs report over the last 3 month period comes as the market nears the old 6.5% unemployment target the FRB established in December of 2012.  The SP closed 2012 at 1420, 30 year bonds at 147, gold at 1675, and the Yen at 115.  With the unemployment rate now at 6.3% below the 6.5% target that was pulled, we are seeing the 30 year bonds, gold, and the Yen all reverse their trends and show a strong 2014 in contrast to last year.  This is putting major pressure against the market as the 3 of these instruments all started on the lows of the year and grinded up to show a reversal and underlying bid by short covering.  The consolidation in bonds, gold, and the yen over the last 2 months is the markets way of keeping shorts trapped as the year lows hold and market stabilizes to force them to cover into what is now being seen.  The SP500 in contrast, has not changed its 2013 trend as of yet. The year of 2014 started weak with a move down to 1732 only to shake out longs and attract shorts in what turned into a reversal.  This setup a V bottom as the 2013 highs were taken out, and clearing the cache of shorts. now it was time to find new buyers to stabilize prices, and this is where we have been the last 3 months, in search of these buyers, which has led the market to consolidate sideways. Throughout this period, all peak highs that attempted to break higher were used as opportunities to take profits into by the market.  This shows that the long side is already heavy handed thus finding trouble getting new longs into the boat, giving way for the boat to be tipped for the majority to feel the pain.


Continue reading
1196 Hits

Pulling the 6.5% NFP Target

Since the December 2012 FOMC statement adding the 6.5% unemployment target to the fed funds rate:

1-8-12b_1.jpg

Bonds, Gold, and the Yen (BGY), all front ran the FRB NFP target, moving down heavily for the year 2013, while the SP500 moved up 33%.


In 2014, just as the NFP target reached 6.7% to near the 6.5% target, it was pulled.

Year to date for 2014:

Bonds, Gold, and the Yen, working against a major downward trend last year falling an average of 20.3%, all started the year of 2014 on the lows and grinded higher. This reversal for 2014 is counter to the 2013 trend, however is the way of the market completing its front run into 6.5% target.  The SP on other hand, coming off a +33% move in 2013, has held flat for 2014, threading on the highs, fighting to hold its trend versus what bonds/gold/yen are doing.  The SP is also needing to take a lot of juicing at these levels as the FRB chair came out on the 31st of March to reassure investors of continued support, WHILE THE MARKET WAS AT ALL TIME HIGHS! Seems to be the last leg of longs are being lured into the market and we did see since March 31st the market ran 20 handles higher into 189250 only to fall 90 lower.


1-8-12b_1.jpg

Thus far both of the last 2 NFP reports turned out to be the peak highs of the year and provided great trading opportunities. Join us for next NFP report by subscribing today.

Continue reading
872 Hits

DAYTRADING SP500, CRUDE, GOLD WITH CHICAGOSTOCK MONDAY 04/28/14

1-8-12b_1.jpg

1-8-12b_1.jpg


1-8-12b_1.jpg

Continue reading
908 Hits

DONE BEFORE THE OPEN

1-8-12b_1.jpg


Coming into this week, tax day and a shortened holiday week was tricky. We had FRB chair pump the markets end of March into new highs reassuring investors of continued stimulus, only to see the NFP numbers double top the market and the rally get sold into.  The selling picked up with the March lows taken out, confirming a short term double top as it shook out longs and left buyers from the "stimulus" talk trapped.  This led to a breakdown on Friday with lows of 180725 going into the weekend.


On Friday our systems triggered many buy signals which gave opportunity to collect up to 32 handles from base hits during the day, however the market remained weak on Friday. Settling near the lows, this put pressure for a flush to take place going into Sunday. This was seen Sunday night with new lows down to 180325 before reversing higher. This triggered new buy signals at 180650 with a 5 handle stop for aggressive buyers.  Going into the cash open, the market had retraced up to 182375 allowing to lock in majority of profits and allow runners to work for a day on cruise control. The cash open was followed by profit taking seeing the market fall into lows of 181550 to allow intraday buyers an area to defend, which they did and pushed the market up to highs of 182800 to test the upper vol window. Profit taking led the market to run out of gas and see a shake down into the afternoon, falling down to 180825 to retest the overnight lows before seeing a squeeze up to settle at 182450.  Flushing intraday buyers, luring in shorts sub 1815 and squeezing 10 higher.


Monday 04/14/14 reversal off lows:

1-8-12b_1.jpg

CST aggressive long signal @ 180650.

Target 1 181150, Target 2 181650 completed prior to the open to lock in 15 handles with runners. Target 3 was scaled at 182650 to lock in 20 handles and leave 1 contract on with a 1814 stop. Afternoon attempted to buy 4 more at 1818 only to see the market dance at the level too long, in turn scratching the position at 1818. Flush kicked out the overnight 180650 runner at 181400. On 6 contracts, 57.5 handles locked in. If one only bought 3 contracts @ 250 risk each total risk of 750, would have allowed to take tgt 1 181150, 2 181650, and 3 at 182650 to lock in 35 handles.

Tags:
Continue reading
2470 Hits

DAY TRADING TODAY'S DOWN TAPE

1-8-12b_1.jpg


Buying the SP500 today with the market breaching the March 182350 lows to open at 1816 was not an easy task, nor was it impossible. The market provided opportunities intraday for longs to defend. The cash opened at 1816, followed by a squeeze through 1821 to establish a bullish intraday bias which was followed by a shakedown to the reversal window at 181275, offering buyers an opportunity to defend.  This new low and test of reversal window failed to continue lower, seeing a squeeze back through session highs and up to 182850 to test major resistance off the overnight highs of 1832. Failing to get through, the market retraced lower to retest the 181275 session lows which was followed by a small bounce up to 181950. This bounce failed to push through resistance and regain above 1822, seeing sellers take control (read post: Running out of buyers?) and take out the session lows to fall into 180725, squeezing out session longs and luring in late sellers below 181275.  This new low was followed by a bounce up to 181650, once again failing to push through resistance before falling back to 180950 into the close and settling at 181175.


With the market settling 15.50 handles from Thursday's close, actively day trading the SP still allowed to collect 32 handles on all LONG trades.  It is always more aggressive to go against the tape, however if risk is defined and reward opportunity is healthy, a day trader can trade any tape long or short.

Below is the AIM feed sent out to Chicagostock members.

1-8-12b_1.jpg

Tags:
Continue reading
964 Hits

DAY TRADING SP500'S DOUBLE TOP

Both peak highs in 2014 were made on NFP days and only 1 month apart. 

Below are videos on Chicagostock's day trading signals


Trading March 7th Non Farm Payroll Number:


Trading April 4th Non Farm Payroll Number:

Continue reading
3040 Hits

RUNNING OUT OF BUYERS?

1-8-12b_1.jpg

Since reversing off the year lows of 1732 and through December's high to squeeze shorts, the SP coiled in a sideways range in attempt to find new buyers following that V shaped short squeeze.  The first peak high was made at 188750 in March on Non Farm Payroll numbers.  This was followed by a reversal down to 182350 mid March, before climbing back up to 1877 as the pullback was bought and the 6 month pivots turned into support.  Breakout attempt was seen early April, having to take the FRB chair to say stimulus is still needed to in order to trigger new buying to run the market into new highs setting up a jump ball on the NFP numbers that were released early April. New all time high were made by 5 points up to 189250, again on Non Farm Payroll numbers and was followed by profit taking and sellers pressing the market post NFP release. Both peak highs being made going into the jobs numbers that were both followed by immediate profit taking. The last high is more troublesome as new highs were made only to fail to continue higher, seeing a reversal back down to press and retest the March lows of 182350.  First test of this led to a bounce this week on the FOMC release the 6.5% unemployment target for the fed funds rate would be removed.  The initial reaction was an embracement by the market, seeing a bounce up to 1867 before running out of gas and reversing back down to close below the recent low of 183075 prior to that FOMC release.  Once again the market brushing off stimulus promises and a pull of the 6.5% unemployment rate that suggests rates can remain low longer. 

Going forward, pressure is being put now against the prior low of 182350 made in March to shake out longs and confirm a short term double top.  A weekly close below 1850 is bearish and creates a new range of resistance within 1850-189250.  Looking at the action made in 2014, with the early sell followed by the V shaped recovery that was fueled by shorts being squeezed, the market traded above those prior highs for 2 months in attempt to build a base and attract new buyers following the short squeeze. Failure to build the base and hold above the 2013 highs, suggests enough new buyers are not coming in to sustain the V reversal to expand higher.  If new buyers are not coming in, then the bus may be too full and this gives room to expand lower to target the year lows and confirm a failed breakout with major support at 1700 based off the October low.  Failure to hold the 2014 low of 1732, breaks the series of higher lows the market has enjoyed since the last major low of 1553 in 2013 when investors feared tapering before being squeezed up 300 points.  By taking out the last major low at 1732, this breaks the upward momentum, and gives room to move down into testing levels from 2013 and attempting a gap fill down to 1420.  Support off the year lows is seen down to 1750 for buyers to defend.

VIDEO: Watch Chicagostock's day trading signals on both peak highs.

Continue reading
4203 Hits

CAPITULATION LEVELS

Nasdaq futures are staging the ultimate retest as the market is now 500 points from testing major resistance of where the market failed during the dot com bubble. By taking the low of the last major correction at 281775 (May 2013), using the January high of 362525, and the last recent low of 3412 made February of this year as the market’s attempted to breakdown only to fail, this gives upside fib extension levels of where the market can lead to. Thus far we have seen the market extend 38.2% at 3724, being where and what the market is working on now. Continuation of holding above the early 2014 high of 3635, this gives room to continue the squeeze higher as shorts capitulate. A 50% fib extension is met at 3821, followed by 3858 to complete the range expansion from 3635-3412 up to 3858. MAJOR resistance is met within 3900-4230 as the top level of the fib extension, being a 100% extension of the failed breakdown this year from last year’s move up. The first test of this range, should be sold with both hands forward, as this is the first test of the dot com bubble.


Continue reading
3633 Hits

Trading Pivots


Pivots are used to determine areas of reference for support/resistance.  Pivots are calculated by adding the high, low, and close of the determined time period, and subtracting by 3.  This gives a "mean" of the market from that past data. Pivots themselves are not always enough. By adding ranges to the pivot (above and below), this gives an area of cushion around the pivot.  The tighter the range, the more indecisive the previous data was, giving room for expansion of volatility.  In the above examples, the intraday pivots are derived from the previous day's session.  The three day pivots are derived from the last 3 trading sessions.

Continue reading
4101 Hits

Copper VS SP500 UPDATE / Equity Tops

1-8-12b_1.jpg


The spread between copper and the SP500 is now down to 5410 after hitting highs of 5679 in November.  This high marked a 25+% move higher in the SP500 and a 13-% move down in copper for the year of 2013.  Copper, known to be bell weather of economy as it shows industrial demand, tends to be a leader for the equity markets.  The fact that it was down this year as the SP500 diverged higher shows the move in equities was fueled only by QE as opposed to underlying macro.  Going forward, a breach of the August low in this spread confirms a failed break out with reversal attempt to cover/buy copper and sell the SP500.


 1-8-12b_1.jpg

After breaking through the daily pennant created after the May correction that was followed by higher lows and higher highs, the SP500 traded in a tight range of 173650-177450.  This range of (38) was expanded higher as market broke above and turned 177450 into support, completing its target of 181250 to the tee with highs of 181250.  This was followed by a pullback to retest the 177450 level that held at 177775, followed by another retest of highs.  The retest was seen on the December release of the November NFP # that fueled the market to retest highs.  This retest fell short at 181150, seeing a rejection to take out the 177775 low, confirming a short term double top.  Market is now ont he edge fighting to hold above 1760 as this 1774 level becomes new resistance with the double top trapping longs and putting pressure lower.  Continued weakness below 1774 gives way to target the bottom of  old range at 173650 for stops.  Failure to hold 17360 can see the 1774--1736 range expanded down to 1698, into the bottom of the daily pennant and a test of the 100 day moving average which has not ben touched since October.


Continue reading
913 Hits

DAILY EQUITY CHARTS FOR NOV 18 2013

(click chart to maximize)

1-8-12b_1.jpg

Continue reading
2524 Hits

SP500 & Yen

1-8-12b_1.jpg

As seen above, the SP500 has enjoyed higher lows and higher highs ever since its biggest correction of the year.  This correction attempt started in May, dropping the SP from 168575-155325, 7.9. Since then, we have been in this trend where higher lows have been made as pullbacks become shallower with buyers chasing the market up, and higher highs as shorts have been squeezed with the market taking out the previous highs.  Anytime someone is forced to chase a market, it never ends well. The latest squeeze came as the market pivoted off 1640 and ran in the face of a government shutdown and the constant debt ceiling debate.  With the September highs taken out, highs of 175450 were made this week on the NFP number release, pushing the market above its rising wedge, and testing fib extensions of 1740-1749.  Wednesday attempted to see a pullback only to see the market saved as it held 1736 which has the market back to pressing the highs of the week.  This is consolidation taking place as the market attempts to take a breather, yet continues the pressure against shorts and forces buyers to pay up.  Push through the weekly high sees the next major resistance levels coming in at 1776 as a 100% fib extension, along with 1783 as a 50% fib extension based off the year low to the September high and October low.  Falling below 1736 as a healthy market should, would give way to retest old resistance at 1710 and attempt to build new support. Without this happening, it forces buyers to continue to pay up, which gives way for them to chase these highs and next fib levels to be tested.  The trend of higher lows and higher highs since the May correction has not only seen buyers desperate to buy every dip, but also brought major pain to short sellers in attempt to clear them out of the market before the carpet is pulled from underneath.  The second half of the year remains in a "bullish bias" and any pullbacks down to 1620 would give buyers a major area to support this bias and keep the momentum. The question is if there will be any buyers left after the market has forced them in with this rising wedge.  It will take a period of 7 closes below 1620 to reverse the bull bias and give way to target the June lows for the rug pull and move to fill the gap that began this year down to 1420s.


1-8-12b_1.jpg


As the SP500 hit a top in May and pulled back, the Japanese Yen in contrast hit a low and squeezed 10 handles off the low.  This was followed by a pullback to retest the lows, and ever since then, as equities have gone higher, the Yen has traded sideways and compressed as the 200day moving average on the daily chart has caught up.  Since the Yen's original move was from 126 - 96, it is in a bear trend and this sideways action is consolidation of the trend and an attempt to reverse or see continuation of the trend.  Currently, the Yen is retesting the October highs of 10357 that rejected the test of the August high.  As this spring is compressed, a move above the October high gives way to reclaim 104 and force shorts to cover, giving way for a retest of the June highs at 10663.  Reclaiming these highs gives confirmation of a reversal in this bear trend and sees room up to 118 to fill the gap created in November of 2012, just as the SP500 has it's gap of 1420 from December of 2012.  Recall the Yen attempted to bottom out at 10340 in March, only to see the Bank of Japan come out with new stimulus that derailed the reversal attempt and slammed the market into new lows down to 9640 printed in May.  The squeeze in June led to the BOJ announcement levels which was rejected. This is a major level as a recovery above this is a recovery in the Japanese Yen. Bottom line, for the week, need to see buyers sustain current bid to see new buyers step in next week and close above 104 to squeeze shorts. Failure to hold above 104 and break of 100 sees a retest of the May lows.

Continue reading
3019 Hits

The American Revolution and the SP500

1-8-12b_1.jpg


The SP500 is back at pressing last month's, keeping the rising wedge of higher lows and higher highs since the May correction.  Putting the market back in the hands of sellers to defend just as a deal on the debt ceiling is made.

The last high at 172675 capitulated shorts above its previous high of 1705 as the Fed surprised the market with no taper and no Larry Summers.  This was followed by a pullback which failed to see buyers materialize inside 1680s as the gap was filled post shorts being squeezed.  Establishing a weekly bearish engulfment and eventually grinding down into lows of 1640 to test last and major support based off the 162475 August low.  Sure enough this held to see the market develop a reversal that was fueled by talks of a deal taking place on the debt ceiling. Shooting the SP 60 points back to retesting major resistance within 1710-1715 from the failed high in September.  Just as the SP tests this major resistance, Congress has struck a deal with less then 14 hours before the debt ceiling was to be breached.  Many are looking for sell the news to take place, and the test of the September highs here is the true tell as to whether buyers can continue to support prices to push through sellers now coming into defend this resistance. For the market to reject this test of the September high, a quick reversal needs to be seen to fall back below 1690 to give way to test support at 1658 based off the 1640 lows.  The longer buyers can support prices at these levels, the more pressure to squeeze out the September high and put in another higher high.  Should this take place, we see next major resistance levels coming in at 1740 as a 76.4% fib extension, and ultimately 1776 as a 100% fib extension.  Keeping in mind the May high at 1685 that led to the biggest correction of the year was also a 100% fib extension.  This would be ironic to see the market reach for this number, the year of revolution/America's birth, just as Congress' approval ratings drop to all time lows and they continue to kick the can down the road with no real solutions on cutting spending or the debt.

Continue reading
2700 Hits