3626 Hits

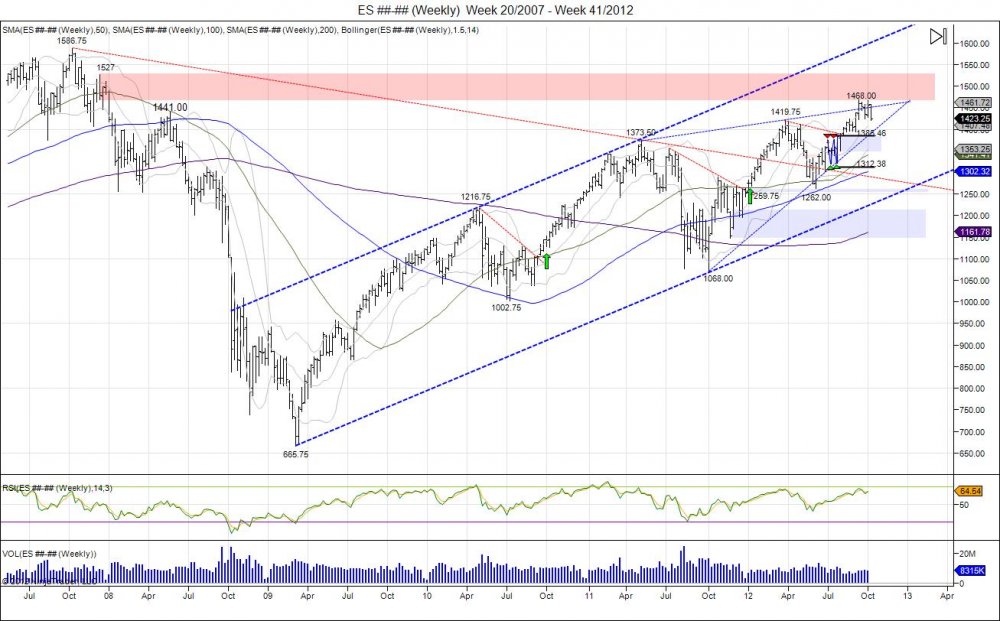
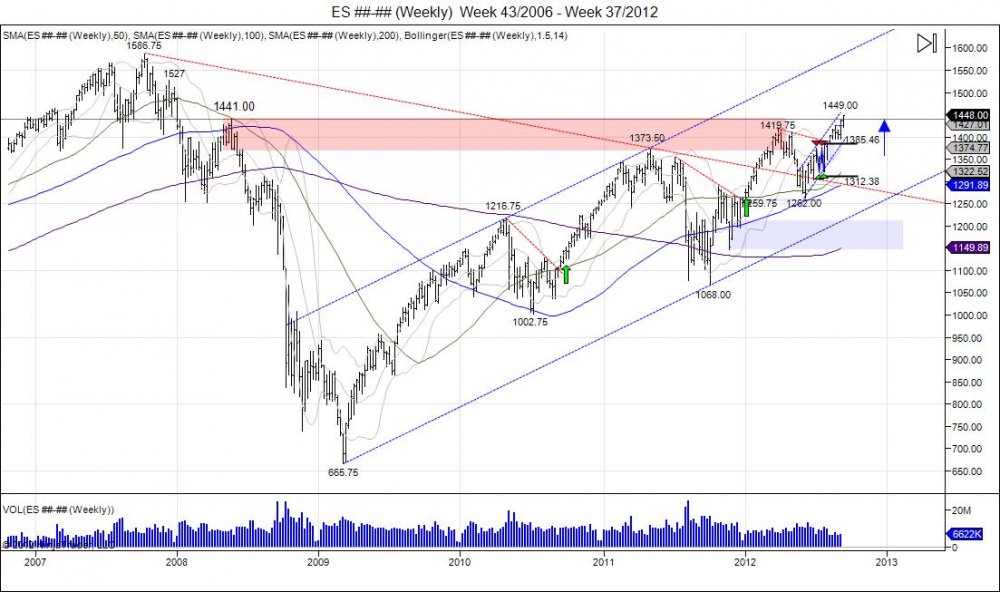
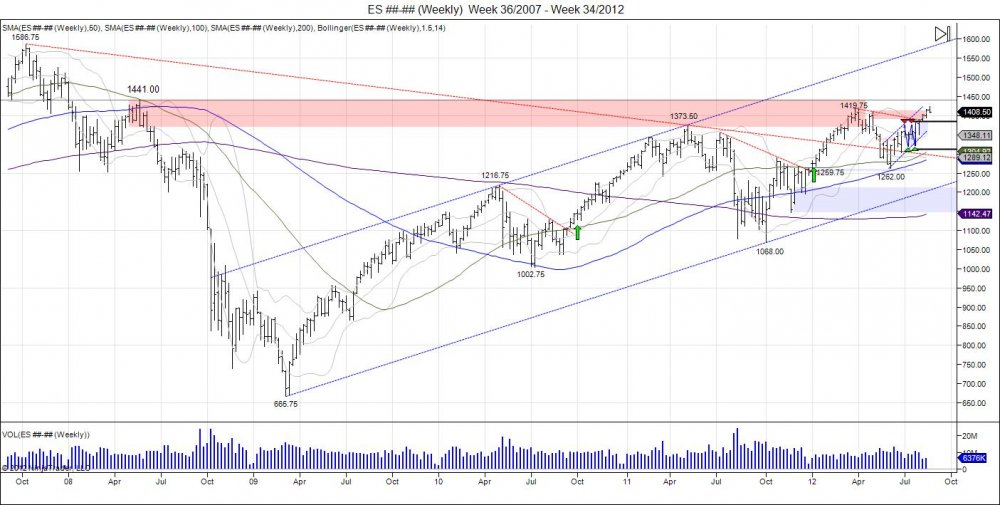
Since the all time highs of 1586.75 set October of 2007, the SP500 corrected into lows of 1255.50 early 2008 with Bear Stearns bankruptcy. A short squeeze was seen up to 1441 in May of 2008, only to reverse and fall into lows of 1373.50. This reversal led to a summer decline that took out the years and set up a shaky market going into the fall. As September began, the SP500 made highs of 1303.50 only to reverse and cause a spike in the Volatility Index. This reversal ultimately led to the crash as the market fell into lows of 665.75, March of 2009. Since this low, the market has channeled higher on glass stairs as it has gone through few major shakedowns however managed to continue the squeeze and retrace 100% of the breakdown from 1441. Below are the corrections seen during this move.
Click charts to maximize.
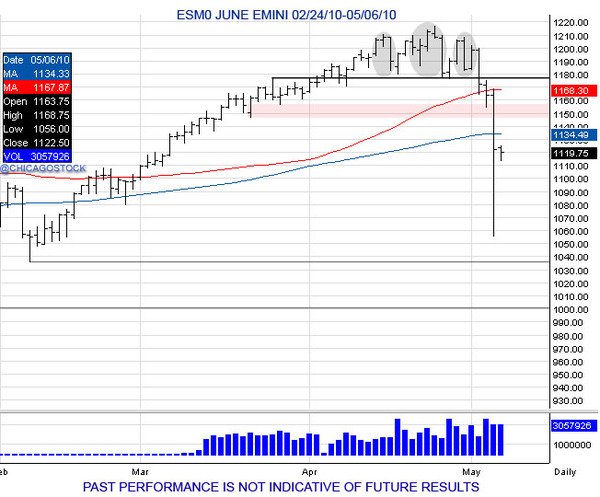
SP500 sets highs of 1216.75 before stalling to create a head/shoulder topping pattern projecting 1136.75. Ultimately seeing a flash crash with a quick move to 1056 before coming back to the 1130 level.
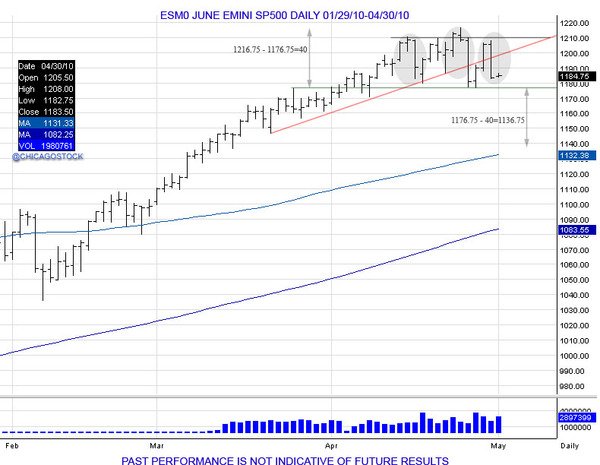
2010 SP500 Head/Shoulder Topping Pattern Completes 1136.75 and sees Flash Crash to 1060s:
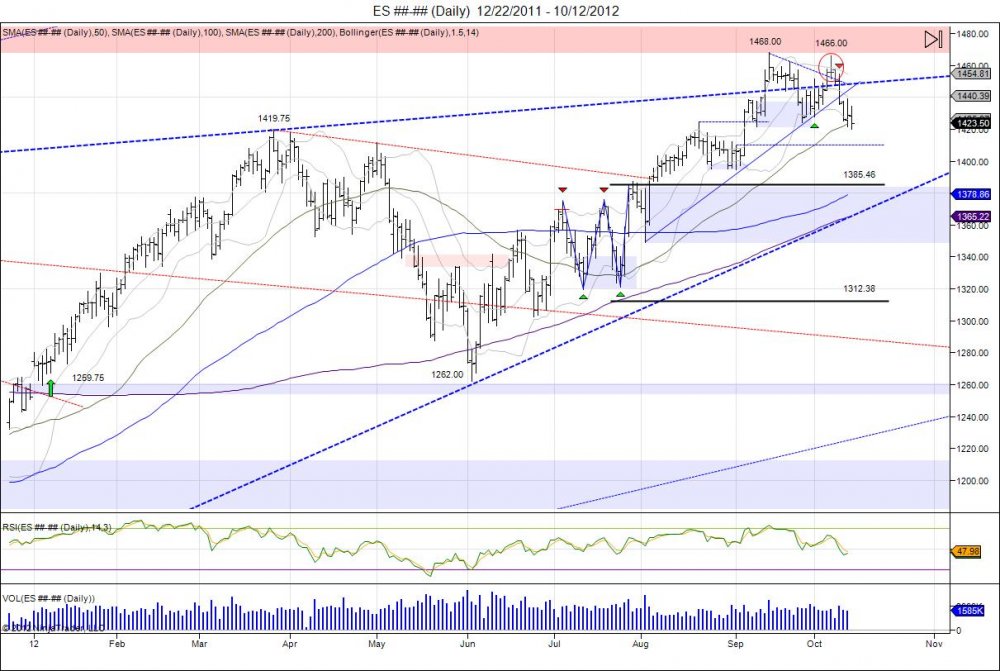
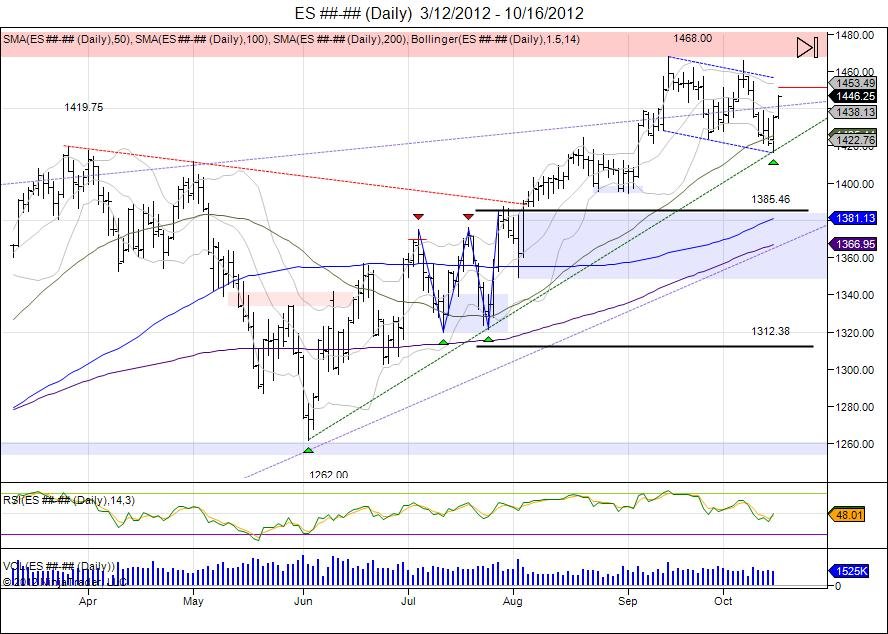
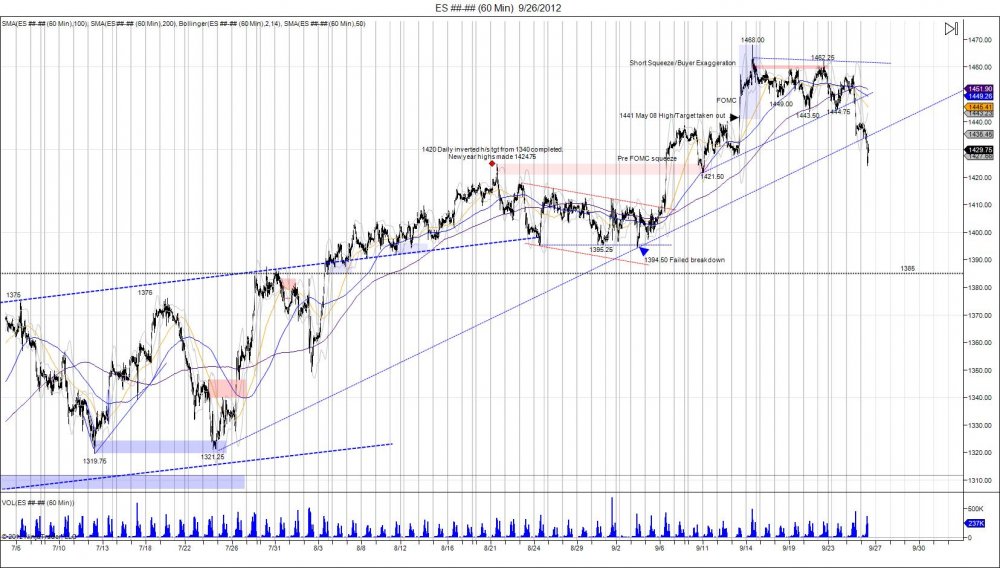
With the SP500 completing its 1441 target coined earlier this early, along with the double bottom made in summer that also targeted this, highs of 1468 were made in September as the short squeeze above the level took the market into this next level of resistance. The market saw a small pullback off the highs and found support off a small trendline based off the August 2nd pivot lows and through the September 4th lows. Not quite ready to break down, the market grinded higher to retest the highs made in September. With the non farm payroll numbers released on October 5th, the market squeezed through 1460, stopping out weak shorts, yet falling short of the 1468 high by 2 handles at 1466 and quickly seeing a rejection during the day. This rejection continued this week as the market saw this as a failure and a potential to double top. With the breakdown seen this week that led the market to take out the trendline from the August2-Sep4 lows, this confirmed the double top and now targeted the 1424 pivot lows made on September 26th prior to double topping. As the market is now working itself through this area of support, next major support comes in at 1410 based off the 1394.50 pivot low made on September 4th, and ultimately sees next major support at 1385 being where the market broke out early August to establish the bullish bias for the second half of the year. This fills the market back to where it broke out during the summer as many coined as a "light volume" rally, and most missed the move higher. This gives the ultimate level for the market to base out for the year and see if buyers step up at these levels to support the market after squeezing out all these late buyers who have come into the market chasing above 1420. The 50day moving avearge is being tested here. For this week the bear mission is to close the market below last week's open of 1432.75 to establish a bearish engulfment on the weekly chart to project more weakness going into next week. Doing so sees first level of resistance at 1427.75, followed by 1451.25 being the lows off the failed 1466 high and the range buyers must work through to regain momentum.
click chart to maximize
The SP500 completed its 1441 target and squeezed into its next major resistance being 1468, tapping it on the button as buyer exageration and short squeeze above 1441 led the market into this next level. Thus far, the market saw consolidation off 1468 in attempt to build a base down to 1443, however buyers ran out of gas as the market reversed Tuesday as they attempted to test the upper 1450s and fell to take out this 1443.50 level. This has the market now testing an important support range within 1437-1421 as lows of 1424 were made today, fighting to hold the 1421.50 low made September 11th, being the pivot low prior to the run into 1468. Below this level comes 1410-1394.50 being the pivot low made on the 4th as the market made a failed breakdown and ran from this into the 1468 level. This level could be the target for this move to squeeze out dip buyers and back and fill into this level. Should this take place, 1385 comes in as next major support on the downside that we must look for the market to test and attempt to hold to offer oppurtunity to reload. There are many eager buyers who want to come in as the market retraces its FOMC move higher, moving down into where this leg up began at 1394, would certainly hurt these buyers.
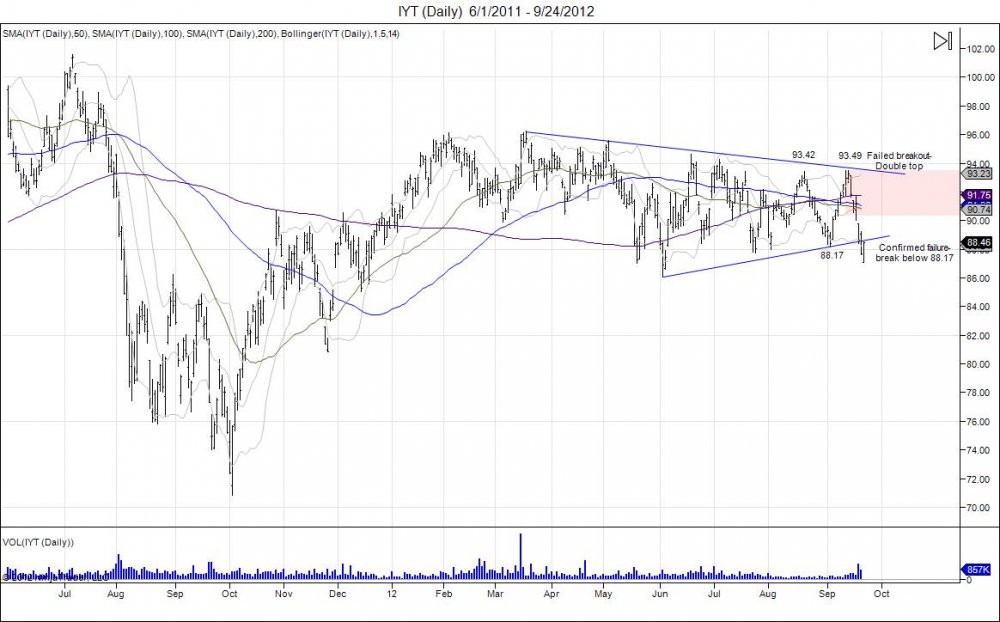
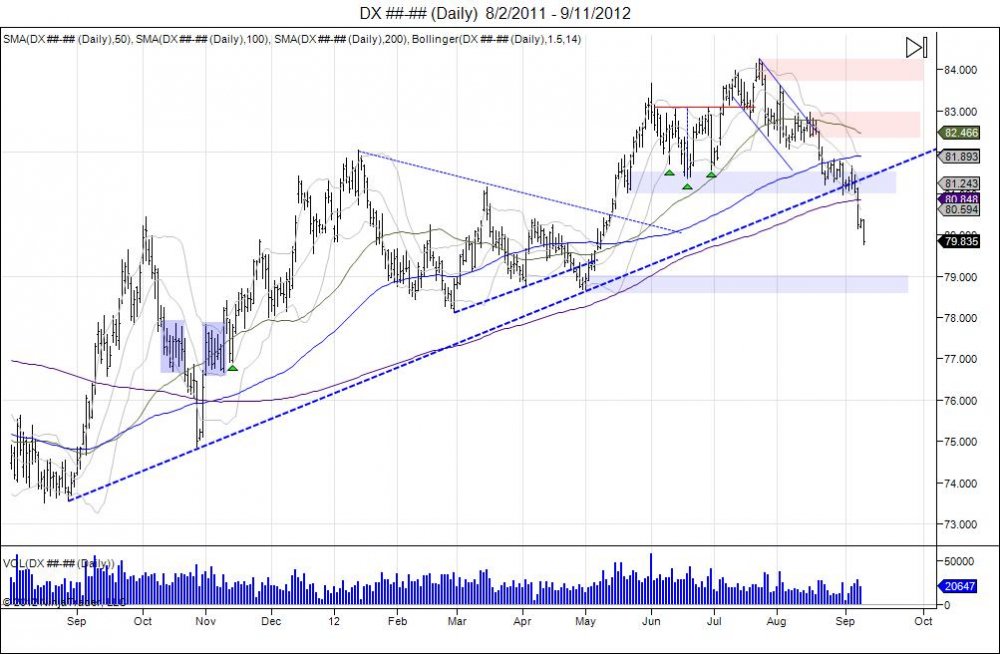
The Dow Jones Transportation Average Index Fund (IYT) has now cracked 2 month lows and on the verge of testing the year lows set early June at 86.09. As the equity markets grinded higher in August to complete the Emini SP target of 1420, many investors along with other "personalities" looked to the transports for confirmation of the equity strength. Unfortunately for these 'buyers', the confirmation in transports never came. The transportation index fund made a high of 93.42 in August just as the Emini SP500 made new highs for the year. As equities digested this new high and consolidated down to 1395 where a base was built, the transports corrected sharply off their August highs and fell into the summer lows. This index turned to chase equities as the SP500 base of 1395 was supported to see a squeeze into the 1441 level, the transportation index began to play catch up. As 1468 highs were made in the SP, the transport fund took out its August highs by 7 cents. This attempt to breakout failed to hold these prices and breakout of this pennant that has coiled all year. Once again with the small correction taking place in equities down to 1443.50, IYT fell sharply to take out the pivot low of 88.17 made in September just before it chased the SP higher. With the break below 88.17, this confirms weakness in this index and the double top made in August-September as the pennant has now been broken to the downside. Those that were looking for transports for confirmation, not only missed the move up in equities, but should be completely puzzled now of the weakness taking place here. Going forward, IYT is looking weak. The pennant created all year has seen a break to the downside following the double top at the 9340 level. Rallies up to 90 offer oppurtunity to defend this breakdown and sell with stops above 9350. This range will need to be taken out for buyers to regain control over this sector. Downside support levels = 83.00, 82.60, 80.84, 80.00.
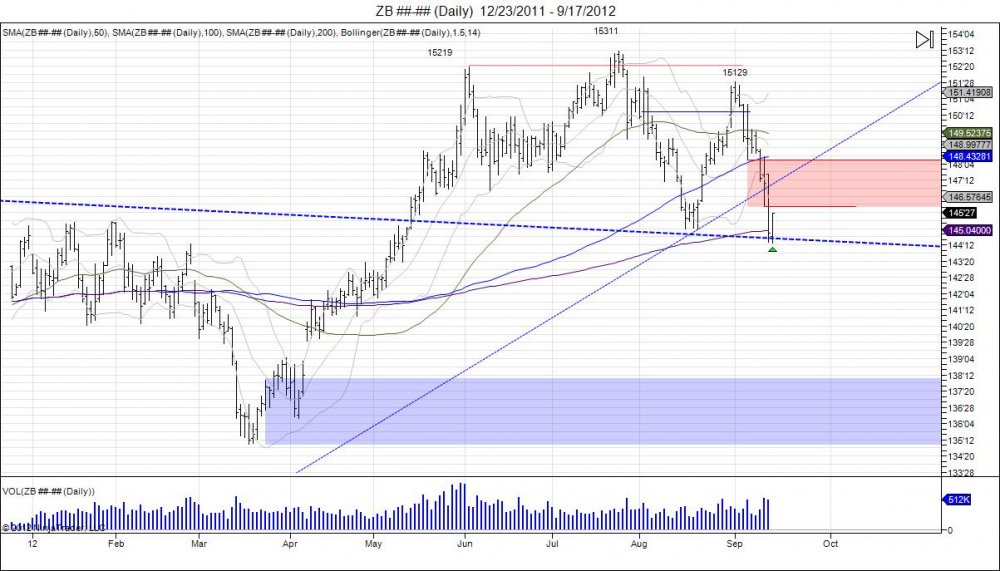
After putting in a lower low by a tick overnight down to 14415, the 30 year bond covered shorts as buyers came in to defend this neckline currently in jeopardy. This neckline is in jeopardy due to the failed retest of the 15311 high as the market ran to 15129 and turned lower in turn building a right shoulder. The currently action being seen now is an attempt to flag off this neckline support of 14416 to retrace into testing where the market failed. First level comes in at the FOMC lows of 14605, thereafter 14810-15129 being the range of the right shoulder. Retracements into this offer sellers a level to defend as a break through 15129 is needed to squeeze the bear and target the 15311 highs to void out this head/shoulder topping pattern.
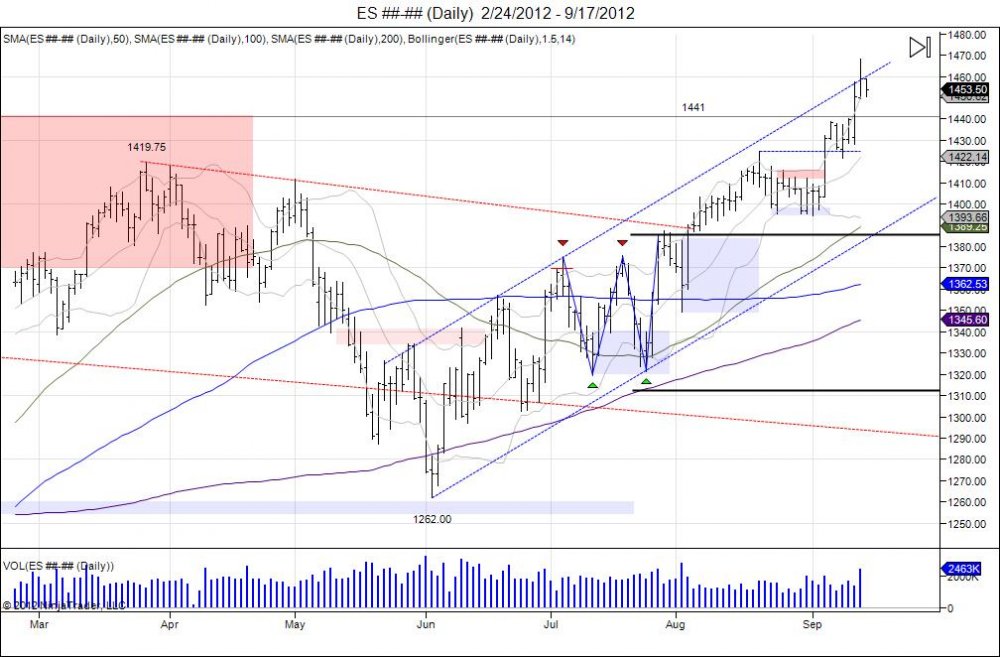
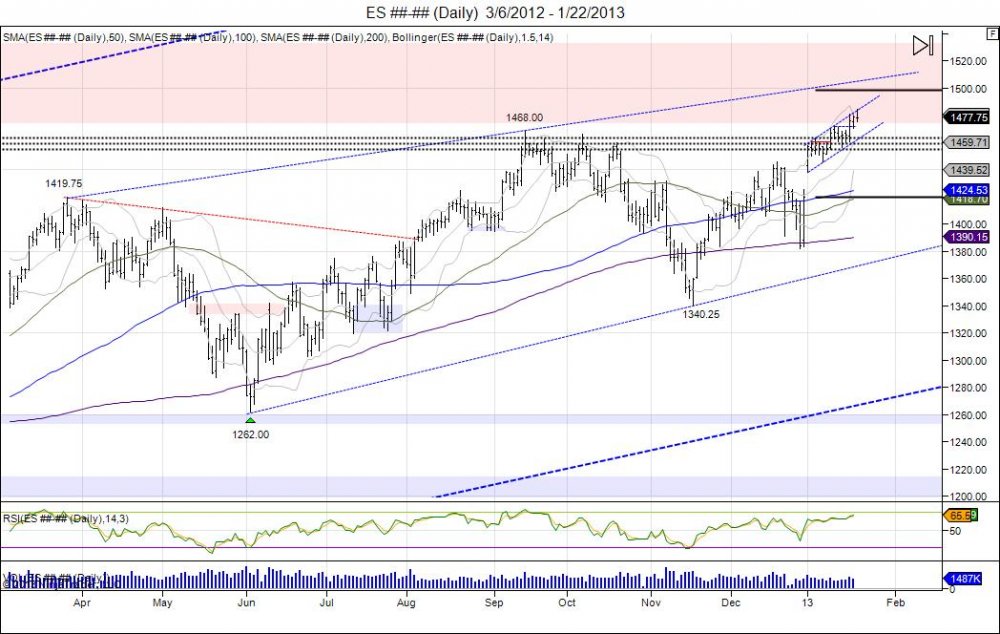
As the 30 year has fallen into a major line in the sand, the Emini SP500 has also crossed through its major level of 1441 and topped at 1468. This 1468 level was tapped to the tee and kept a lid on prices in the short term as the market pierced the top of its daily channel since the 1262 lows made in June. Currently pullback is being seen to test Friday's lows of 1449.50 as support for buyers to defend and retest the highs above 1460. Next major resistance comes in at 1481 based off the December 2007 high of 1527. Downside support is seen within1438-1421, 1410-1395, and 1383-1349.
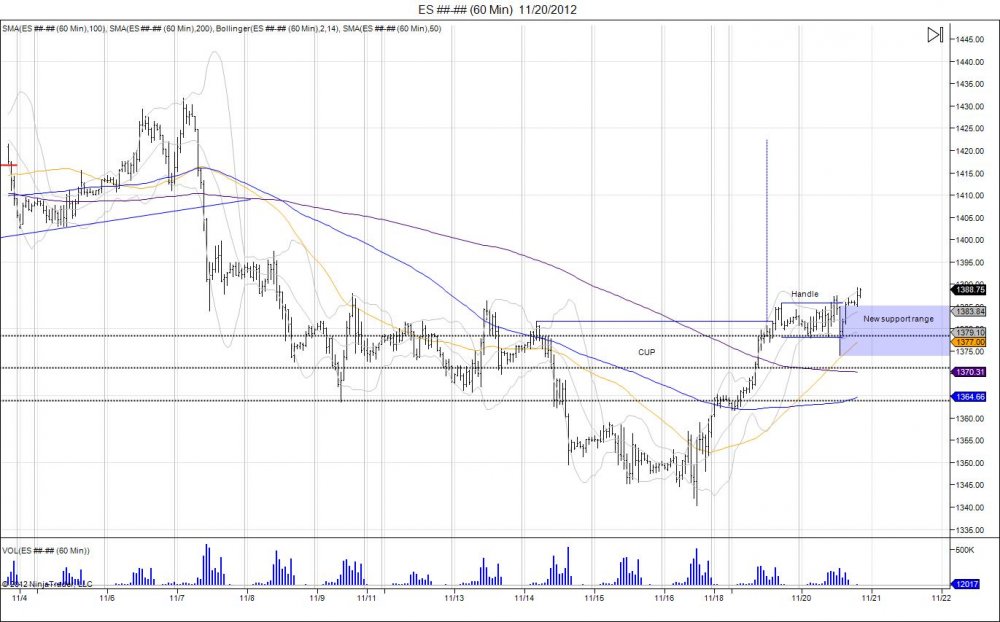
The Emini SP500 front month contract switched to December today, starting the contract 7 points lower then the September contract. Yesterday the September attempted to go after the 1441 level before closing out, only to fall short by .75. Today with the help from the news out of the FOMC, the front month ES (Dec) finally squeezed out that May 2008 high of 1441 and running through 1450s. We have talked about this 1441 level being a target all year since the market started the year with a gap higher and ran after 1400s. After a double bottom in summer at 1262 off the year lows of 1259.75, the market climbed higher to complete this target. The reason why 1441 was so important is this was the high the market reversed from in May of 08 before the crash that came later in the year. So moving past this level further squeezes short sellers and retraces the market to where the breakdown began. If there are any bears left in this market, now is the time to start stalking as all the late comers who missed the move are piling in. At these levels, the market still has room to run higher however we are now neutral equities and allow the market to digest this move and offer the next direction. Bond market is looking lower so there is late money to flow into equities, allowing for longer term equity bulls to lock in profits into. Next major upside levels in the market come in at 1468-1481 off the 1527 December high in 2007. Followed by 1556 off the 1586.75 all time high made in 2007.
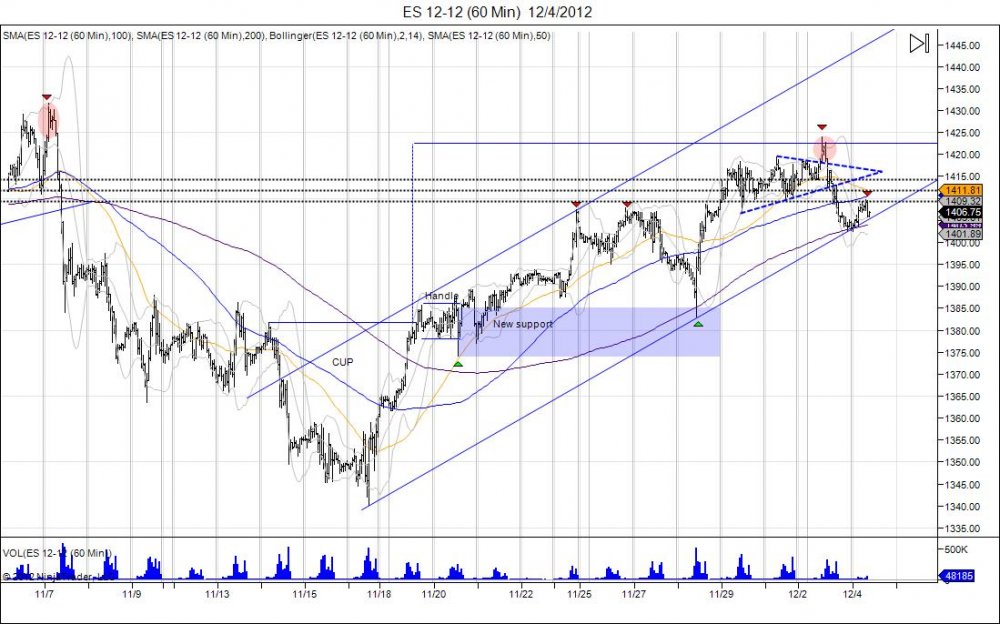
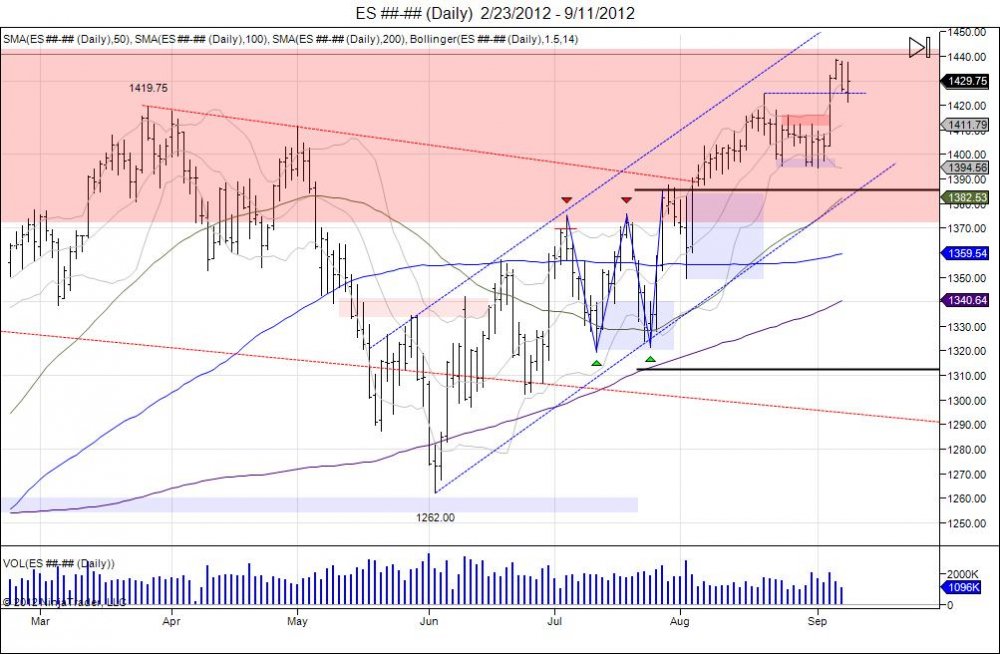
Since completing the 1422 target with highs of 1424.75, the SP500 has been in profit taking mode. This action has led the market back down to test the top of its channel that was broken on the 3rd of August. Shaking of the tree is being seen as the market looks for support. 1385 is the next major support level, also coinciding with a 23.6% retracement of the 1262-1424.75 move. This is where buyers must look to hold to show they are still in control and attempt the next leg up into 1441. Stops below 1349.
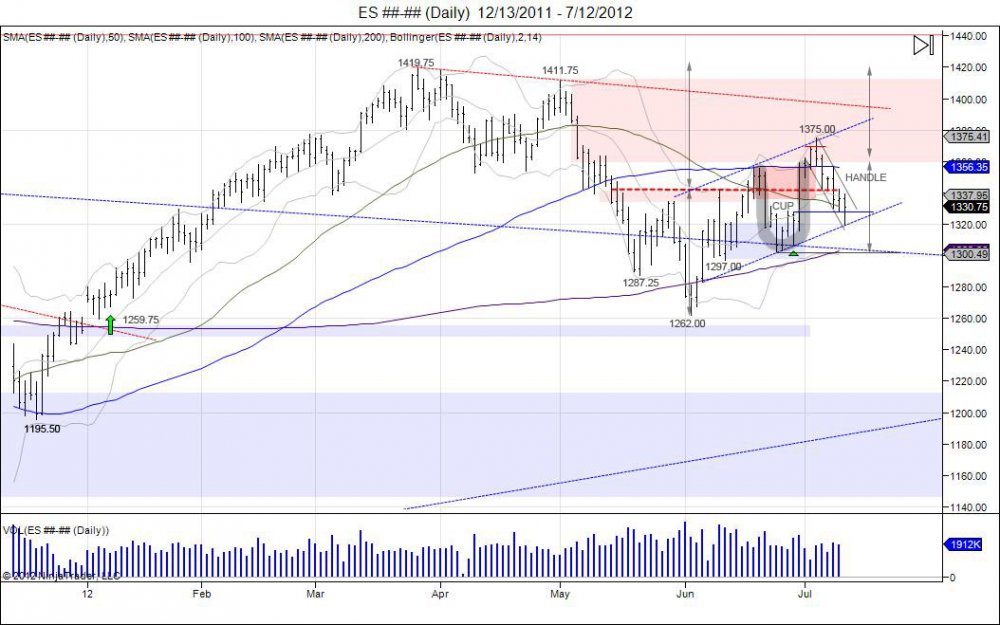
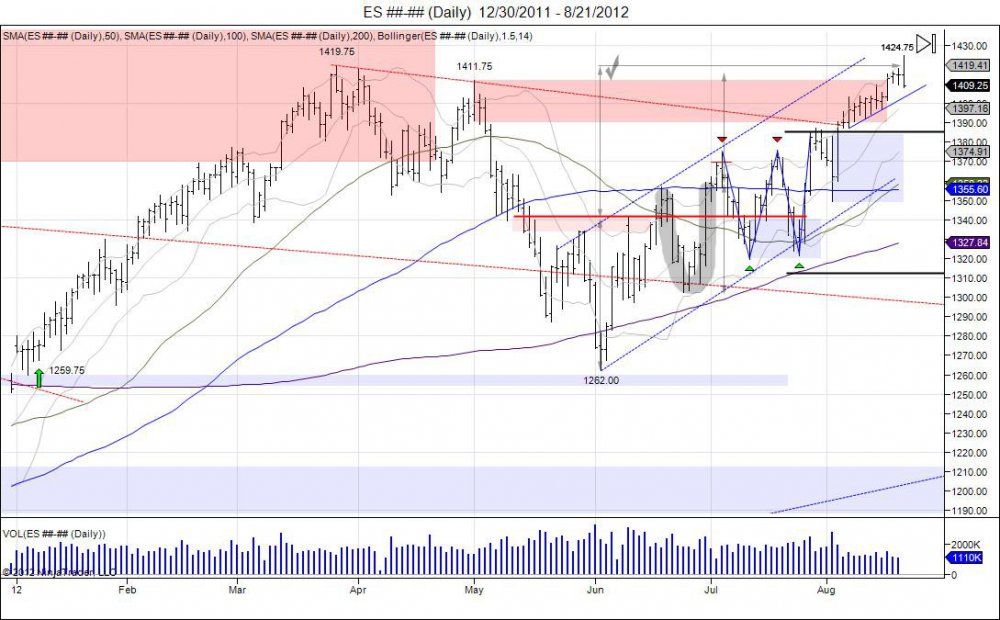
Today the SP500 completed its target of 1422 by the bullish patterns created during the months of May - June. The year lows of 1259.75 held in June with lows of 1262.00 as the market double bottomed to keep the gap from last year downt o 1252.50 open, keeping the bullish momentum alive. The market consolidated against these lows and created an inverted head/shoulder pattern with a 1342 neckline, targeting 1422. An attempt to breakout was seen early July before the market went into another consolidation phase, creating a cup/handle pattern and retesting the 1320-1297 right shoulder. This created another double bottom against 1420 in July and the market rallied into its upside resistance of 1385. During the month of August the market squeezed above 1385 and held above to keep shorts trapped which led to a slow chipping away at the May highs of 1411.75. Which this hold above 1385, shorts were forced to squeeze out, leading to this high of 1411.75 being taken out and finally giving room to take out the year high of 1419.75 and complete the target of 1422 from the 1342-1262 inverted head/shoulder. Today as the market completed this, instant profit taking was seen as the market reversed down to 1408. At this point a shakeout can be seen to test downside support down to 1383 with major stops below 1349. Breaking below this low derails the upside momentum to see further downside. Going forward, as the market looks for downside support and longs who have riden this over the past few months take profits, the late comers and shorts can give the fuel for the extra 20 points to complete the final squeeze of 1441 being the May 08 highs. This completes the short squeeze from the 665.75 lows put in 2009. A squeeze of 1441 can then give room to look for a correction in the market, however will need to see if the market can stabalize or fails following the move.
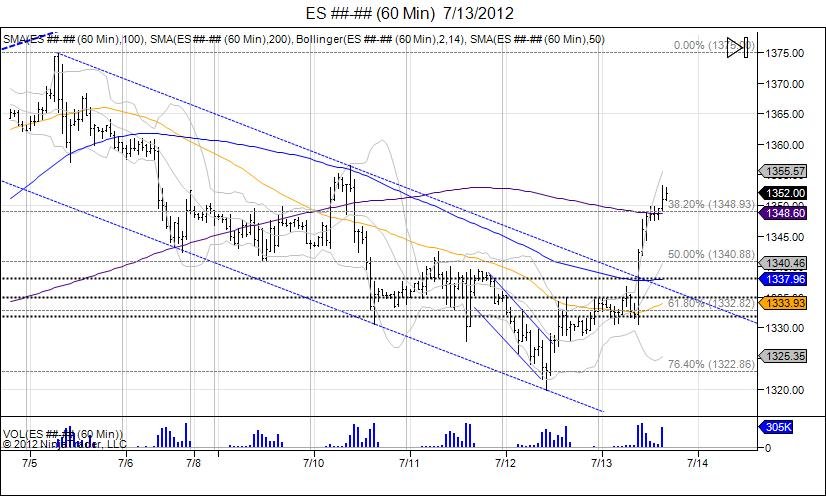
Following the 1319.75 lows made on July 12th as the market retraced lower to test its breakout point on the 29th of June, the Emini SP500 has held this level of support to break out of its handle formation off the highs of 1375. This breakout has led to a 100% retracement back to 1375 as the market has squeezed out this high. As noted in our market update on June 26th, we believed the pullback offered buyers opportunity to defend the market as the rounded bottom in the CUP was forming, followed by our post on July 12th as the handle was being formed identifying the 1328 level as support. With the market now at 1375, this rewards those brave buyers by giving opportunity to take money off the table as 2 of the 3 targets are complete, 1348 and 1375. Going forward, buyers can now run positions with their stop at their entry levels at the 1328 level and let the market attempt to complete its upside target of 1422. This move past 1375 confirms the cup/handle formation, however the next major resistance comes in at 1390 which retraces the market to where it failed at 1411.75 in May. Rather than buying at these levels, by stepping in and buying the breakdowns seen over the past few weeks, this has rewarded runners to do the heavy lifting through these major resistance levels. Sellers will be defending 1390 at all costs as this is the last level of defense where if fails, the highs of 1411.75 will be taken out, giving room to complete the upside target of 1422 and attempt to extend into 1441 being the May 2008 highs that saw the reversal into 665.75. Failure to push through 1390 and a move below 1319.75 derails momentum.
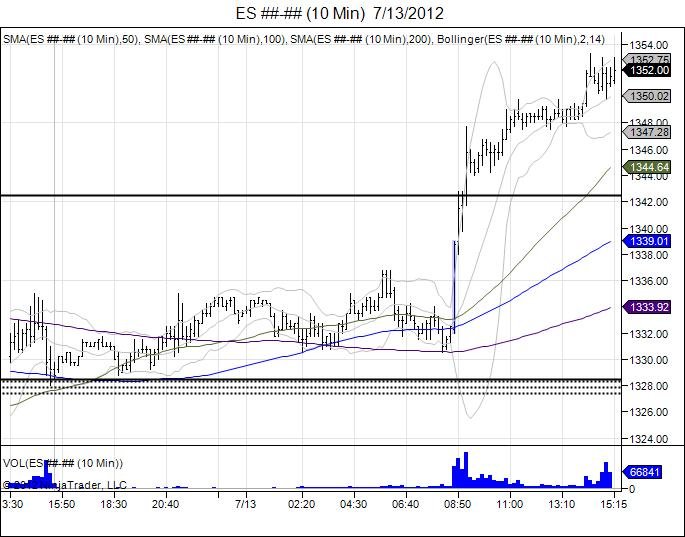
It was surely Friday the 13th for stock bears as the market moved through Thursday's highs which led to shorts being forced out as the market retraced back to where it failed earlier in the week at 1352.00-1356.50. The market closed the week a tick higher at 1352.00 from last week's close of 1351.75. The move was a win for bulls as the market was down pressing against the late June lows on Thursday. The market reversed on Thursday and was able to close above 1328, giving bulls their platform to continue higher. This was seen today with 1328.75 lows and a run into highs of 1353.25. The move in itself has given aggressive bulls who defended the pullback oppurtunity to take some money off the table and reduce exposure as the street now is back to bullish. With the short squeeze sparking this rally, going forward it will be up to buyers to come in at these levels to carry this momentum and retest the major resistance of 1357-1375 level from early July where the market failed. Bears are now looking at this squeeze as a simple retracement into those failed highs to build a -right shoulder, thus making the range of 135-1375 that much more important. Moving through this range sees next major resistance coming into play at 1390, followed by targeting the year highs of 1420. Downside support is now 1340 and a break below Thursday's lows of 1319.75, derails this move and puts pressure to retest the 1302.50 lows from late June, followed by the 1297 right shoulder created June 12th.
Click chart to enlarge
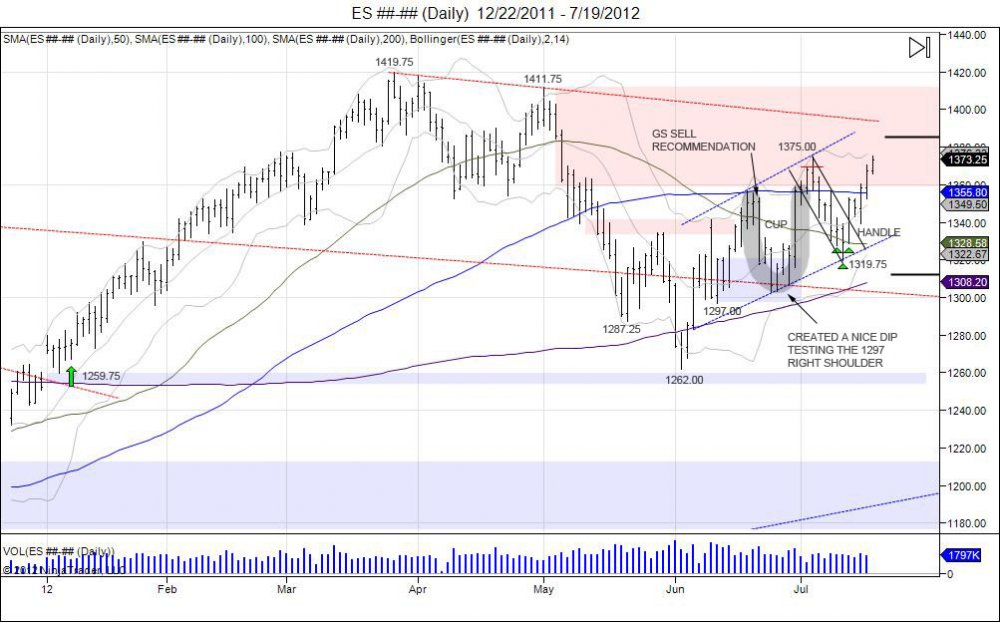
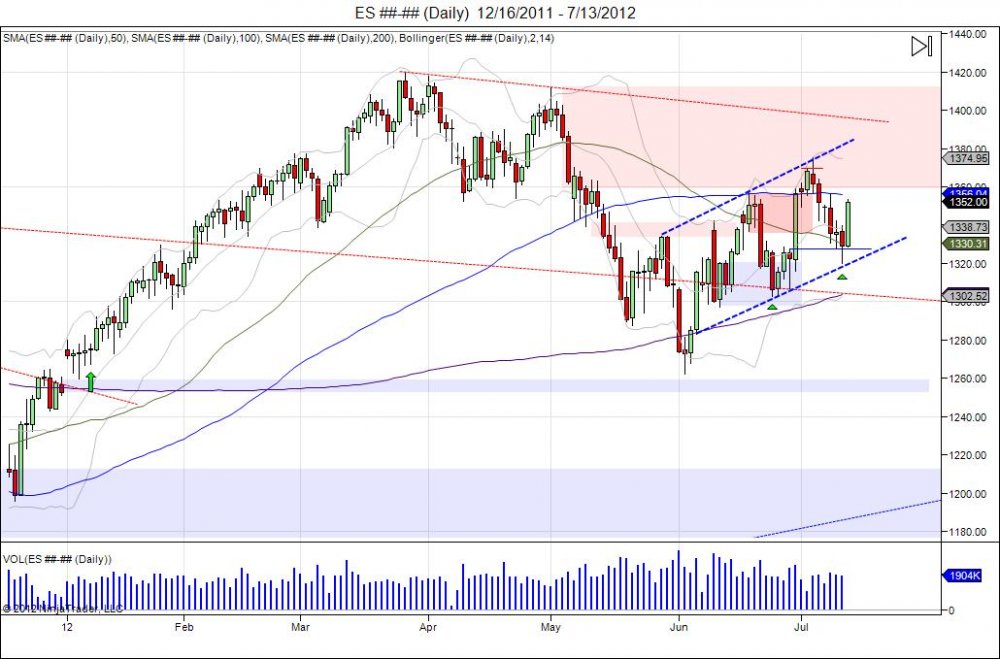
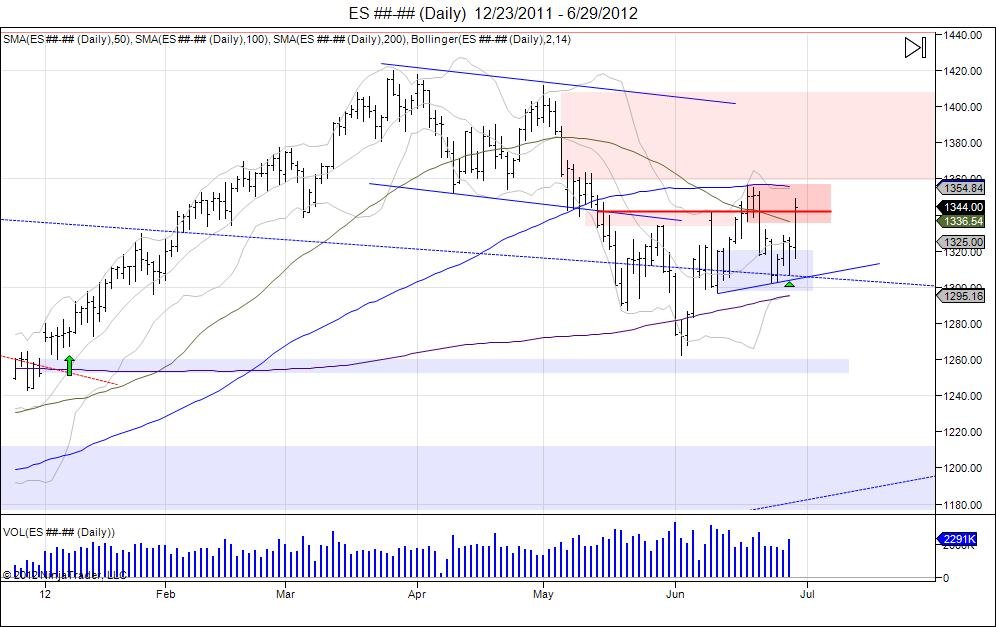
This year started out with a gap above last year's close of 1352.50, leading the market into highs of 1419.75 on March of 2012, which was met with the last level of resistance before the 1441 May 2008 highs which is the reversal that led into 665.75. The SP500 retraced to test its year lows of 1259.75, only to hold and put in a double bottom at 1262.00 on June 4th. Since this low failed to take out the year lows, the market bounced early June to squeeze shorts and make a 1342 high. The market backed off this high and retested the short squeeze by pulling into lows of 1297.00 and holding to create a right shoulder of an inverted head and shoulders pattern as the market was testing its head of 1262. With the test of the lows holding and the market turning, more shorts were caught as the market rallied through 1342 for another squeeze in attempt to break above its 1342 neckline, only to hit highs of 1357 and stutter. The market met resistance at its 100day moving average along with the levels from where it broke down May 11th. Following this failure to hold above the neckline the market was sold along with news from Reuters that “Goldman Sachs recommends shorting US stocks” with a 1285 target. This news led to weak hands selling dropping the market down to 1317 off its highs of 1353 that day. This retested of the right shoulder lows of 1297 as the market hit 1302.50 on Monday, June 25th. The following day the market tested this low with a 1303.25 low, and held to reverse and squeeze shorts running into resistance at 1330. The market backed off this resistance level and retested Tuesday’s reversal by finding support at the open 1306.75 and once again putting in a reversal on this Thursday. This action created a rounded bottom as the market failed to break below 1297, causing a run higher on Friday to squeeze out shorts due to the failure to break lower, retracing the market into 1375. This action created a U turn as the market came back above 1357 which was where it broke down and rounded out to come right back into this level. Also known as a CUP.
Since the reversal seen into 1375, the market has gone into consolidation in attempt to build a handle for the cup as downside support is tested. This handle has retraced the market down to where it reversed at 1328 from June 28th. This is much steeper then the bulls would like and has the market pressing against this old resistance, acting as new support being the level where the market reversed higher into 1375. On Thursday, July 12th the market shook below this level into lows of 1319.75 which hit the bottom of its rising channel from the 1283-1302.50 lows as seen above. The market bounced off this channel and closed above 1328. Going forward this level remains support with small stops below 1319 followed by larger stops below the CUP lows of 1302.50. A break below this low voids out the cup/handle and puts pressure to test the June lows within 1282-1262. A close above 1342 is needed to close above these most recent highs and attempt to break out of this handle pattern to retest the premature breakout of 1357-1375. A break above this confirms the cup/handle pattern with a target of the year highs. Following this the next major resistance comes in at 1390 off the failed 1411 high in May. This cup/handle formation is also within the larger inverted head/shoulder formation with the left shoulder lows of 1287.25, head of 1262.00, and right shoulder of 1297.00 with a neckline of 1342.00, also targeting the year highs at 1422. To void out this head/shoulder formation the head of 1262 must be taken out which gives room to take out the year lows of 1259.75 and fill the gap from last year at 1252.50. So long as this gap is open, the bull is alive as a double bottom has formed by an inverted head/shoulder against the year lows which keeps pressure against sellers as the market attempts to squeeze shorts higher. The ultimate objective above the year high is squeezing the May 2008 high of 1441 being the high the market reversed from that led into the crash down to 665.75 as seen in the weekly chart.
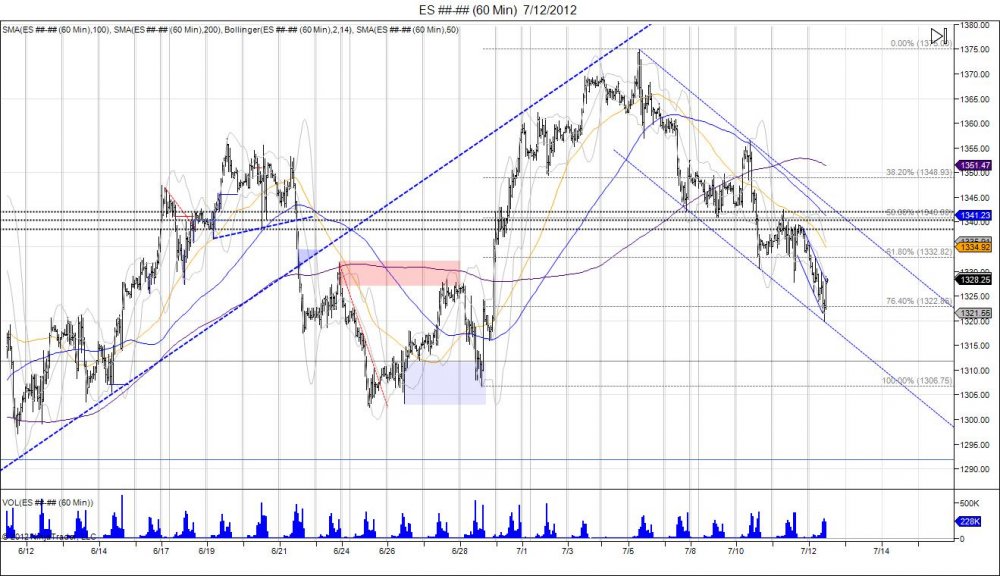
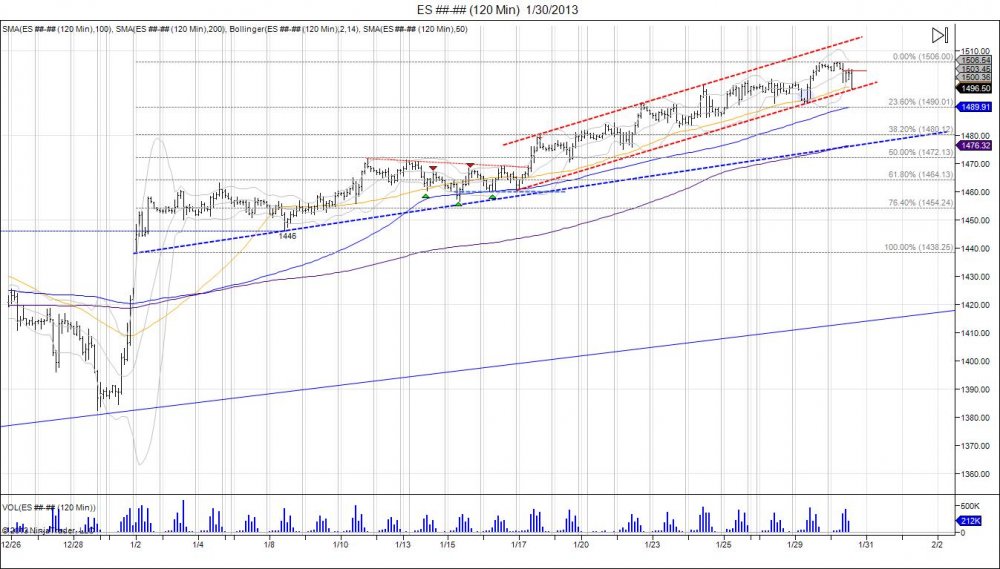
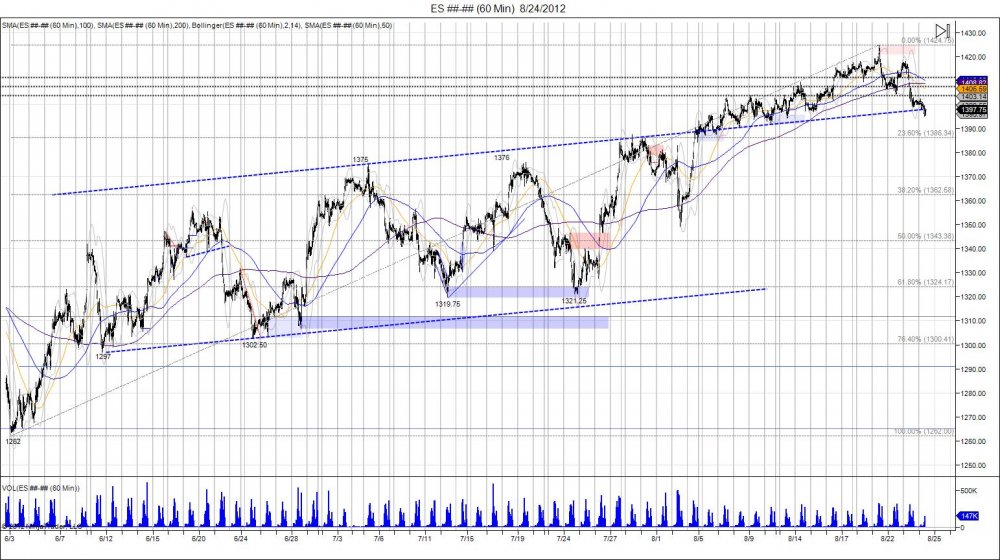
Hourly ES channel off 1375 highs, seeing 76.4% retracement of 1306.75-1375.00 move.

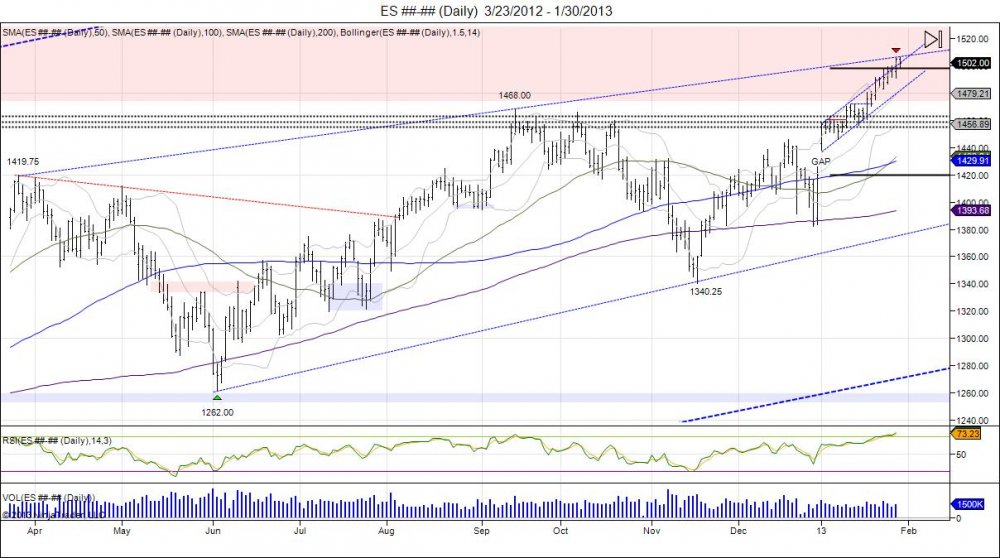
Daily rising channel from 1283 lows on 06/06.
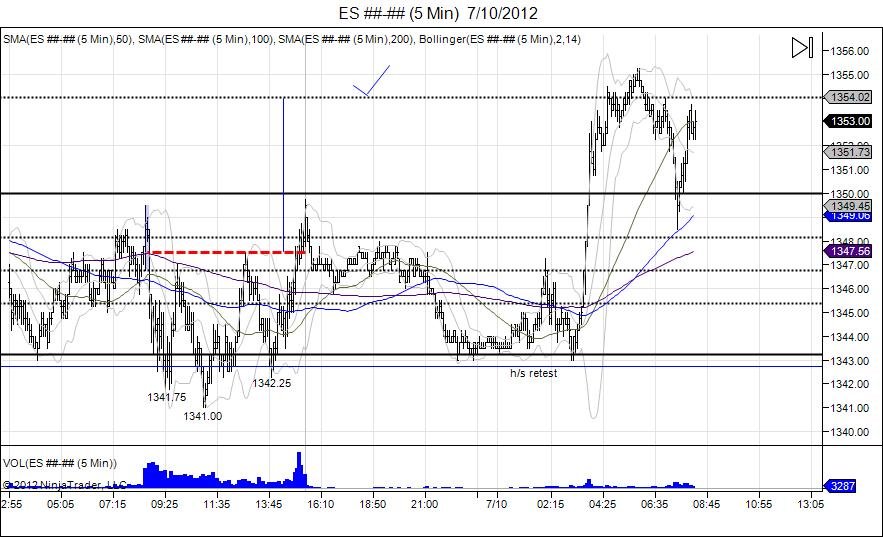
Overnight July 10, the Emini SP500 pulled in to retest its inverted head/shoulders bottom, with a 1343.00 low. The market held the head/shoulders and squeezed higher to complete the h/s target of 1353 with highs of 1355.25.
_______________________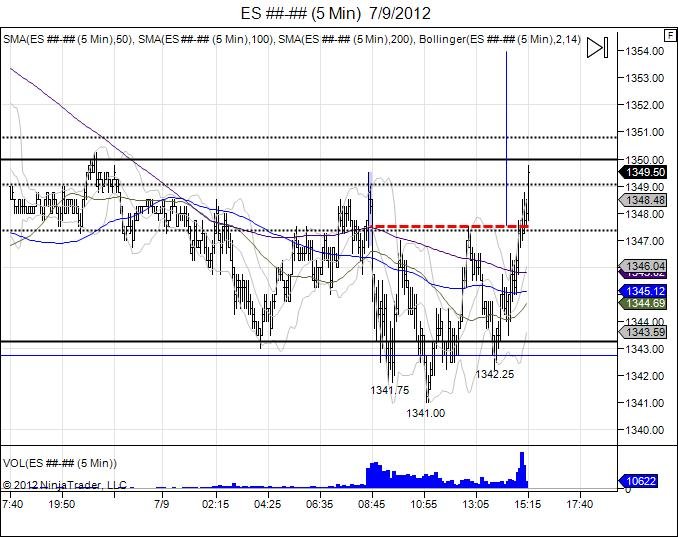
After failing to rally at the open, the market fell down to take out Friday's lows by .50 at 1341.75. A squeeze was seen following this, leading back into the opening range. First test of the opening range met more sellers and the market was seen moving back down into new lows at 1341.00. Another hold and reversal at this level the market turns back to where it failed previously (1347) and puts in a high of 1347.50, once again meeting sellers at the opening range and not able to hold up. Another push down was seen, retesting the lows by falling to 1342.25 as the test of 1341.00 was defended by buyers, in turn building a right shoulder for an inverted head/shoulders pattern. This defense led to another squeeze higher, this time since the low was retested, the market found enough strength to squeeze through its neckline of 1347.50 and put in a new session high of 1349.75 before settling at 1349.50. Today was all about attracting sellers below 1343 and squeezing out longs as the market had 3 bounces off these levels. It was not an easy day being a bull eitheir as the bias for today was bearish, however in the end, the bull squeezed out a new session high.
Earlier this week we saw the market fall into retesting its right shoulder down to 1297 following last week's failed breakout above 1342. On Monday the market put in lows of 1302.50, retested on Tuesday at 1303.25, and with the hold, Tuesday brought forth a reversal that led to 1328.50, testing last Friday's resistance. This led to a pullback on Thursday, retesting Tuesday's reversal as the market fell into Tuesday's open of 1306.75 and turned this number into the exact low on Thursday. Once again Tuesday's levels were heavily defended and we are seeing the market do another reversal higher, trading back through 1342 and now retesting last week's failure of 1336.50-1357.00. As noted on Tuesday in our market update- "We believe this pullback offers opportunity for buyers to step up and trade the long side, scaling out against upside resistance levels and adjusting stops accordingly." This move gives oppurtunity for these brave buyers who stepped up this week defending the inverted right shoulder down to 1297, to take some profits against these resistance levels. The market is yet to be fixed, however now must work through 1357 to continue the upside momentum and attempt to trade up to 1391, which retraces and retests where the market failed on May 1st. Ultimately the 1342-1262 inverted h/s targets 1422, giving room for new highs for the year, however we still have the May 2008 highs of 1441 to clip. Going forward a breach below 1302.50-1297.00 is needed to negate this formation and give room to retest the 1262 lows.
Risk Disclosure: Futures, foreign currency, and options trading contains substantial risk and is not for every investor. An investor could potentially lose all or more than the initial investment. Risk capital is money that can be lost without jeopardizing one's financial security or lifestyle. Only risk capital should be used for trading and only those with sufficient risk capital should consider trading. Past performance is not necessarily indicative of future results. Video content hosted by a third party.
Live Trade Room Example: This presentation is for educational purposes only and the opinions expressed are those of the presenter only. All trades presented should be considered hypothetical and should not be expected to be replicated in a live trading account.
Hypothetical Performance Disclosure Example: Hypothetical performance results have many inherent limitations, some of which are described below. no representation is being made that any account will or is likely to achieve profits or losses similar to those shown; in fact, there are frequently sharp differences between hypothetical performance results and the actual results subsequently achieved by any particular trading program. One of the limitations of hypothetical performance results is that they are generally prepared with the benefit of hindsight. In addition, hypothetical trading does not involve financial risk, and no hypothetical trading record can completely account for the impact of financial risk of actual trading. for example, the ability to withstand losses or to adhere to a particular trading program in spite of trading losses are material points that can also adversely affect actual trading results. There are numerous other factors related to the markets in general or to the implementation of any specific trading program which cannot be fully accounted for in the preparation of hypothetical performance results and all of which can adversely affect trading results.
© 2025 Chicagostock Trading. All Rights Reserved.