Chicagostock Trading

Chicagostock Trading

Knock-Knock

1-8-12b_1.jpg


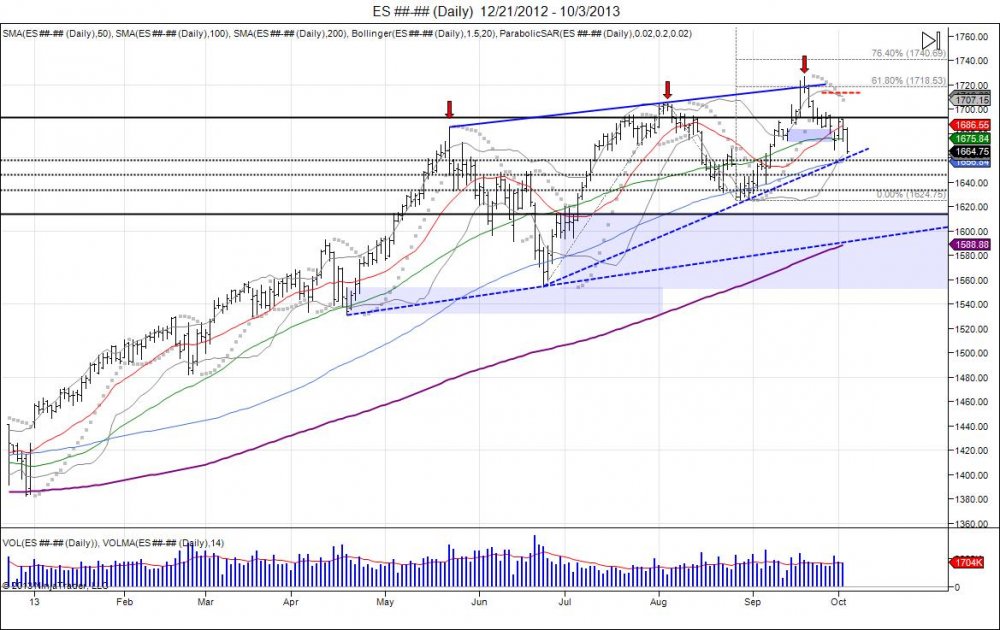
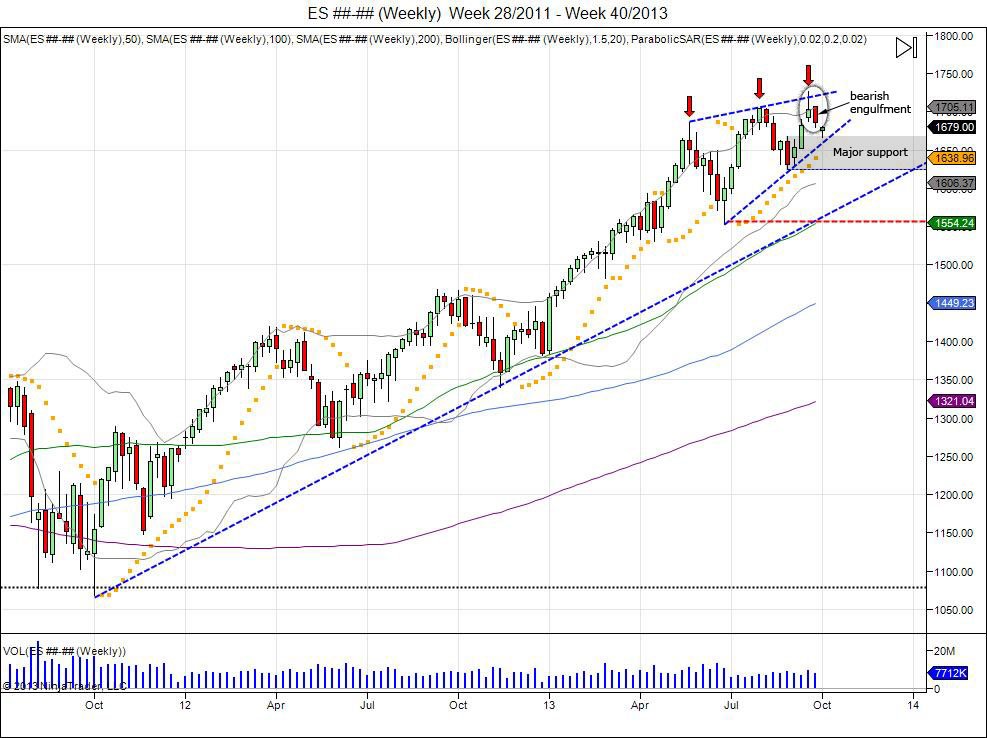
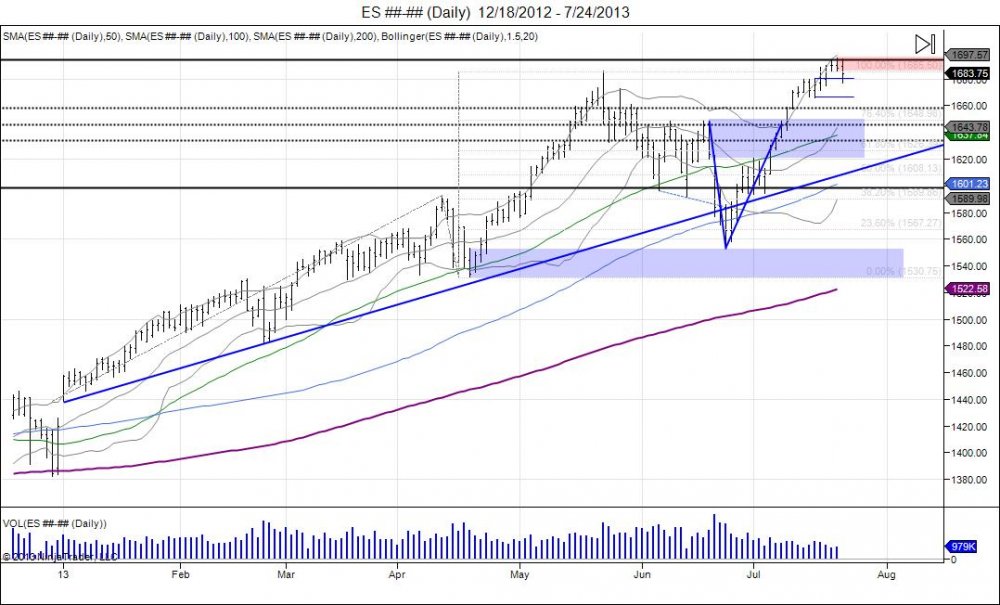
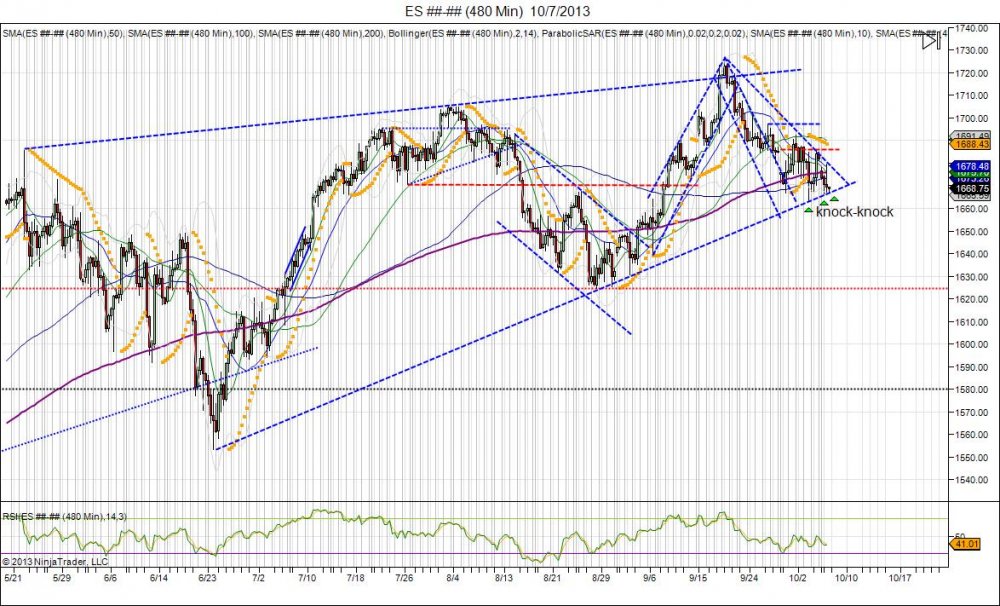
As seen in the above chart, since the biggest correction of the year - 1685-1553, the SP500 has made higher lows and higher highs.  These higher lows have come as the pullbacks became more shallow with buyers desperate to get in the market.  After putting in a flat top at 1705 in July and falling down to 162475, this was the second higher low after June's lows, and ultimately led to another higher high.  The new highs were made as the Fed surprised the market with no taper and no Summers, capitulating shorts as the SP500 briefly took out the top of this pennant up to 172675.  Since then, the SP failed to sustain the move, reversing to fall back to where it broke out into those highs at 1682.  Coming back to this level gave new buyers an area to defend the pullback after seeing shorts squeezed up to 172675.  Thus far, buyers have had a hard time turning the market back up.  This has led the market to fall into its rising trend line from the June lows, giving another attempt at "higher lows".  This time around, this trend line should not hold.  Why? Because not only did we have a failure to sustain the move into 172675 to create a bearish weekly engulfment which have given bears an area to defend up to 1690s, but we also have bulls who are attempting to buy this dip in front of politicians attempting to come up with a deal on the government shutdown.  Politics and markets never make a good combination. The bull buying the market now has to factor in this risk.  Friday saw the market close on its highs as algos squeezed shorts and bulls hoped for a weekend deal on the government shutdown. When this did not happen, the SP opened 8 handles lower on Sunday, putting in the 2nd Sunday in a row where the market gapped lower.  This has led the market to once again knock on its support trend line where bears are looking to breach the level and chase down to take out the June lows of 162475. Once this takes place, buyers from these levels will be shaken out and the market will confirm the move up to 172675 was a failed higher high.  From here the projection can be seen for a retest at 1690 to develop a right shoulder for a head/shoulder topping pattern. For this to take place again, the market must confirm weakness by taking out the August lows and breaking this trend of higher lows and higher highs.  For shorts to squeeze, 1692s must be taken out, which can then give way for a test of major resistance into 1710s.  A strong bear in control will not allow this to take place. The market now has someone to blame when moving lower, and that will be the GOP, while "no taper" decision will look smart, when in fact, thus far it has marked the highs.


Tags:
Continue reading
2525 Hits

SP500 & Nasdaq Back to Bottom of Rising Wedge

1-8-12b_1.jpg


The struggle to top since the first correction in May from 1685-1553, being the most violent of the year, led to higher lows and higher highs as new highs squeezed shorts and every dip became more and more shallow. Buyers continued to pile into these dips making them more shallow, afraid of missing "the next leg up". This recipe is what makes the rising wedge, and a recipe for disaster as bulls and bears make money, but hogs g slaughtered. Thus far the surprises from the Fed on "no summers" and "no taper" have held as the highs as shorts capitulated into 1726s and market gave it all back the following week. Bulls have another opportunity to make a higher low here as the market comes into this support line from the June lows. Failure to hold the August lows of 162475 break the wedge to give way for a test of the June lows to confirm the failed higher high up to 1726.


1-8-12b_1.jpg


Nasdaq chart shows breakout above rising wedge to squeeze shorts and move back inside wedge to retest support.  This can lead to a water fall effect with confirmation of top on a break of 3055.

Continue reading
3088 Hits

SP500 Market Update

Picture1.jpg


1-8-12b_1.jpg


The Emini SP500 rallied once again into the top of its resistance line from the past 2 highs this year on the surprises seen 2 weeks ago with "no summers" and "no taper".  This led the market into highs of 172675 as shorts capitulated, before seeing a reversal that retraced the market back to where it broke out.  Last week, the market fell to take out the lows of 168775 based off those weekly highs of 172675.  This retracement gave way for new buyers to come into support the market post the short squeeze as it came back to its breakout point, however the weekly close below 1693 established a bearish engulfment on the weekly charts, and the close below 168775 further setup bearish signals.  This sees the market coming down to test its major support of 1668 based off the 162475 lows prior to making these new highs. The trend remains up as the rising wedge tightens. Short selling remains aggressive and going against the trend until the market loses the 162475 pivot low prior to the highs. Once these lows are taken out, the market sees next major support down to 1615, followed by 1553 from the June lows.  A breach of the June lows at 1553 is confirmation of this rising wedge being the top to give way to the Cyprus lows down to 1530. Going forward, 1688 comes in as first major resistance, followed by 1713.  The fact that the market gave back all of its "no taper" squeeze, shows wall street is losing credibility in the Fed as they appear to be "all in" with their QE programs. This is where new/fresh buyers need to step in to continue upside momentum.  The 2nd half of the year has established a bullish bias as it has closed above 1693 for 7 days. To reverse this bias, the market must see 7 day closes below 1613.75.


Tags:
Continue reading
2366 Hits

Does Bernanke Leaving End the Bull Parade?

1-8-12b_1.jpg


In the aftermath of what was Bernanke's last testimony to congress, equity markets squeezed new highs for the year just as the testimony wrapped up. Most congressmen were applauding the chairman for his service, somewhat having the feeling of a farewell party. The question is, if the chairman is leaving, does this mean the QE party is over and who will be last to turn off the lights? The uncertainty of the next chairman and actions is unknown. It's been quite a ride for the year, opening above 1440, last year's resistance, and seeing a gap and go breakout. Moving through all resistance and squeeze shorts in the process. This took 5 waves in the first half of the year, with 2 being minor corrective waves as tops failed.. Shorts squeezed and investors piling in, forced into equities on a QE high. This saw record highs of 168575 last May before longs began to sell into the squeezed bid to take profits. Bernanke scared investors out on June 19th with worries of tapering QE, seeing the market reverse lower from 1649.  This started a shakedown and panic into testing major support based off 1530 which originally began the leg up through 1600. The bull strongly defended this test holding in the low 1550s to prevent the reversal in trend. The market was walked back up to the 1649 level just in time to give Bernanke a second chance on another FOMC release of July 10th, and creating a "V" bottom. Bernanke was able to calm the market enough to break through 1649, triggering a short squeeze to give way to take out the all time high from May.  The latest and "last" testimony to Congress from the Fed chairmen had the market sitting on all time highs.

The SP500 followed the Transports lower Wednesday after failing to take out 3 day highs and setting up a small flat top.  The bounce to test the highs was seen as Apple earnings led the stock to jump $20 higher, luring in buyers to the SP500 for a run through 1700, only to reverse lower and close below 3 day lows. The reversal has the market pressing against major support, within 1681-1665, based off last week's pivot higher.  Failure to hold this range sees weakness in buyers and a reversal on the daily chart.  This creates the potential for a double top with the market failing to attract new buyers after taking out the May highs.  New money at these levels have new risk of uncertainty of the next Fed chairman. Next support seen at 1650, followed by 1615 with sell stops below 1550. Breach of 1550 targets 1530 Cyprus lows and the pivot that led into these all time highs. Minor upside resistance 1688-1696, break through needed for buy side to continue momentum.


Continue reading
2675 Hits

SP500 FOMC Headfake = 157075, 153075.

ES________Daily___9_28_2012___6_20_2013.jpg

The SP500 fell down into a major trend line on Thursday based off support from the year lows.  This comes after the market originally broke out in May above 1593 to start the “5th wave” of the year from 1530.75-1685.75.  The highs at 1685.75 completed a 100% fib extension and since touching this level, sell programs from longs have been taking profits into rallies.  We saw the market fall down below 1600 in June twice. Both seeing a sharp reversal as the market squeezed shorts selling lows.  The last reversal on the 13th was much more violent.  It led the market to take out its 164850 high from June 10th by .50 as the market put in highs of 164900.  This turned into a failed breakout as sellers who stopped selling awaiting the FOMC statement, returned following the release.  They resumed taking profits in the market as the Fed continues to outline its strategy for exiting.  Why wait until the last minute when they are already hinting they want to slow down purchases? This is the case, especially after running up from 1438 this year and into 1685, 17%.  The resumption of profit taking post FOMC caught many off guard as it created that head fake above 1630, leaving shorts on the sidelines and buyers forced to exit the failed breakout. This is what has led to the fast chase into 1577 seen Thursday, just one week following the major reversal off 159175 and into 163350.  Going forward, this breakdown has caught many off guard and many are still not short the market.  This means the downside pressure continues to not allow shorts in and continue to press against next major support levels.  As the market retraces into this old 1593-157075 support range that led to the breakout in May, sell stops are seen below this range under 157075, being the lows late April that developed the support to breakout higher.  Breach of these stops takes the market to test its 100day moving average on the daily chart with next major sell stops being under 153075 as the pivot low in April that led to the 5th wave higher.  Once this low is taken out, then the market confirms the 5th wave is completed and that the move above 1593 is a potential for a failure.  This is the level (1530) one can look for support and to defend the market for a retest back to the 1593-1600 level to see if the market can regain above the level or turn support into resistance to start an abc corrective pattern following the 5 Elliot waves of the first half of the year.  New upside resistance now comes in within 1600-1610, followed by 1620, 1630, and finally 1640.  Move above 1649 is needed to derail the downside momentum and look for a retest of the highs.  Once 153075 fails, we are looking for a bounce into 1600 to create a right shoulder for a head/shoulder topping pattern. This 1530-1685 is a 155 point range which gives room to the downside at 1375.  However first thing is to fill the gap that started 2013 at 1420, followed by the 1375 support level. Thereafter, the market still has a gap from 2012 at 125250 that has yet to be filled. 


ES________Weekly___Week_32_2007___Week_25_2013.jpg


Tags:
Continue reading
1924 Hits

SP500 Johnny 5 Update

Who is Johnny 5?

Latest wave in SP500 1530.75-1685.75:

(click chart to enlarge)ES________480_Min___5_28_2013.jpg

SP500 8 hour chart above showing year to date trade.

First 6 months of 2013 = 5 waves:

Wave 1: 1438.25-1530.00 +91.75 6.4%

Wave 2: 1530.00-1481.75 -48.25 3.1%

Wave 3: 1481.75-1593.00 +111.25 7.5%  AVG VOLUME 9,436,701 

Wave 4: 1593.00-1530.75 -62.25 3.9%

Wave 5: 1530.75- *1685.75* +155 10.1% AVG VOLUME 9,344,753


Since blowing through 1593, the chase trade by buyers and short squeeze pushed the market to complete its 62.25 range (1593-1530.75) up to 1656.  This did not stop with the SP500 pushing through this, 1666, and into the top level of 1685.50 to extend the range 100%.  As shorts capitulated through 1673 into 1685, bulls used the bid to take profits into.  This led to a 3% decline down to 1632.75, shaking out the first 1646 level of sell stops.  The move was fast after the bear capitulation as sellers had to now chase.  With market falling into 1630s, bears chasing lows have been grinded out as market has used these bears to run stops above 1655 and into testing the 1670 level being where the SP failed off the high. The move has given more patient bears there chance to get in, now its up to see if they are stronger then this bull.  The bull has support at 1654 and sell stops below 1644.  Sell side gains ground with break of 1644 to retarget the 1632.75 low to confirm move above 1655 was failure.  Buy side needs to hold 1655 to continue pressure to retest 1672.75 from today's failed high.

Below is an excerpt of the 5th wave description in "Wikipedia"

"Wave 5: Wave five is the final leg in the direction of the dominant trend. The news is almost universally positive and everyone is bullish. Unfortunately, this is when many average investors finally buy in, right before the top. Volume is often lower in wave five than in wave three, and many momentum indicators start to show divergences (prices reach a new high but the indicators do not reach a new peak). At the end of a major bull market, bears may very well be ridiculed" (Source: Wikipedia - Elliot Wave Principle)

Ofcourse, this looks exactly like text book, wave 5 everyone is bullish, average investors forced to chase above 1593, and volume thus far has been lower then the 3rd wave. The 5th wave momentum continues until the pivot low of 1530.75 is taken out to confirm move above 1593 was a failure.

Same chart above, zoomed into last wave 1530.75-1685.75 (click chart to enlarge):

ES________480_Min___5_28_2013a.jpg

Continue reading
5083 Hits

SP500 Maxes 100% Fib and Reverses

ES________480_Min___5_23_2013.jpg

As soon as the SP500 hit its 100% Fib extension level of 1685.50, sell programs kicked in as the SP500 printed highs of 1685.75.  The move occurred after a squeeze through previous highs of 1673, seeing shorts capitulate which gave way to the 1685 print.  Smart longs sold into this bid to take profits. With longs taking profits, shorts already being stopped, the market fell down to retest its open. After trying to retest the highs and failing to find buyers at 1681, the market fell off to take out its session lows to reverse the intraday trend as more longs locked in profits and short sellers sat on the sidelines looking at the market drift lower.  With shorts out the market, this created a chase to the downside into 164650 to retest the pivot low of 1646 made last Thursday prior to Friday's move into 1665.75. A 40 point rejection off the top level of 1685 and a press to test the downside resistance range at 1656 to see if that old resistance acts as new support for a retest of the mid level at 1666-1670.  This has raised the stakes for bears as the range to defend has widened.  Failure to hold 1646 sees more shorts left on the sidelines and a wider range (40) to defend the high.  Market remains in its 5th wave that began on the breach of the old 1593 highs with a pivot low of 1530.75 occurring during the "4th" corrective wave.  As market moved past 1593, buy side chased and shorts squeezed from the 1593-1530 giving way into 1656.  Sell stops have built along this wave 1530-1685 below 1646, 1620, 1607, 1570.75, and ultimately the 1529.50 low from Cyprus.  Wave 5 ends on a breach of that pivot low that began the wave at 1530.75.  With that taking place, a confirmation will then be made that the move above 1593 was a failure and an "abc" corrective pattern can be seen should the market be able to bounce after breaking 1530 to retest the 1600 level and see if it can get back above. 

ES________Daily___12_21_2012___5_23_2013.jpg

See: "SP500 Wave 5 How High Will It Go"


Continue reading
3651 Hits

SP500 Wave 5 How High Will It Go

ES________480_Min___5_15_2013.jpg

Click to enlarge

The latest breakout above the previous high of 1593 is extending to be the 5th wave of the 2013 breakout above 1440.  As seen in the charts, the market has had 5 waves this year.  The first wave starting from the year lows of 1438.25 to the February high of 1530 rising 6.4%. The corrective wave off these highs retraced 52.6% to 1481.75 before stabilizing.  The breakout above the previous high of 1530 began the third wave up as the market rose 7.5% into 1593 in April before correcting.  The corrective wave off these highs retraced 56% to 1530.75 before once again stabilizing.  The latest squeeze through 1593 has become the new wave up, being the 5th wave of the bullish trend.  The 5th wave is usually the strongest out of the 1,3 ,5 buy waves as it attempts the final squeeze and extension of the trend, luring in the late buyers.  This happens as the market never pulled back to retest the April lows allowing for buyers to defend 1550s, and forcing a chase above 1600.  The chase thus far has been strong, with the market extending 76.4% above 1593 at 1648.75, and up 7.7% from the 1530.75 low, already a larger % move then the 1st and 3rd buy waves. Major resistance is being met at these levels. The range of 1593-1530.75 (62.25) completes at 1655.25 to be a +8.1% (1593+62.25). Next level comes in at 1666 to mark 1k points off the lows and 8.8% move from 1530.75, followed by 1685.50 as the 100% fib extension and 10.1% off the 1530.75 low.  As this latest wave pushes higher, bulls are most present and bears are ridiculed. Major upside targets are being thrown out, pumping the market.  As per the Elliot wave, once the 5th wave completes by seeing a correction off the highs, an a,b,c corrective pattern can be attempted. This can turn into a consolidation to build a base or a head/shoulder pattern as A is the wave off the high, B the wave to retest the high, and C the wave that fails the retest and falls to take out previous low from A which is needed to confirm change in trend.

Wave 1: 1438.25-1530.00 +91.75 6.4%

Wave 2: 1530.00-1481.75 -48.25 3.1%

Wave 3: 1481.75-1593.00 +111.25 7.5%

Wave 4: 1593.00-1530.75 -62.25 3.9%

Wave 5: 1530.75- *1685.75* +155 10.1%

Wave 5 ends when market turns back to take out the pivot low of 153075 that began the chase through 1593.

Sell stops are loaded up on the downside as the market built bases into the upside squeezes. These come in below 1620, 1607, 157075, 152950.

Continue reading
5518 Hits

FLASH BACK on the FLASH CRASH

Going into May 6th, 2010, the SP500 was already having trouble on a daily basis, distributing within 1180-1220. After originally making a high of 1210.50 on April 15th, the market fell down to 1179.75 before recovering to take out the 1210.50 high and stop out early shorts.  This higher high up to 1216.75 failed to hold, seeing the market reverse to take out the previous 1179.75 low.  Lows of 1176.75 before another bounce was seen to retest the failed higher high at 1216.75.  The retest turned into a right shoulder as the market failed to push through the April 26th highs and fell through the previous low of 1176.75 to confirm a head/shoulder pattern.  Going into May 6th, the market had already broken below 1176.75 and had a target of 1136.75.


DRUDGE05_06_10.jpg 

SP5_6a.jpg

On the day of May 6th, 2010, the market was well below its 1176.75 neckline, opening at 1157.50 and making highs of 1165.00.  Pictures and videos of Greece riots being shown  added fuel to the fire. Things quickly deteriorated after the market fell below 1154 and turned the level into resistance.  This led to the head/shoulder target of 1136.75 to be completed.  With this target completing, this is when the flash crash flushed the market from 1130 down to 1056 before recovering back to the 1130 level into the close.

DRUDGE05_06_10A.jpg


Eventually, the market retraced back to its broken neckline of 1176.75 by making highs of 1174.75 before turning back lower to "back and fill" the flash crash lows of 1056.  Lows of 1002.75 were made in July of 2010 before reversing off the lows and into 1127.75, being were the market failed the prior month in June.  With the markets back to whipping back and forth in attempt to consolidate and build a bottom, a retest of the 1002.75 lows was made with the market falling down to 1037.00 on August 25th just before Ben Bernanke's Jackson hole meeting.  During this meeting "Bernanke Says Fed Will Do `All It Can' to Ensure U.S. Recovery".  With the Federal Reserve promising to defend the markets, this turned the retest of the summer lows into a bottom and the markets turned higher to see a breakout "gap and go" on September 13th with the market making lows of 1108 and holding above the prior day's high close of 1105 to leave a small gap open, giving way for a short squeeze to move back higher and take out the earlier April high of 1216.75 which eventually led to 1373.50 on May 2nd, 2011 before going through another consolidation period that presented another correction, filling the 1105 gap. Another volatile period and more promises of support from the Fed led to another gap and go breakout to start 2012 with a gap open higher with lows of 1259.75, keeping open a gap down to 1252.50 from December 30th and giving way for another short squeeze to move back higher and take out the May high of 1373.50. Throughout 2012, the market kept this gap at 1252.50 open to create another bottom during summer, targeting the year highs.  Small correction in fall of 2012 as the 1441 upside target was completed, making highs of 1468 before falling down to 1340.25 in November to retest where the market broke out in August.  Since these lows, another gap has been made, with 2013 opening above 1440 with lows of 1438.25 and a previous close of 1420.  This has led us to where we are now as the market has gone through another major short squeeze, bubbling throughout the year to take out the all time highs of 1586.75 and breaking above 1600 on the latest non farm payroll number reported on May 3rd.  


Continue reading
5073 Hits

Japanese May Flowers = Equity May Showers

6J________Daily___9_21_2012___5_2_2013.jpg

Yen is trying to round out a bottom. After retesting lows and not breaking, the Yen is back to retesting where it failed from April 15th with highs of 10383. This has led to a pause in the market as it consolidates builds support to continue the pressure against this level.  Support is seen down to 10150 ever since the market squeezed the level and turned on the short squeeze. Squeezing above 10383 confirms double bottom and gives room to target 10883 from where the market failed early April as the Bank of Japan came out with stimulus, derailing the March bottom attempt. By coming back to this level the yen will have rounded out a bottom from 108-100-108, leaving shorts who sold the BOJ stimulus wrong. This will turn the level into support as the market will also retrace 50% of the year highs 11531-10008. Recovery above 108 will attract buyers to press the gas against shorts to target year highs of 11531 and fill gap up to 118 from November. 

During the past 4 years the Yen has had a tendency to bottom during the Spring months. 


Equities were squeezed to new highs on the last day of trading in April as equity shorts threw in the towel.  This led the Emini SP500 to take out the previous high of 1593 and put in new highs of 159550. Nasdaq completed the squeeze of taking out last year's highs of 287175.  To start May, equities reversed sharply off the highs to close below Tuesday's lows.  These lows now act as major resistance and what buyers need to overcome to retest highs. On the ES daily chart, the breakdown setup an outside bar bearish reversal, by opening above previous day making a higher high and closing below previous day's lows. The breakdown was fast and sharp as shorts had already thrown in the towel the day before, so they were left behind, having to come back and offer the market down as they chased back in. This gives way for the SP500 to test support down to the mid 1550s of where the market broke out after putting in a 153075 low in April as sellers failed to break the Cyprus 152950 low.  Shorts have already been cleaned after failing this breakdown and ralling to take out the highs and squeezing them out.  Coming into this range of support allows buyers opportunity to defend and continue the upside momentum.  Failure to hold and breach of 153075 confirms a double top with room to target the year lows.  Once the SP500 takes out the year lows, prices above 1440 will not be visited for a long time. A Yen short squeeze will put pressure to make this break take place.

On Wall Street, the old saying is the markets like to climb the wall of worry, and they have surely done so this year moving higher in the face of all negativity along with two attempted breakdowns in February and April. These are what we call "cracks". We like to say the market climbs higher on glass stairs. Reason being is ever since the 08 crash and 09 bottom at 665.75, the market has been VERY fragile and on life support through the Fed.  As we have seen, the glass stairs have been broken several times since the ride from the 09 lows and each started with cracks first before falling through violently, flash crash and debt downgrade in 2011.  The recent February and April corrections were the first cracks in this latest climb of glass stairs.


The Ultimate Short Squeeze 665-1441 & Accurately Predicting Every Correction Using Technical Analysis


ES________Daily___6_14_2012___5_2_2013.jpg

Continue reading
1224 Hits

Bonds, Stocks, and the YEN


ZB________Daily___3_13_2012___4_28_2013.jpg

The 30 year bond has consolidated above 14617 in an effort to hold above the year highs after seeing a massive short squeeze that reversed the market from the year lows of 14014. Squeeze was fueled by shorts as the market broke below the February lows on the March NFP release to put in these lows, the market saw a recovery the following Friday going into the "Cyprus bailout".  Cyprus news led to gap above 14200 turning level into a failed breakdown as market continued to force shorts to cover until the year high was taken out. The move caught many off guard and in turn cleared out shorts in the market. By holding above 14617 the market now tries to build a base of support to attract buyers that neglected bonds for stocks earlier in the year.  The market sees major resistance against 14923. Taking the range of 14617-14014, gives way to push toward 15221 high from November.  Just as the Yen tries to target its November gap.   


  6J________Daily___8_28_2012___4_28_2013.jpg


Yen and SP500 show almost exact contrast comparison.  As Yen tries to double bottom in April, SP500 is trying to double top.  The Yen made lows of 10008 and 10013 before squeezing through 10158 last week.  This level has turned into a new area of support should the double bottom be good. Holding above 10150 gives room to force shorts to cover to give room to take out April 15th's 10383 high with next major level of stops above 10809 from April 2nd highs. Above 10809 confirms double bottom against 100 to give way for a massive short squeeze to target the year highs at 11531 and give room to fill last November's gap at 11790. During the past 4 years the Yen has had a tendency to bottom during the Spring months. 


ES________Daily___6_18_2012___4_28_2013.jpg

In contrast the SP500 has a small double top as market most recent reversed from 153075 to retest 1593 by making a high of 158825.  As the market hits it's head against this resistance it has managed to hold above 1570 to create a very tight trading range. Move past 1588 is needed to retarget 1593 for stops.  Break of 1570 gives way to test support at 1555 based from the 153075 pivot low.  Taking out this low would confirm the double top to give way to cross the "line in the sand" from the Cyprus lows of 152950 which have held like a rock.  This is line in the sand, just as 108 is the line in the sand in the Yen and 14617 was in bonds.  In contrast to the Yen with the gap at 11790, the SP500 has a gap down to 142575. 

Continue reading
3384 Hits

SP500's Struggle and Failure

ES________Daily___11_6_2012___4_18_2013.jpg


The market fought gruesomely in squeezing out shorts as sellers were attracted following the Cyprus breakdown. This led to a major tug of war, making higher lows and higher highs until 1568 printed and the market reversed into the April NFP report to shake out the series of higher lows test 152950 and hold. Once again luring in shorts thinking the 1568 was the top, only to see a massive short suqeeze taking the market through the old 1568 high to stop early shorts and print new highs of 1593 as the all time highs of 158675 were taken out. 

Since taking out all time highs, the market fell back to retest where it broke out above at 1568. Old resistance failed to hold as new support as the market fell below 1568 which saw next level of support tested at 1555 from the April 5th NFP highs.  The market attempted to stabalize this level, however with the Boston tragedy, selling pressure drove through this down to retest the NFP low of 153325 as the market held at 153875.  This hold led to a bounce back on Tuesday, resetting the market as it came back to the 1568 level to allow sellers a bounce to defend and buyers another oppurtunity against the highs. Buy side failed to materialize and hold 1568 which in turn has seen sellers take control to reverse the market back below Monday's 153875 low.  In turn the bounce to retest 1593 has turned into a right shoulder of a head/shoulder topping pattern.  The neckline was broken on Wednesday as the market took out Monday's lows of 153875, giving 1568 shorts their first target.  At this point buyers are forced to defend last week's lows of 154300.  Closing below this for the week triggers sell signals going into next to continue the move lower. Closing below the daily neckline of 153875 gives room to expand the range of 54.25 (159300-153875) down to 1484.5 which would be a retest of the February lows at 148175. The Cyprus low remains the line in the sand which was a retest of the old February highs, falling below gives room to target February's lows with next major support within 1465-1450.

Continue reading
3572 Hits

SP500, Bonds, Yen, Euro Chart Updates

 SP500

ES________60_Min___3_27_2013b.jpg

Since the gap down two Sunday's ago on the Cyprus news and bouncing off the old highs from February at 1530, the market has gone into a major tug of war whipping short sellers who have tried to come in following the news.  The "plunge protection team" has managed to keep the momentum alive with higher lows.  Just 1 week after that gap down, the squeeze managed to print new highs on the year at 1560.50. Following this new high,  another pullback was seen to retest the prior low of 1535 only to see another higher low develop at 1539.  On Tuesday this led to a recovery that retested and pressed against resistance based off the Sunday high.  This has led to the market climbing back Tuesday night and retesting the 1560.50 level with the market tapping it again, however failing to breach.  Thus far this has led into another pullback, retesting the previous lows of 1539 with lows of 1545.75.  Higher low again as the range tightens and the market builds buy stops above the highs going into the holiday weekend. Sell stops also building below this trend of higher lows and they will be targeted eventually, question will be if momentum can stay alive into the holiday weekend as the range is now 154575-156050.  Resistance met against 1558 with stops above 1560.50.  Support  1548-1539. Bonds as shown below have continued to hold their bid following the Cyprus gap above 14200 and this has led to tap the March highs of 14429.  The squeeze eventually completes on a move past the February high of 14611 to confirm the break below 14200 as a failure.

Continue reading
3458 Hits

SP500 Double Top Caution

 ES________120_Min___3_25_2013.jpg


Last Sunday's breakdown to 1529.50 on the Cyprus news saw the market bounce off the old February highs of 1530 with lows of 1529.50.  This led to a roller coaster ride for the week as the market climbed back to 1552.50, fell down to 1531.75, squeezed back to 1555.75, fell back to 1535.00, and most recently completed the pattern of higher lows and higher highs by getting up to 1560.50.  This was a calculated attempt to defend those lows and make higher highs to squeeze out small sellers.  The latest high was done this Sunday night (one week after the gap down from 1544-1529.50), stopping out small shorts as the previous year high of 1558.75 was taken out.  The market has thus far rejected this new high and fallen down to where the it opened on Friday.  There is major risk now that this higher high turns into a failed breakout and a double top should buyers failed to defend the most recent pivot low of 1535.00.  Minor support off these lows are seen at 1539, however buyers should find it much harder to hold this trend and the lows of 1535 after new highs were set at 1560.50 which give much more pressure to take out these rising lows and squeeze out buyers.  This would confirm the new highs as a failure a double top with a breach of 1529.50. As discussed in the previous video, the market has been working on creating a head above 1530 for a head/shoulder topping pattern which confirms on a move below 1481.75.  


Continue reading
2531 Hits

Fear Turns to Greed at Breakeven.

2011 vs 2012 Patterns compared

ES________Weekly___Week_18_2008___Week_11_2013.jpg

Click charts to maximize.

The SP pattern from January of last year gapping open at 1259.75 above resistance just as the gap open at 1108 in September of 2010, is now mimicking the % move. The first breakout in September of 2010 at 1108 recall was just after the year of the Jackson hole QE start in August and the volatile period during that summer range to put in a bottom at 1002.75. The breakout in September squeezed a 24% rally leading the market into highs of 1373.50 to test the range from May of 2008 of where the fall out began. Last January this pattern was mimicked again with the market gapping higher at 1259.75 to start another breakout following another volatile period during the summer with lows of 1068. This gap at 1259.75 has held open and the wave has now squeezed the market up 23.1%, putting it right at the door steps of resistance from the range off all time highs of 1586.75. At this point the market is testing major resistance based off the all time highs and seeing a small pause. Whether the market can muster enough strength to squeeze through and stop out shorts to follow the Dow Jones average into new all time highs is yet to be known. The next major resistance would be the 1600 level as everyone sees, keyword everyone. The biggest risk is the SP500 not taking out the all time high, thus buyers remain complacent looking for new highs, buying pullbacks which gives way to setup bag holders.


Tags:
Continue reading
4148 Hits

Reversals of the Year

 dx3_1.jpg

Continue reading
3441 Hits

How We Played This SP correction and Setting Runners for Homeruns

 ES2_26.jpg


With the SP500 squeezing the December 2007 high of 1527 and running into 1530, the rug was pulled underneath as bids lifted and sellers came in to take profits.  This led the market to correct down to 1495.00, testing its 1498 support level it broke out of in January.  This setup an aggressive attempt to sell any retracements retesting the 1530 level.  On Monday, the retracement was seen.  Our signal was offered at 1515 and using the 1530 highs as the exit.  The market came close up to 1524.50 before reversing lower to complete target 1 at 1498, locking in 1 times the risk for 17 handles.  Target 2 was 2 times risk at 1481, however with the market falling so quickly the same day, we were happy to lock in 1483 for another 32 handles to total 49 locked in. What is left is "running" positions where only profits are risked.  The runners should double the 49 handles locked in to turn the trade into a home run.  These don't always happen, but this is how we like to position trades for big moves, by scaling out to reduce exposure and leaving only runners to go after big targets.  Target on these runners are currently 1420. This is not to say the market will go straight there, however this would be a breach of MAJOR support within 1455-1465 and would fill last year's gap down to 1423.  Doing so, will pay 95 handles just on the runner positions.

Continue reading
2969 Hits

Major USD Reversal No One is Talking About


US DOLLAR:

DX2_25.jpg

The US dollar is one of the most important, yet least discussed chart of the year.  Noticing the dollar's break below 79600 late January, early February, only to establish a bearish bias and lure in shorts before turning around higher. The market has held above its reversal window, thus reversing the bearish bias which has led the market to take out its year highs of 8100 set early January.  This U turn is having a major effect and pressure on commodity markets as the USD failed to break lower and is trading on new highs for the year. Take note of the gold chart how it is completely opposite of the dollar chart and is an upside down "U" from the beginning of the year.


ES________Daily___3_14_2012___2_25_2013.jpg


Click charts to maximize

Continue reading
2710 Hits

UPDATE SP500, Crude Oil, Gold

SP500 120 MINUTE:ES________120_Min___2_13_2013.jpg


OIL 120 MINUTE: 

CL________120_Min___2_13_2013.jpg

Continue reading
881 Hits

SP500/Crude Oil Chart UPDATES

OIL HOURLY: CL________60_Min___2_4_2013.jpg


SP500 HOURLY:

ES________60_Min___2_4_2013.jpg


SP500 DAILY: 

ES________Daily___3_14_2012___2_4_2013.jpg

Click charts to maximize.

Continue reading
1209 Hits